4.8 Summary
This chapter introduced three types of Python collections: lists, tuples, and dictionaries. Together with strings, these four data types provide us with a powerful set of tools for solving problems. To investigate the use of these collections, we developed a set of algorithms for performing basic statistical analysis. In particular, we implemented functions to compute the following:
▶ Dispersion (simple range and standard deviation)
▶ Central tendency (mean, median, and mode)
▶ Frequency distribution
We introduced the methods of the statistics module, which also perform these operations.Finally, we used the Turtle class to create a graphical representation of a frequency histogram.
Key Terms
Python Keywords, Functions, and Methods
Programming Exercises
-
4.1
matplotlibis a powerful graphing package for Python that can draw histograms, bar charts, scatterplots, and many other kinds of graphs. It is particularly useful if you are taking a science course in which you need to graph and analyze data. You can read about and downloadmatplotlibfor your computer at https://matplotlib.org. Read the documentation to learn how to use this module to plot a histogram of the data shown in this chapter. -
4.2 Given a list of points of the form [(x1, y1), (x2, y2), ..., (xn, yn)], write a function called
plotRegressionthat accepts a list as a parameter and uses a turtle to plot those points and a best-fit line according to the following formulas: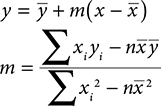
where
 is the mean of the x values,
  is the mean of the y values, and n is the number of points. The Greek letter
  represents the sum operation. For example,
  indicates the addition of all the x values.
Your program should analyze the points and correctly scale the window using
setworldcoordinatesso that each point can be plotted. You should then draw the best-fit line in a different color through the points. -
4.3 Have you ever tried to talk like a pirate? Write a function,
toPirate, that takes an English sentence in the form of a string as a parameter. ThetoPiratefunction should return a string containing the pirate translation of your sentence. Use the following table to construct a translation dictionary. You can also consult an online website for more pirate phrases.English Pirate Translation Greetings hello
excuseavast
arrrPeople sir, boy, man
madam
officermatey
proud beauty
foul blaggartArticles the
my
your
is
areth’
me
yer
be
bePlaces kitchen
hotelgalley
fleabag inn -
4.4 Now try an even more challenging exercise: Translate two-word phrases into their pirate equivalents. For example, the two-word phrase “excuse me” would be translated into simply “arrrr.”
Design Credits: Calculator Icon made by Smashicons from www.flaticon.com