Perspectives on energy resources
Abstract
The latest market penetration statistics for renewable energy production is presented, followed by a brief historical overview of the role of renewable energy from early Neanderthal societies to the present. Remarks are made on the social and environmental issues that will be dealt with in this book, in order for renewable energy solutions to qualify as sustainable.
Keywords
Energy market; Renewable energy penetration; Stone Age energy use; Neanderthal energy use; Energy history
1.1 Current renewable energy market
The penetration of renewable energy into the energy system of human settlements on Earth has, from one point of view, always been nearly 100%. The energy system experienced by the inhabitants of the Earth is dominated by the environmental heat associated with the greenhouse effect, which captures solar energy and stores it within a surface-near sheet of topsoil and the atmosphere around the Earth. Only 0.02% of this energy system is currently managed by human society, as illustrated in Fig. 1.1. Within this economically managed part of the energy sector, renewable energy sources currently provide about 25% of the energy supplied. As the figure indicates, a large part of this renewable energy is in the form of biomass energy, either in food crops or in managed forestry providing wood for industrial purposes or for incineration (firewood used for heat and cooking in poor countries or for mood-setting fireplaces in affluent countries, residue and waste burning in combined power and heat plants or incinerators). The other sources of renewable energy exploited include hydro, wind, and solar. Hydropower is a substantial source, but its use is no longer growing very fast, due to environmental limits identified in many locations with potential hydro resources. Passive solar heating is a key feature of building design throughout the world, but active solar heat or power panels are still at a minute level of penetration, although growing fast. Also, wind has both a passive and an active role. Passive use of wind energy for ventilation of buildings at least used to play a significant role, before the advent of super-tight buildings with forced ventilation, and active power production by wind turbines is today a very rapidly growing energy technology in many parts of the world. The highest penetration, exceeding 42% of total electricity provided, is found in Denmark, the country that pioneered modern wind technology. Additional renewable energy technologies, so far with fairly modest global penetration, include gaseous or liquid biofuels and geothermal power and heat. As indicated in Fig. 1.1, the dominant direct energy sources are still fossil fuels, despite the fact that they are depletable and a major cause of climate change, as well as of frequent national conflicts, due to the mismatch between their particular geographical availability and demand patterns.

From a business point of view, the equipment needed to transform renewable energy flows into the energy forms demanded is, of course, as interesting as the fuel energy that can be traded in a market, even if renewable energy flows such as solar radiation, wind and atmospheric heat themselves are considered as free.* Current renewable energy markets comprise both consumer markets and markets driven by government demonstration programs and policies aimed to diminish market distortions. The occasional initial subsidies were part of an industrial policy aimed at helping new industry through market stimulation. Compensation for market distortions addresses the fact that conventional energy industries are not fully paying for the negative environmental effects of their products. This is a complex issue, partly because of the difficulty in exact determination of external costs and partly because most countries already levy taxes on energy products that may in part be seen as contributing toward paying for any environmental damage, but often they are just a government revenue not specifically used to offset the negative effects associated with using fossil or nuclear fuels (read more about these issues in Chapter 7).
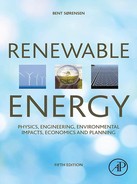
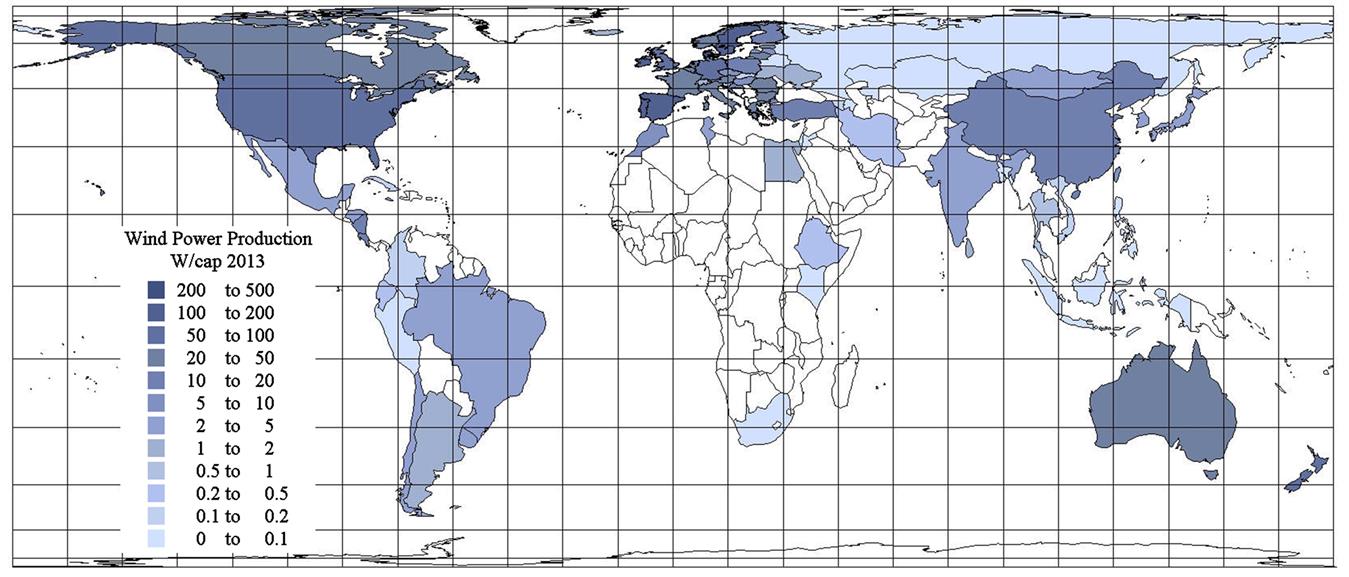
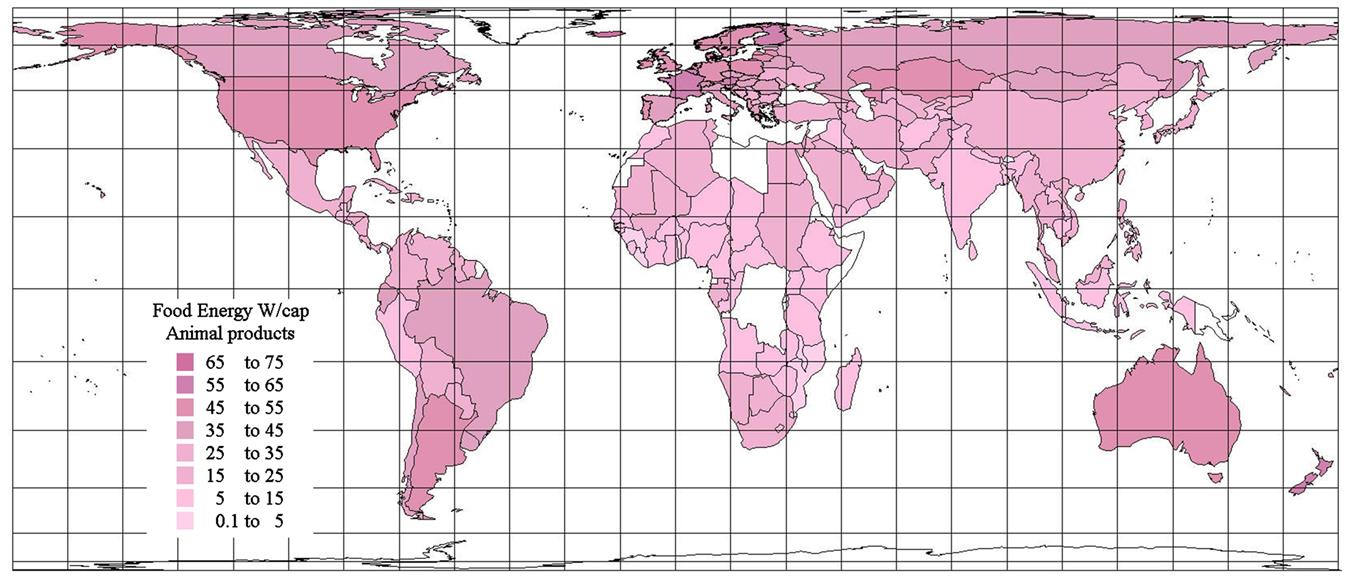
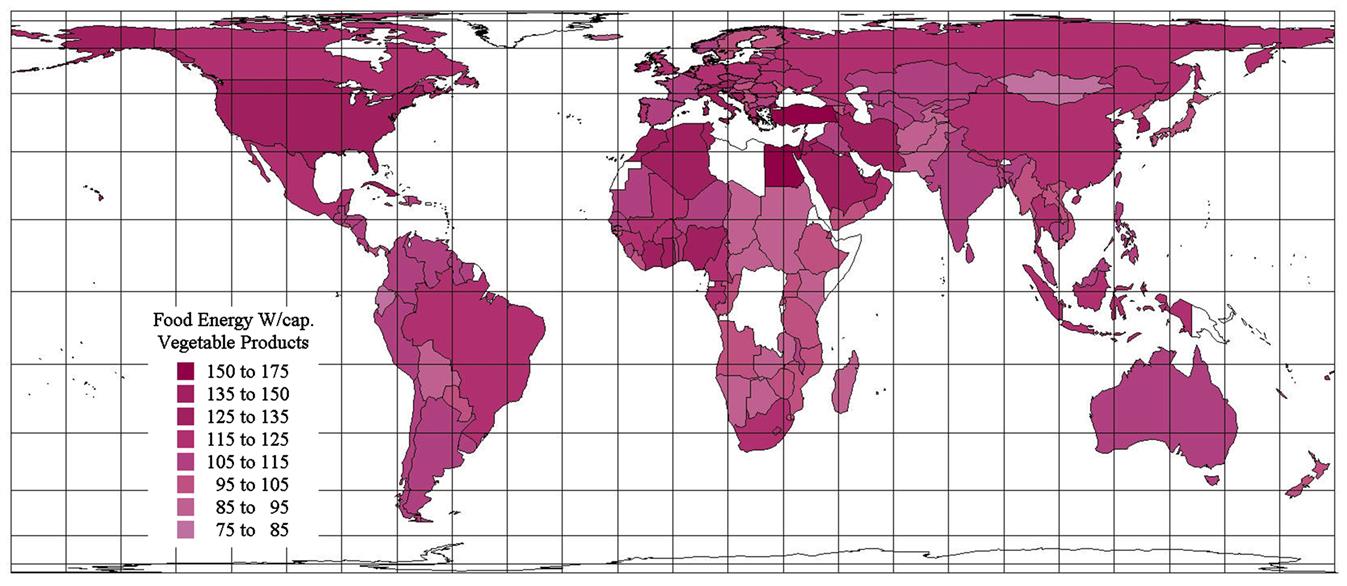
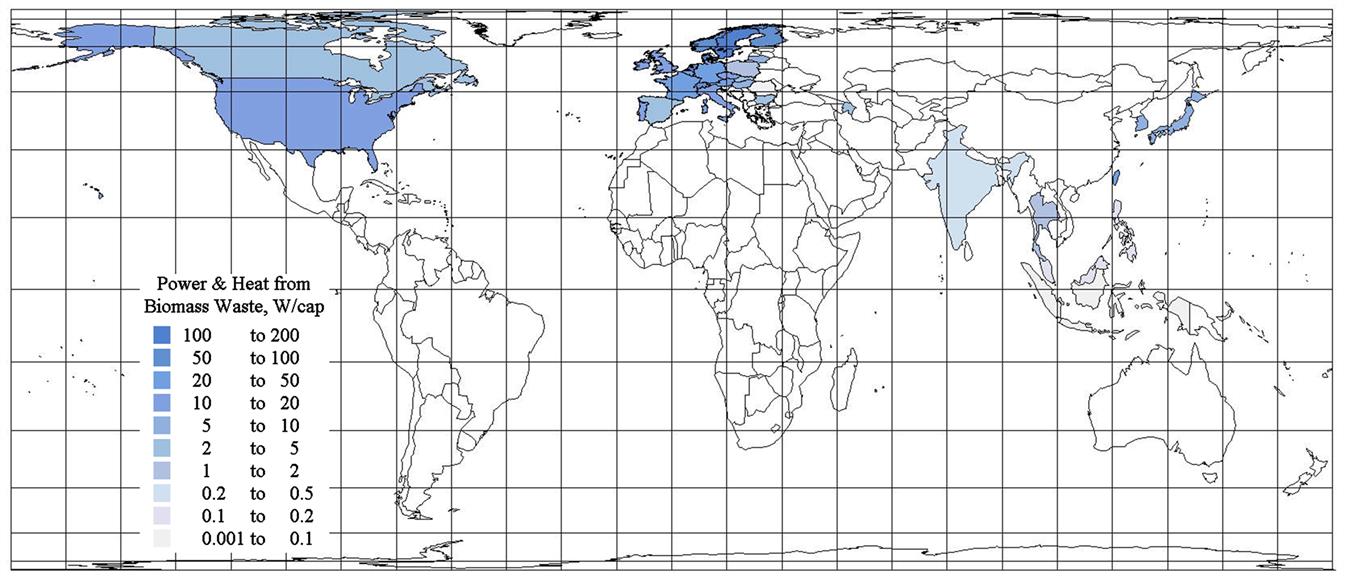
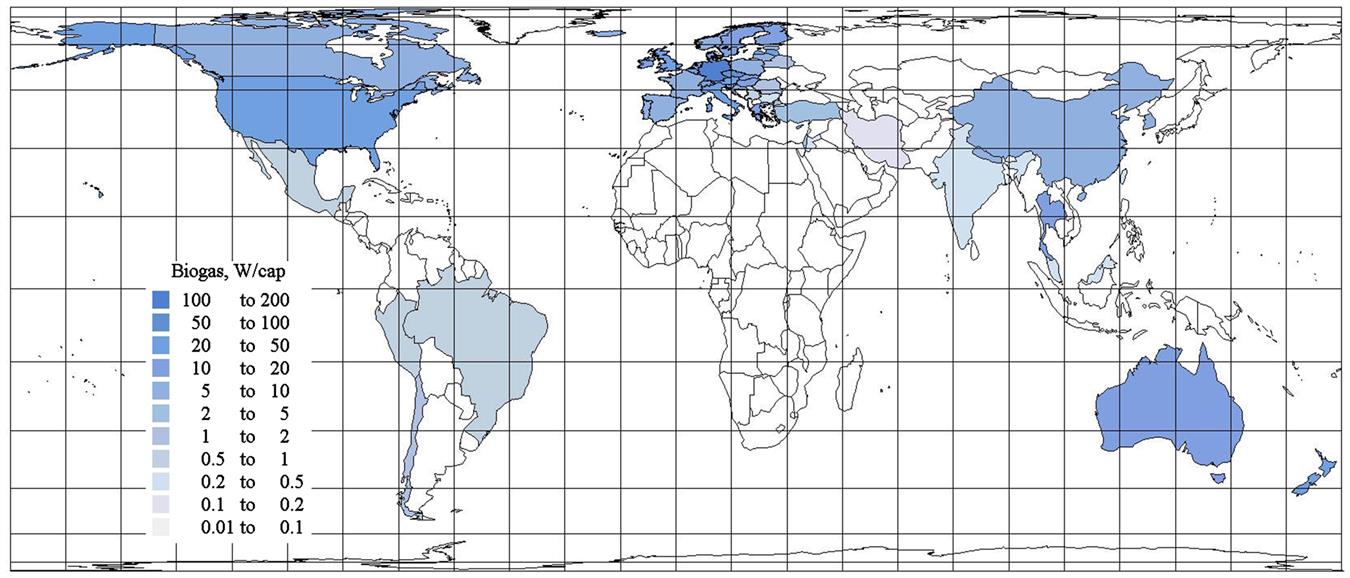
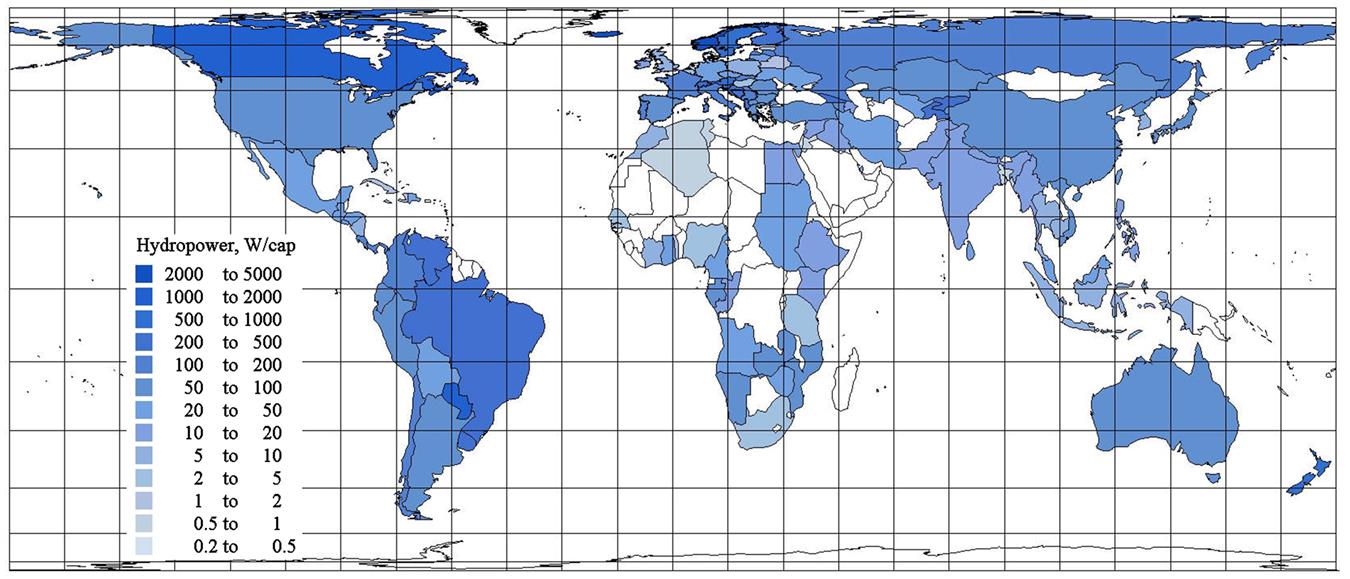
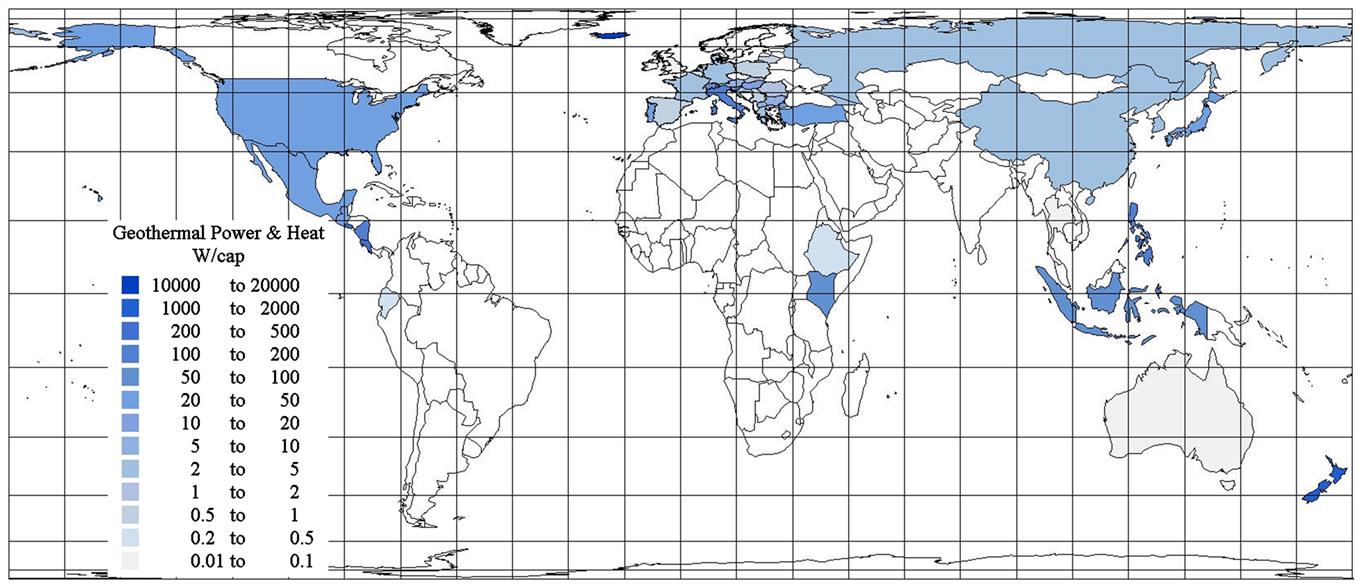
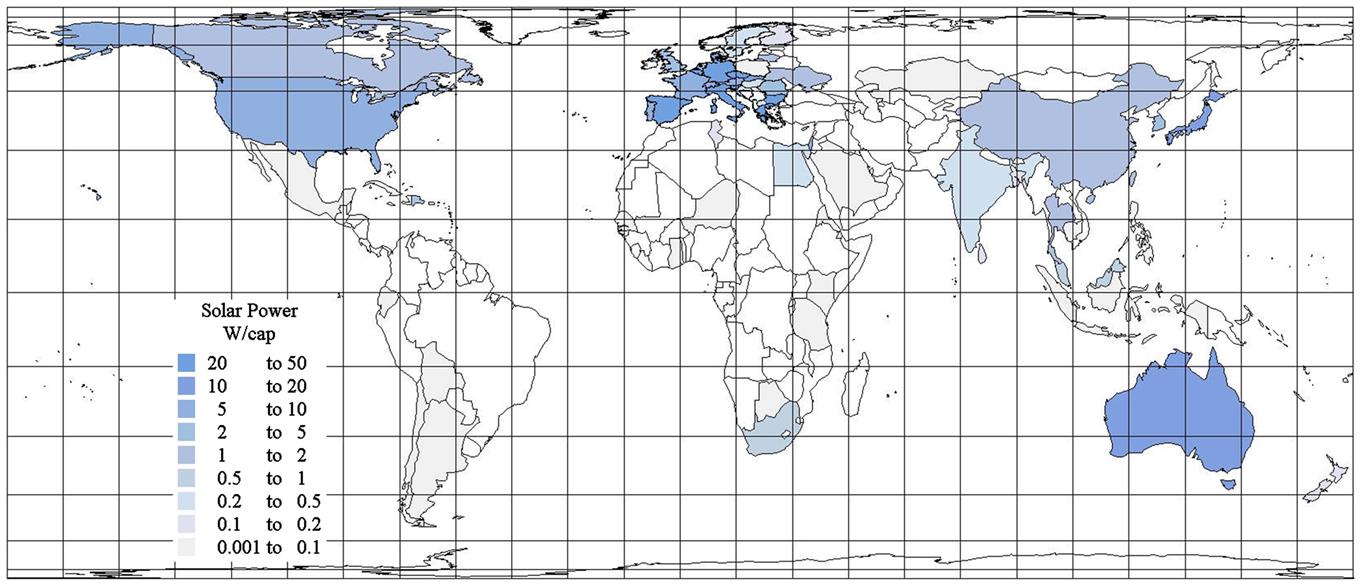
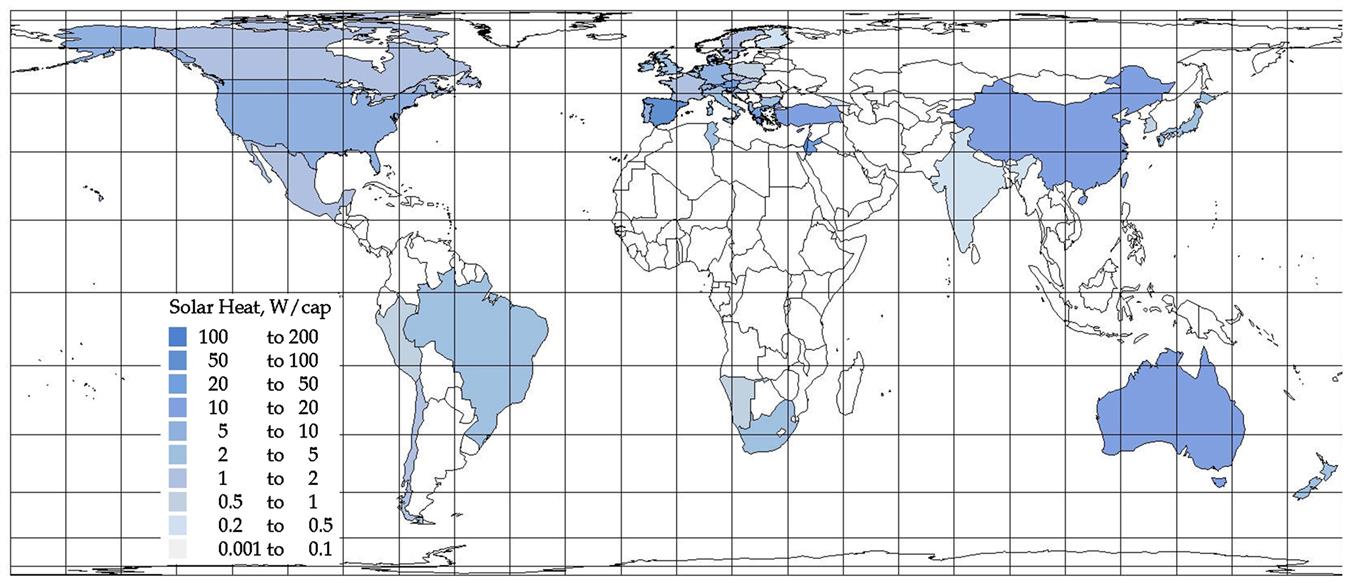
The current penetration of active use of renewable energy in national energy systems is rapidly growing, and the values for the year 2000 shown in Table 1.1 may serve as a reference year for assessing newer data, such as the 2013 data shown in Table 1.2 (latest global data available 2016, having to go a few years back in order not to miss data from a considerable number of late reporting countries). All renewable energy production levels are given in W/cap., averaged over each country. Country totals derived by multiplying data with the 2013 country-populations (shown in Fig. 1.2; cf. Fig. 6.1 showing the population distribution on an area basis) are given at the end of Table 1.2. The data from Table 1.2 for installed renewable energy production is showed graphically in Figs. 1.4–1.15, for each technology. For wind power, also the year 2000 situation is shown in Fig 1.3, exhibiting the very large growth in produced wind power between 2000 and 2013.
Table 1.1
Year 2000 average renewable energy use (W/cap., based on UN, 2010; FAO, 2003; OECD/IEA, 2002; cf. Fig. 1.2 for wind power)
| Country W/cap. or number | 2000 Pop ’1000 | Hydro | Geoth. power | Geoth. heat | PV | Solar heat | Tidal | Wind | Bio-Res | Bio solid | Bio liq | Bio-gas | Anim. food | Veg. food |
| Afghanistan | 17 270 | 3.6 | 0 | 0 | 0 | 0 | 0 | 0 | 0 | 0 | 0 | 0 | 11.67 | 62.86 |
| Albania | 3400 | 164.13 | 0 | 0 | 0 | 0 | 0 | 0 | 0 | 23.45 | 0 | 0 | 37.68 | 101.02 |
| Algeria | 30 400 | 1.8 | 0 | 0 | 0 | 0 | 0 | 0.04 | 0 | 3.5 | 0 | 0 | 14.77 | 127.85 |
| Andorra | 70 | 0 | 0 | 0 | 0 | 0 | 0 | 0 | 0 | 0 | 0 | 0 | 44.41 | 121.07 |
| Angola | 13 100 | 8.11 | 0 | 0 | 0 | 0 | 0 | 0 | 0 | 572.03 | 0 | 0 | 7.65 | 84.5 |
| Anguilla | 10 | 0 | 0 | 0 | 0 | 0 | 0 | 0 | 0 | 0 | 0 | 0 | 12 | 65 |
| Antarctica | 0 | 0 | 0 | 0 | 0 | 0 | 0 | 0 | 0 | 0 | 0 | 0 | 0 | 0 |
| Antigua Barb. | 70 | 0 | 0 | 0 | 0 | 0 | 0 | 0 | 0 | 0 | 0 | 0 | 38.69 | 77.34 |
| Argentina | 37 000 | 89.05 | 0.01 | 0 | 0 | 0.22 | 0 | 0.13 | 0 | 105.93 | 0 | 0 | 48.43 | 105.62 |
| Armenia | 3800 | 38.46 | 0 | 0 | 0 | 0 | 0 | 0 | 0 | 0 | 0 | 0 | 15.01 | 79.08 |
| Aruba | 70 | 0 | 0 | 0 | 0 | 0 | 0 | 0 | 0 | 0 | 0 | 0 | 12 | 96.85 |
| Australia | 19 160 | 100.06 | 0 | 0 | 0.15 | 6.8 | 0 | 0.47 | 0 | 349.36 | 0 | 9.57 | 50.8 | 102.95 |
| Austria | 8110 | 591.74 | 0.15 | 0.82 | 0.05 | 7.7 | 0 | 2.6 | 9.34 | 453.31 | 2.13 | 4.75 | 59.23 | 122.71 |
| Azerbaijan | 8000 | 21.59 | 0 | 0 | 0 | 0 | 0 | 0.05 | 0 | 0 | 0 | 0 | 17.53 | 101.99 |
| Azores Port. | 260 | 0 | 0 | 0 | 0 | 0 | 0 | 0 | 0 | 0 | 0 | 0 | 48.43 | 121.07 |
| Bahamas | 320 | 0 | 0 | 0 | 0 | 0 | 0 | 0 | 0 | 0 | 0 | 0 | 34.43 | 83.87 |
| Bahrain | 700 | 0 | 0 | 0 | 0 | 0 | 0 | 0 | 0 | 0 | 0 | 0 | 38.74 | 121.07 |
| Bangladesh | 131 100 | 0.81 | 0 | 0 | 0 | 0 | 0 | 0 | 0 | 77.02 | 0 | 0 | 3.24 | 98.55 |
| Barbados | 260 | 0 | 0 | 0 | 0 | 0 | 0 | 0 | 0 | 0 | 0 | 0 | 33.95 | 112.4 |
| Belarus | 10 000 | 0.2 | 0 | 0 | 0 | 0 | 0 | 0.04 | 0 | 131.54 | 0 | 0 | 38.79 | 101.74 |
| Belgium | 10 250 | 5.06 | 0.01 | 0.13 | 0 | 0.26 | 0 | 0.6 | 15.94 | 33.96 | 0 | 3.89 | 54.29 | 124.94 |
| Belize | 250 | 0 | 0 | 0 | 0 | 0 | 0 | 0 | 0 | 0 | 0 | 0 | 29.06 | 110.8 |
| Benin | 6300 | 0 | 0 | 0 | 0 | 0 | 0 | 0 | 0 | 375.39 | 0 | 0 | 4.84 | 119.03 |
| Bermuda | 70 | 0 | 0 | 0 | 0 | 0 | 0 | 0 | 0 | 0 | 0 | 0 | 37 | 110.07 |
| Bhutan | 1840 | 64 | 0 | 0 | 0 | 0 | 0 | 0 | 0 | 0 | 0 | 0 | 4.84 | 96.85 |
| Bolivia | 8300 | 27.21 | 0 | 0 | 0 | 0 | 0 | 0 | 0 | 115.26 | 0 | 0 | 17.19 | 90.27 |
| Bosnia Herzeg | 4000 | 146.15 | 0.33 | 0 | 0 | 0 | 0 | 0 | 0 | 59.79 | 0 | 0 | 17.53 | 111.33 |
| Botswana | 1480 | 0 | 0 | 0 | 0 | 0 | 0 | 0 | 0 | 0 | 0 | 0 | 18.11 | 91.09 |
| Brazil | 170 400 | 204.29 | 0 | 0 | 0 | 0 | 0 | 0.04 | 0 | 324.52 | 52 | 0 | 29.78 | 114.77 |
| Br. Virgin Isl. | 30 | 0 | 0 | 0 | 0 | 0 | 0 | 0 | 0 | 0 | 0 | 0 | 24.21 | 96.85 |
| Brunei Daruss. | 300 | 0 | 0 | 0 | 0 | 0 | 0 | 0 | 0 | 88.58 | 0 | 0 | 24.65 | 112.49 |
| Bulgaria | 8200 | 37.27 | 0 | 0 | 0 | 0 | 0 | 0 | 0 | 93.98 | 0 | 0 | 33.41 | 86 |
| Burkina Faso | 11 100 | 0.7 | 0 | 0 | 0 | 0 | 0 | 0 | 0 | 0 | 0 | 0 | 5.62 | 105.42 |
| Burundi | 6030 | 0 | 0 | 0 | 0 | 0 | 0 | 0 | 0 | 0 | 0 | 0 | 1.74 | 75.98 |
| Cambodia | 6820 | 0.03 | 0 | 0 | 0 | 0 | 0 | 0 | 0 | 0 | 0 | 0 | 8.81 | 91.43 |
| Cameroon | 14 900 | 26.75 | 0 | 0 | 0 | 0 | 0 | 0 | 0 | 444.07 | 0 | 0 | 6.44 | 102.76 |
| Canada | 30 750 | 1331.4 | 0 | 0 | 0.02 | 0 | 0.13 | 1.36 | 0 | 484.27 | 0 | 0 | 45.42 | 108.28 |
| Cape Verde | 440 | 0 | 0 | 0 | 0 | 0 | 0 | 0.1 | 0 | 0 | 0 | 0 | 22.37 | 136.37 |
| Cayman Isl. | 30 | 0 | 0 | 0 | 0 | 0 | 0 | 0 | 0 | 0 | 0 | 0 | 24.21 | 96.85 |
| Cen. African R | 2790 | 1.7 | 0 | 0 | 0 | 0 | 0 | 0 | 0 | 0 | 0 | 0 | 9.49 | 84.7 |
| Chad | 6670 | 0 | 0 | 0 | 0 | 0 | 0 | 0 | 0 | 0 | 0 | 0 | 6.92 | 92.15 |
| Chile | 15 200 | 143.35 | 0 | 0 | 0 | 0 | 0 | 0 | 0 | 369.75 | 0 | 0 | 30.22 | 109.35 |
| China | 1 262 500 | 20.13 | 0.02 | 0 | 0 | 0 | 0 | 0.08 | 0 | 225.66 | 0 | 5 | 28.23 | 118.45 |
| Colombia | 42 300 | 86.69 | 0 | 0 | 0 | 0 | 0 | 0 | 0 | 165.22 | 0 | 0 | 20.63 | 105.18 |
| Comoros | 3800 | 171.33 | 29.37 | 0 | 0 | 5.59 | 0 | 0 | 0 | 87.41 | 0 | 0 | 4.46 | 80.44 |
| Congo | 3000 | 13.29 | 0 | 0 | 0 | 0 | 0 | 0 | 0 | 261.3 | 0 | 0 | 6.39 | 101.26 |
| Cook Islands | 20 | 0 | 0 | 0 | 0 | 0 | 0 | 0 | 0 | 0 | 0 | 0 | 24.21 | 96.85 |
| Costa Rica | 2500 | 74 | 0 | 0 | 0 | 0 | 0 | 6.1 | 0 | 0 | 0 | 0 | 25.18 | 109.64 |
| Croatia | 4400 | 154 | 0.3 | 0 | 0 | 0 | 0 | 0 | 0 | 111.73 | 0 | 0 | 24.94 | 95.3 |
| Cuba | 11 200 | 1.19 | 0 | 0 | 0 | 0 | 0 | 0 | 0 | 347.58 | 0 | 0 | 17 | 107.17 |
| Cyprus | 800 | 0.17 | 0 | 0 | 0 | 59.79 | 0 | 0 | 0 | 16.61 | 0 | 0 | 46.15 | 111.62 |
| Czech R | 10 270 | 19.54 | 0 | 0 | 0 | 0 | 0 | 0.05 | 0 | 41.14 | 5.95 | 4.66 | 40.53 | 109.78 |
| Denmark | 5340 | 0.5 | 0.02 | 0 | 0.03 | 1.99 | 0 | 131.5 | 145.55 | 220.94 | 8.46 | 17.17 | 63.24 | 101.21 |
| Djibouti | 70 | 0 | 0 | 0 | 0 | 0 | 0 | 0 | 0 | 0 | 0 | 0 | 12.83 | 86.44 |
| Dominica | 80 | 21 | 0 | 0 | 0 | 0 | 0 | 0 | 0 | 0 | 0 | 0 | 33.41 | 111.53 |
| Dominican R | 8400 | 11.07 | 0 | 0 | 0 | 0 | 0 | 0 | 0 | 215.11 | 0 | 0 | 16.46 | 96.17 |
| Congo/Zaire | 50 900 | 12.27 | 0 | 0 | 0 | 0 | 0 | 0 | 0 | 355.26 | 0 | 0 | 2.28 | 71.04 |
| Ecuador | 12 600 | 68.54 | 0 | 0 | 0 | 0 | 0 | 0 | 0 | 73.81 | 0 | 0 | 20.97 | 109.44 |
| Egypt | 64 000 | 25.33 | 0 | 0 | 0 | 0 | 0 | 0.32 | 0 | 27.61 | 0 | 0 | 12.4 | 149.64 |
| El Salvador | 6300 | 21.09 | 14.34 | 0 | 0 | 0 | 0 | 0 | 0 | 291.04 | 0 | 0 | 14.67 | 106.54 |
| Equat. Guinea | 430 | 0 | 0 | 0 | 0 | 0 | 0 | 0 | 0 | 0 | 0 | 0 | 4.84 | 96.85 |
| Eritrea | 4100 | 0 | 0 | 0 | 0 | 0 | 0 | 0 | 0 | 165.27 | 0 | 0 | 4.99 | 75.64 |
| Estonia | 1400 | 0 | 0 | 0 | 0 | 0 | 0 | 0 | 0 | 474.51 | 0 | 0 | 42.52 | 120.97 |
| Ethiopia | 64 300 | 2.89 | 0.04 | 0 | 0 | 0 | 0 | 0.03 | 0 | 359.95 | 0 | 0 | 5.08 | 92.88 |
| Falkland Isl. | 0 | 0 | 0 | 0 | 0 | 0 | 0 | 0 | 0 | 0 | 0 | 0 | 24.21 | 96.85 |
| Fiji | 730 | 23 | 0 | 0 | 0 | 0 | 0 | 0 | 0 | 0 | 0 | 0 | 26.97 | 111.57 |
| Finland | 5180 | 323.44 | 0 | 0 | 0.05 | 0 | 0 | 2.3 | 11.54 | 1659.77 | 0 | 4.62 | 55.79 | 100.48 |
| France | 60 430 | 126.58 | 0.27 | 0 | 0.02 | 0.55 | 1.08 | 0.3 | 39.82 | 202.03 | 5.78 | 3.83 | 65.18 | 108.72 |
| Fr. Guiana | 130 | 0 | 0 | 0 | 0 | 0 | 0 | 0 | 0 | 0 | 0 | 0 | 24.21 | 96.85 |
| Fr. Polynesia | 210 | 0 | 0 | 0 | 0 | 0 | 0 | 0 | 0 | 0 | 0 | 0 | 40 | 98.16 |
| Gabon | 1200 | 66.43 | 0 | 0 | 0 | 0 | 0 | 0 | 0 | 1018.62 | 0 | 0 | 17.14 | 107.02 |
| Gambia | 690 | 0 | 0 | 0 | 0 | 0 | 0 | 0 | 0 | 0 | 0 | 0 | 5.67 | 114.14 |
| Georgia | 5000 | 132.86 | 0 | 0 | 0 | 0 | 0 | 0 | 0 | 18.6 | 0 | 0 | 19.23 | 97.63 |
| Germany | 82 170 | 30.22 | 0 | 0.16 | 0.14 | 1.47 | 0 | 22.3 | 28.47 | 79.49 | 2.64 | 9.01 | 50.12 | 116.95 |
| Ghana | 19 300 | 39.24 | 0 | 0 | 0 | 0 | 0 | 0 | 0 | 366.24 | 0 | 0 | 5.81 | 124.84 |
| Gibraltar | 30 | 0 | 0 | 0 | 0 | 0 | 0 | 0 | 0 | 0 | 0 | 0 | 4.84 | 121.07 |
| Greece | 10 560 | 40.01 | 0 | 0.25 | 0 | 12.46 | 0 | 7.8 | 0 | 118.77 | 0 | 0.13 | 41.02 | 138.4 |
| Greenland | 50 | 200 | 0 | 0 | 0 | 0 | 0 | 0 | 0 | 0 | 0 | 0 | 48.43 | 96.85 |
| Grenada | 90 | 0 | 0 | 0 | 0 | 0 | 0 | 0 | 0 | 0 | 0 | 0 | 32.64 | 101.21 |
| Guadeloupe | 440 | 0 | 0 | 0 | 0 | 0 | 0 | 0 | 0 | 0 | 0 | 0 | 24.21 | 96.85 |
| Guam | 120 | 0 | 0 | 0 | 0 | 0 | 0 | 0 | 0 | 0 | 0 | 0 | 14.53 | 96.85 |
| Guatemala | 11 400 | 23.31 | 0 | 0 | 0 | 0 | 0 | 0 | 0 | 454.54 | 0 | 0 | 10.07 | 95.06 |
| Guinea | 4050 | 6 | 0 | 0 | 0 | 0 | 0 | 0 | 0 | 0 | 0 | 0 | 3.87 | 110.07 |
| Guinea Bissau | 920 | 0 | 0 | 0 | 0 | 0 | 0 | 0 | 0 | 0 | 0 | 0 | 7.85 | 105.18 |
| Guyana | 870 | 0 | 0 | 0 | 0 | 0 | 0 | 0 | 0 | 0 | 0 | 0 | 20.29 | 104.75 |
| Haiti | 8000 | 3.32 | 0 | 0 | 0 | 0 | 0 | 0 | 0 | 252.44 | 0 | 0 | 6.44 | 93.12 |
| Honduras | 6400 | 39.44 | 0 | 0 | 0 | 0 | 0 | 0 | 0 | 276.11 | 0 | 0 | 16.66 | 99.32 |
| Hong Kong | 6800 | 0 | 0 | 0 | 0 | 0 | 0 | 0 | 0 | 9.77 | 0 | 0 | 38.74 | 96.85 |
| Hungary | 10 020 | 1.99 | 0 | 0.66 | 0 | 0 | 0 | 0 | 2.65 | 47.21 | 0 | 0 | 53.9 | 113.56 |
| Iceland | 280 | 2595.6 | 623.51 | 2984.7 | 0 | 0 | 0 | 0 | 4.75 | 0 | 0 | 0 | 67.65 | 94.19 |
| India | 1 015 900 | 8.37 | 0 | 0 | 0 | 0.17 | 0 | 0.4 | 0 | 263.64 | 0 | 2.3 | 9.39 | 108.18 |
| Indonesia | 210 400 | 4.93 | 1.44 | 0 | 0 | 0 | 0 | 0.02 | 0 | 299.95 | 0 | 0 | 5.67 | 134.87 |
| Iran IR | 63 700 | 6.67 | 0 | 0 | 0 | 0 | 0 | 0.06 | 0 | 16.48 | 0 | 0 | 13.03 | 128.04 |
| Iraq | 23 300 | 2.85 | 0 | 0 | 0 | 0 | 0 | 0.08 | 0 | 1.71 | 0 | 0 | 4.26 | 102.13 |
| Ireland | 3790 | 25.59 | 0 | 0 | 0 | 0 | 0 | 9.7 | 0 | 47.68 | 0 | 9.82 | 54.38 | 120.58 |
| Israel | 6200 | 0.2 | 0 | 0 | 0.007 | 127.72 | 0 | 0.08 | 0 | 0 | 0 | 0 | 31.96 | 140.53 |
| Italy | 57 730 | 87.5 | 6.7 | 0 | 0.03 | 0.25 | 0 | 2.2 | 7.69 | 36.71 | 0 | 2.97 | 45.28 | 132.01 |
| Ivory Coast | 16 000 | 12.46 | 0 | 0 | 0 | 0 | 0 | 0 | 0 | 350.43 | 0 | 0 | 4.75 | 120.68 |
| Jamaica | 2600 | 5.11 | 0 | 0 | 0 | 0 | 0 | 0 | 0 | 245.29 | 0 | 0 | 18.98 | 111.43 |
| Japan | 126 920 | 78.55 | 3.01 | 2.33 | 0.25 | 8.41 | 0 | 0.34 | 10.56 | 47.64 | 0 | 0 | 27.55 | 106.2 |
| Jordan | 4900 | 0.3 | 0 | 0 | 0 | 17.62 | 0 | 0.08 | 0 | 0 | 0 | 0 | 15.79 | 117.34 |
| Kazakhstan | 14 900 | 57.96 | 0 | 0 | 0 | 0 | 0 | 0.04 | 0 | 6.24 | 0 | 0 | 31.23 | 113.61 |
| Kenya | 30 100 | 4.86 | 1.63 | 0 | 0 | 0 | 0 | 0 | 0 | 519.98 | 0 | 0 | 11.33 | 83.78 |
| Kiribati | 60 | 0 | 0 | 0 | 0 | 0 | 0 | 0 | 0 | 0 | 0 | 0 | 18.84 | 124.36 |
| Korea | 47 280 | 9.7 | 0 | 0 | 0.008 | 1.18 | 0 | 0.06 | 41.84 | 4.83 | 0 | 1.1 | 22.47 | 127.31 |
| Korea DPR | 22 300 | 109.03 | 0 | 0 | 0 | 0 | 0 | 0 | 0 | 59.58 | 0 | 0 | 5.96 | 99.81 |
| Kuwait | 2000 | 0 | 0 | 0 | 0 | 0 | 0 | 0 | 0 | 0 | 0 | 0 | 34.53 | 117.14 |
| Kyrgyzstan | 4900 | 319.96 | 0 | 0 | 0 | 0 | 0 | 0.02 | 0 | 0 | 0 | 0 | 26.73 | 112.3 |
| Laos | 2960 | 13 | 0 | 0 | 0 | 0 | 0 | 0 | 0 | 0 | 0 | 0 | 7.7 | 102.08 |
| Latvia | 2400 | 132.86 | 0 | 0 | 0 | 0 | 0 | 0 | 0 | 548.06 | 0 | 0 | 33.32 | 104.94 |
| Lebanon | 4300 | 12.36 | 0 | 0 | 0 | 2.16 | 0 | 0 | 0 | 40.17 | 0 | 0 | 19.56 | 133.22 |
| Lesotho | 1980 | 0.4 | 0 | 0 | 0 | 0 | 0 | 0 | 0 | 0 | 0 | 0 | 4.84 | 106.54 |
| Liberia | 2510 | 7 | 0 | 0 | 0 | 0 | 0 | 0 | 0 | 0 | 0 | 0 | 3.24 | 97.29 |
| Libya ArabJam | 5300 | 0 | 0 | 0 | 0 | 0 | 0 | 0.04 | 0 | 35.1 | 0 | 0 | 17.82 | 142.23 |
| Liechtenstein | 30 | 0 | 0 | 0 | 0 | 0 | 0 | 0 | 0 | 0 | 0 | 0 | 48.43 | 106.59 |
| Lithuania | 3700 | 10.77 | 0 | 0 | 0 | 3.59 | 0 | 0 | 0 | 226.23 | 0 | 0 | 34.09 | 113.12 |
| Luxembourg | 440 | 30.2 | 0 | 0 | 0 | 0 | 0 | 4.09 | 81.53 | 48.31 | 0 | 3.02 | 54.29 | 124.94 |
| Macedonia FY | 2000 | 66.43 | 1.99 | 0 | 0 | 0 | 0 | 0 | 0 | 139.51 | 0 | 0 | 24.21 | 121.31 |
| Madagascar | 8460 | 5 | 0 | 0 | 0 | 0 | 0 | 0 | 0 | 0 | 0 | 0 | 9.59 | 87.65 |
| Malawi | 9860 | 0 | 0 | 0 | 0 | 0 | 0 | 0 | 0 | 0 | 0 | 0 | 2.37 | 103.2 |
| Malaysia | 23 300 | 34.21 | 0 | 0 | 0 | 0 | 0 | 0 | 0 | 144.27 | 0 | 0 | 27.41 | 113.95 |
| Maldives | 270 | 0 | 0 | 0 | 0 | 0 | 0 | 0 | 0 | 0 | 0 | 0 | 31.82 | 93.7 |
| Mali | 8070 | 1.1 | 0 | 0 | 0 | 0 | 0 | 0 | 0 | 0 | 0 | 0 | 4.84 | 106.25 |
| Malta | 400 | 0 | 0 | 0 | 0 | 0 | 0 | 0 | 0 | 0 | 0 | 0 | 44.21 | 127.36 |
| Marshall Isl. | 50 | 0 | 0 | 0 | 0 | 0 | 0 | 0 | 0 | 0 | 0 | 0 | 24.21 | 96.85 |
| Martinique | 450 | 0 | 0 | 0 | 0 | 0 | 0 | 0 | 0 | 0 | 0 | 0 | 24.21 | 96.85 |
| Mauritania | 2250 | 5 | 0 | 0 | 0 | 0 | 0 | 0 | 0 | 0 | 0 | 0 | 15.84 | 107.02 |
| Mauritius | 1220 | 11 | 0 | 0 | 0 | 0 | 0 | 0 | 0 | 0 | 0 | 0 | 20.68 | 123.87 |
| Mexico | 97 220 | 38.94 | 6.94 | 0 | 0.014 | 0.59 | 0 | 0.02 | 0 | 109.81 | 0 | 0.08 | 28.23 | 125.04 |
| Micronesia | 0 | 0 | 0 | 0 | 0 | 0 | 0 | 0 | 0 | 0 | 0 | 0 | 24.21 | 96.85 |
| Moldova Rep | 4300 | 3.09 | 0 | 0 | 0 | 0 | 0 | 0 | 0 | 18.54 | 0 | 0 | 18.98 | 114.87 |
| Monaco | 30 | 0 | 0 | 0 | 0 | 0 | 0 | 0 | 0 | 0 | 0 | 0 | 45.28 | 108.72 |
| Mongolia | 2310 | 0.08 | 0 | 0 | 0 | 0 | 0 | 0 | 0 | 0 | 0 | 0 | 45.67 | 50.27 |
| Morocco | 28 700 | 2.78 | 0 | 0 | 0 | 0.28 | 0 | 0.56 | 0 | 20.37 | 0 | 0 | 10.36 | 133.17 |
| Mozambique | 17 700 | 45.04 | 0 | 0 | 0 | 0 | 0 | 0 | 0 | 496.18 | 0 | 0 | 2.32 | 90.99 |
| Myanmar | 47 700 | 4.46 | 0 | 0 | 0 | 0 | 0 | 0 | 0 | 255.7 | 0 | 0.03 | 6 | 131.62 |
| Namibia | 1800 | 88.58 | 0 | 0 | 0 | 0 | 0 | 0 | 0 | 125.48 | 0 | 0 | 12.88 | 115.4 |
| Nauru | 10 | 0 | 0 | 0 | 0 | 0 | 0 | 0 | 0 | 0 | 0 | 0 | 19.37 | 96.85 |
| Nepal | 23 000 | 8.09 | 0 | 0 | 0 | 0 | 0 | 0 | 0 | 388.77 | 0 | 3.7 | 7.75 | 110.22 |
| Netherlands | 15 920 | 1 | 0 | 0 | 0.08 | 1.34 | 0 | 8.9 | 41.81 | 28.38 | 0 | 11.02 | 57.38 | 102.18 |
| New Caledonia | 170 | 94 | 0 | 0 | 0 | 0 | 0 | 0 | 0 | 0 | 0 | 0 | 31.72 | 101.02 |
| New Zealand | 3830 | 734.39 | 82.56 | 164.43 | 0 | 0 | 0 | 2.74 | 0 | 286.89 | 0 | 10.41 | 52.59 | 104.89 |
| Nicaragua | 5100 | 5.21 | 3.13 | 0 | 0 | 0 | 0 | 0 | 0 | 369.94 | 0 | 0 | 8.77 | 99.08 |
| Niger | 8650 | 0 | 0 | 0 | 0 | 0 | 0 | 0 | 0 | 0 | 0 | 0 | 5.42 | 95.74 |
| Nigeria | 126 900 | 5.23 | 0 | 0 | 0 | 0 | 0 | 0 | 0 | 757.29 | 0 | 0 | 4.21 | 133.8 |
| Niue | 0 | 0 | 0 | 0 | 0 | 0 | 0 | 0 | 0 | 0 | 0 | 0 | 14.53 | 96.85 |
| N Mariana Isl. | 30 | 0 | 0 | 0 | 0 | 0 | 0 | 0 | 0 | 0 | 0 | 0 | 14.53 | 96.85 |
| Norway | 4490 | 3603.3 | 0 | 0 | 0.13 | 0 | 0 | 0.87 | 36.69 | 354.8 | 0 | 1.48 | 56.13 | 109.15 |
| Oman | 2400 | 0 | 0 | 0 | 0 | 0 | 0 | 0 | 0 | 0 | 0 | 0 | 33.9 | 96.85 |
| Pakistan | 138 100 | 14.24 | 0 | 0 | 0 | 0 | 0 | 0 | 0 | 231.09 | 0 | 0.01 | 20.77 | 97.97 |
| Palau Islands | 20 | 0 | 0 | 0 | 0 | 0 | 0 | 0 | 0 | 0 | 0 | 0 | 19.37 | 96.85 |
| Panama | 2900 | 123.7 | 0 | 0 | 0 | 0 | 0 | 0 | 0 | 210.75 | 0 | 0 | 28.09 | 92.4 |
| Papua N Guin. | 4420 | 8 | 0 | 0 | 0 | 0 | 0 | 0 | 0 | 0 | 0 | 0 | 10.12 | 95.25 |
| Paraguay | 5500 | 1111.2 | 0 | 0 | 0 | 0 | 0 | 0 | 0 | 553.2 | 0 | 0 | 28.09 | 94.58 |
| Peru | 25 700 | 71.86 | 0 | 0 | 0 | 2.74 | 0 | 0 | 0 | 115.29 | 0 | 0 | 16.8 | 110.31 |
| Philippines | 75 600 | 11.78 | 17.57 | 0 | 0 | 0 | 0 | 0.02 | 0 | 167.66 | 0 | 0.01 | 17.14 | 98.06 |
| Poland | 38 650 | 6.22 | 0 | 0 | 0 | 0 | 0 | 0.1 | 0 | 123.31 | 0.7 | 1.03 | 43.1 | 120.39 |
| Portugal | 10 010 | 129.28 | 0.92 | 0.13 | 0.009 | 2.39 | 0 | 3.3 | 23.1 | 249.14 | 0 | 0.13 | 51.19 | 128.72 |
| Puerto Rico | 4940 | 4.6 | 0 | 0 | 0 | 0 | 0 | 0 | 0 | 0 | 0 | 0 | 48.43 | 121.07 |
| Qatar | 600 | 0 | 0 | 0 | 0 | 0 | 0 | 0 | 0 | 0 | 0 | 0 | 38.74 | 96.85 |
| Reunion | 650 | 38 | 0 | 0 | 0 | 0 | 0 | 0 | 0 | 0 | 0 | 0 | 29.06 | 96.85 |
| Romania | 22 400 | 75.33 | 0.12 | 0 | 0 | 0 | 0 | 0 | 0 | 169.05 | 0 | 0 | 32.74 | 125.81 |
| Russia Fed | 185 500 | 108 | 0.04 | 0 | 0 | 0 | 0 | 0.02 | 0 | 0 | 0 | 0 | 31.38 | 109.88 |
| Rwanda | 145 600 | 128.76 | 0.05 | 0 | 0 | 0 | 0 | 0 | 0 | 63.97 | 0 | 0 | 2.47 | 98.11 |
| Saint Lucia | 150 | 0 | 0 | 0 | 0 | 0 | 0 | 0 | 0 | 0 | 0 | 0 | 32.11 | 105.33 |
| San Marino | 30 | 0 | 0 | 0 | 0 | 0 | 0 | 0 | 0 | 0 | 0 | 0 | 45.04 | 132.01 |
| S Tome&Princ. | 150 | 0 | 0 | 0 | 0 | 0 | 0 | 0 | 0 | 0 | 0 | 0 | 4.41 | 111.33 |
| Saudi Arabia | 20 700 | 0 | 0 | 0 | 0 | 0 | 0 | 0.04 | 0 | 0 | 0 | 0 | 21.6 | 117.63 |
| Senegal | 9500 | 0 | 0 | 0 | 0 | 0 | 0 | 0 | 0 | 240.55 | 0 | 0 | 9.64 | 99.66 |
| Seychelles | 80 | 0 | 0 | 0 | 0 | 0 | 0 | 0 | 0 | 0 | 0 | 0 | 23.97 | 93.8 |
| Sierra Leone | 3480 | 0.2 | 0 | 0 | 0 | 0 | 0 | 0 | 0 | 0 | 0 | 0 | 3.15 | 87.12 |
| Singapore | 4000 | 0 | 0 | 0 | 0 | 21.26 | 0 | 0 | 0 | 0 | 0 | 0 | 29.06 | 96.85 |
| Slovak R | 5400 | 99.89 | 0 | 0 | 0 | 0 | 0 | 0.04 | 0 | 19.68 | 0 | 0 | 38.16 | 113.56 |
| Slovenia | 2000 | 219.23 | 0.66 | 0 | 0 | 0 | 0 | 0 | 0 | 305.59 | 0 | 0 | 45.08 | 108.33 |
| Solomon IsL. | 350 | 0 | 0 | 0 | 0 | 0 | 0 | 0 | 0 | 0 | 0 | 0 | 10.27 | 100 |
| Somalia | 10 510 | 0 | 0 | 0 | 0 | 0 | 0 | 0 | 0 | 0 | 0 | 0 | 29.88 | 48.96 |
| South Africa | 42 800 | 3.73 | 0 | 0 | 0 | 0 | 0 | 0 | 0 | 393.32 | 0 | 0 | 17.92 | 121.84 |
| Spain | 39 930 | 81.19 | 0 | 0.2 | 0.02 | 1.03 | 0 | 21.3 | 7.75 | 130.47 | 0 | 3.79 | 44.41 | 117.92 |
| Sri Lanka | 19 400 | 18.49 | 0 | 0 | 0 | 0 | 0 | 0 | 0 | 291.75 | 0 | 0.1 | 7.51 | 108.91 |
| St Kitts&Nevis | 50 | 0 | 0 | 0 | 0 | 0 | 0 | 0 | 0 | 0 | 0 | 0 | 36.17 | 93.85 |
| St Vincent&Gr. | 120 | 0 | 0 | 0 | 0 | 0 | 0 | 0 | 0 | 0 | 0 | 0 | 22.23 | 102.66 |
| Sudan | 31 100 | 4.27 | 0 | 0 | 0 | 0 | 0 | 0 | 0 | 602.37 | 0 | 0 | 22.08 | 91.62 |
| Suriname | 420 | 166 | 0 | 0 | 0 | 0 | 0 | 0 | 0 | 0 | 0 | 0 | 17.68 | 110.75 |
| Swaziland | 700 | 12 | 0 | 0 | 0 | 0 | 0 | 0 | 0 | 0 | 0 | 0 | 18.89 | 107.99 |
| Sweden | 8870 | 1017.1 | 0 | 0 | 0.03 | 0.75 | 0 | 8.97 | 60.22 | 1155.48 | 0 | 4.19 | 49.83 | 100.78 |
| Switzerland | 7190 | 585.42 | 0 | 16.82 | 0.21 | 4.25 | 0 | 0.12 | 140.26 | 92.76 | 0 | 11.64 | 52.88 | 106.59 |
| Syria Arab Rep | 16 200 | 65.61 | 0 | 0 | 0 | 0 | 0 | 0.08 | 0 | 0 | 0 | 0 | 19.85 | 127.26 |
| Taiwan Teipei | 22 200 | 45.49 | 0 | 0 | 0 | 0 | 0 | 0.02 | 0 | 0.6 | 0 | 0 | 29.06 | 96.85 |
| Tajikistan | 6200 | 255.01 | 0 | 0 | 0 | 0 | 0 | 0 | 0 | 0 | 0 | 0 | 7.17 | 76.13 |
| Tanzania UR | 33 700 | 7.49 | 0 | 0 | 0 | 0 | 0 | 0 | 0 | 567.73 | 0 | 0 | 5.91 | 86.39 |
| Thailand | 60 700 | 11.38 | 0 | 0 | 0 | 0 | 0 | 0.04 | 0 | 312.13 | 0 | 0.15 | 13.75 | 107.6 |
| Togo | 4500 | 7 | 0 | 0 | 0 | 0 | 0 | 0 | 0 | 307.06 | 0 | 0 | 3.87 | 108.91 |
| Tonga | 100 | 0 | 0 | 0 | 0 | 0 | 0 | 0 | 0 | 0 | 0 | 0 | 29.06 | 96.85 |
| Trinidad&Tob. | 1300 | 0 | 0 | 0 | 0 | 0 | 0 | 0 | 0 | 30.66 | 0 | 0 | 21.16 | 113.32 |
| Tunisia | 9600 | 1.38 | 0 | 0 | 0 | 0.28 | 0 | 0.34 | 0 | 171.62 | 0 | 0 | 16.8 | 142.95 |
| Turkey | 66 840 | 52.8 | 0.13 | 3.56 | 0 | 5.21 | 0 | 0.09 | 0 | 128.31 | 0 | 0.1 | 18.21 | 147.22 |
| Turkmenistan | 5200 | 0.4 | 0 | 0 | 0 | 0 | 0 | 0 | 0 | 0 | 0 | 0 | 21.94 | 107.6 |
| Turks&Caicos I | 10 | 0 | 0 | 0 | 0 | 0 | 0 | 0 | 0 | 0 | 0 | 0 | 29.06 | 96.85 |
| Tuvalu | 10 | 0 | 0 | 0 | 0 | 0 | 0 | 0 | 0 | 0 | 0 | 0 | 29.06 | 96.85 |
| Uganda | 16 670 | 0 | 0 | 0 | 0 | 0 | 0 | 0 | 0 | 0 | 0 | 0 | 6.83 | 107.41 |
| Ukraine | 48 500 | 26.85 | 0 | 0 | 0 | 0.03 | 0 | 0.04 | 0 | 7.12 | 0 | 0 | 28.33 | 110.7 |
| United Arab Emir. | 2900 | 0 | 0 | 0 | 0 | 0 | 0 | 0 | 0 | 0 | 0 | 0 | 38.16 | 116.47 |
| United. Kingdom | 59 760 | 9.76 | 0 | 0.02 | 0.003 | 0.24 | 0 | 2.13 | 6.23 | 18.65 | 0 | 17.88 | 48.52 | 112.93 |
| United States | 275 420 | 103.04 | 6.09 | 2.5 | 0.05 | 7.32 | 0 | 2.84 | 34.29 | 290.69 | 15.55 | 15.91 | 50.51 | 132.16 |
| Uruguay | 3300 | 245.6 | 0 | 0 | 0 | 0 | 0 | 0 | 0 | 169.1 | 0 | 0 | 46.88 | 92.49 |
| US Virgin Isl. | 100 | 0 | 0 | 0 | 0 | 0 | 0 | 0 | 0 | 0 | 0 | 0 | 43.58 | 121.07 |
| Uzbekistan | 24 800 | 27.32 | 0 | 0 | 0 | 0 | 0 | 0 | 0 | 0 | 0 | 0 | 20.97 | 93.85 |
| Vanuatu | 150 | 0 | 0 | 0 | 0 | 0 | 0 | 0 | 0 | 0 | 0 | 0 | 23.15 | 102.13 |
| Vatican City | 0 | 0 | 0 | 0 | 0 | 0 | 0 | 0 | 0 | 0 | 0 | 0 | 45.04 | 132.01 |
| Venezuela | 24 200 | 296.47 | 0 | 0 | 0 | 0 | 0 | 0 | 0 | 29.65 | 0 | 0 | 17.19 | 92.06 |
| Vietnam | 78 500 | 21.16 | 0 | 0 | 0 | 0 | 0 | 0.02 | 0 | 383.02 | 0 | 0.02 | 13.17 | 111.91 |
| W Sahara | 90 | 0 | 0 | 0 | 0 | 0 | 0 | 0 | 0 | 0 | 0 | 0 | 15.84 | 96.85 |
| W Samoa | 190 | 0 | 0 | 0 | 0 | 0 | 0 | 0 | 0 | 0 | 0 | 0 | 29.06 | 96.85 |
| Yemen | 17 500 | 0 | 0 | 0 | 0 | 0 | 0 | 0 | 0 | 6.07 | 0 | 0 | 6.59 | 92.11 |
| Serbia Monten | 10 600 | 130.36 | 0 | 0 | 0 | 0 | 0 | 0 | 0 | 31.34 | 0 | 0 | 48.23 | 76.22 |
| Zambia | 10 100 | 88.14 | 0 | 0 | 0 | 0 | 0 | 0 | 0 | 674.84 | 0 | 0 | 4.5 | 88.09 |
| Zimbabwe | 12 600 | 29.53 | 0 | 0 | 0 | 0 | 0 | 0 | 0 | 589.45 | 0 | 0 | 6.83 | 95.64 |
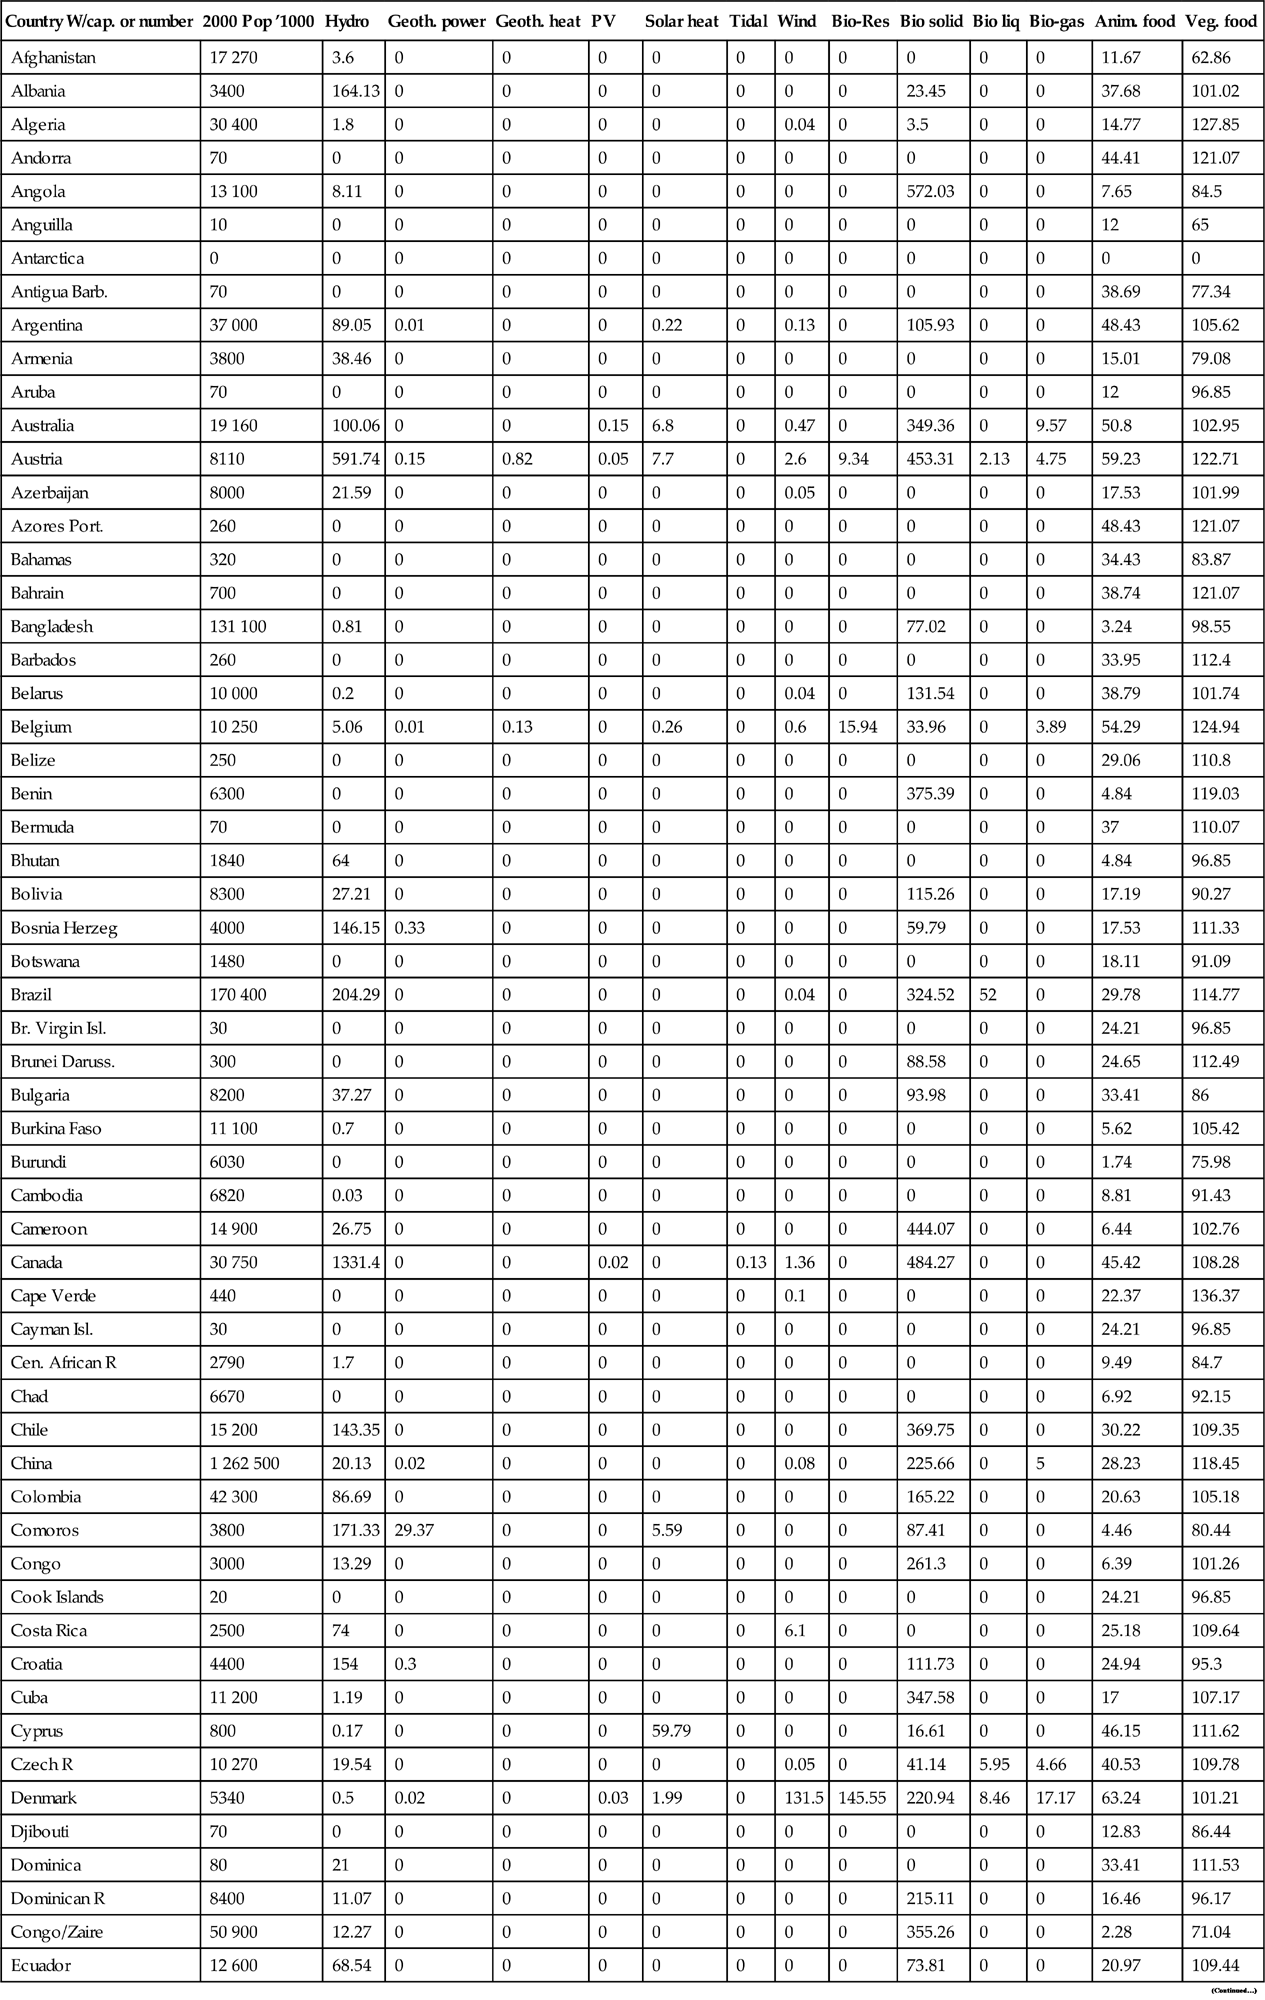
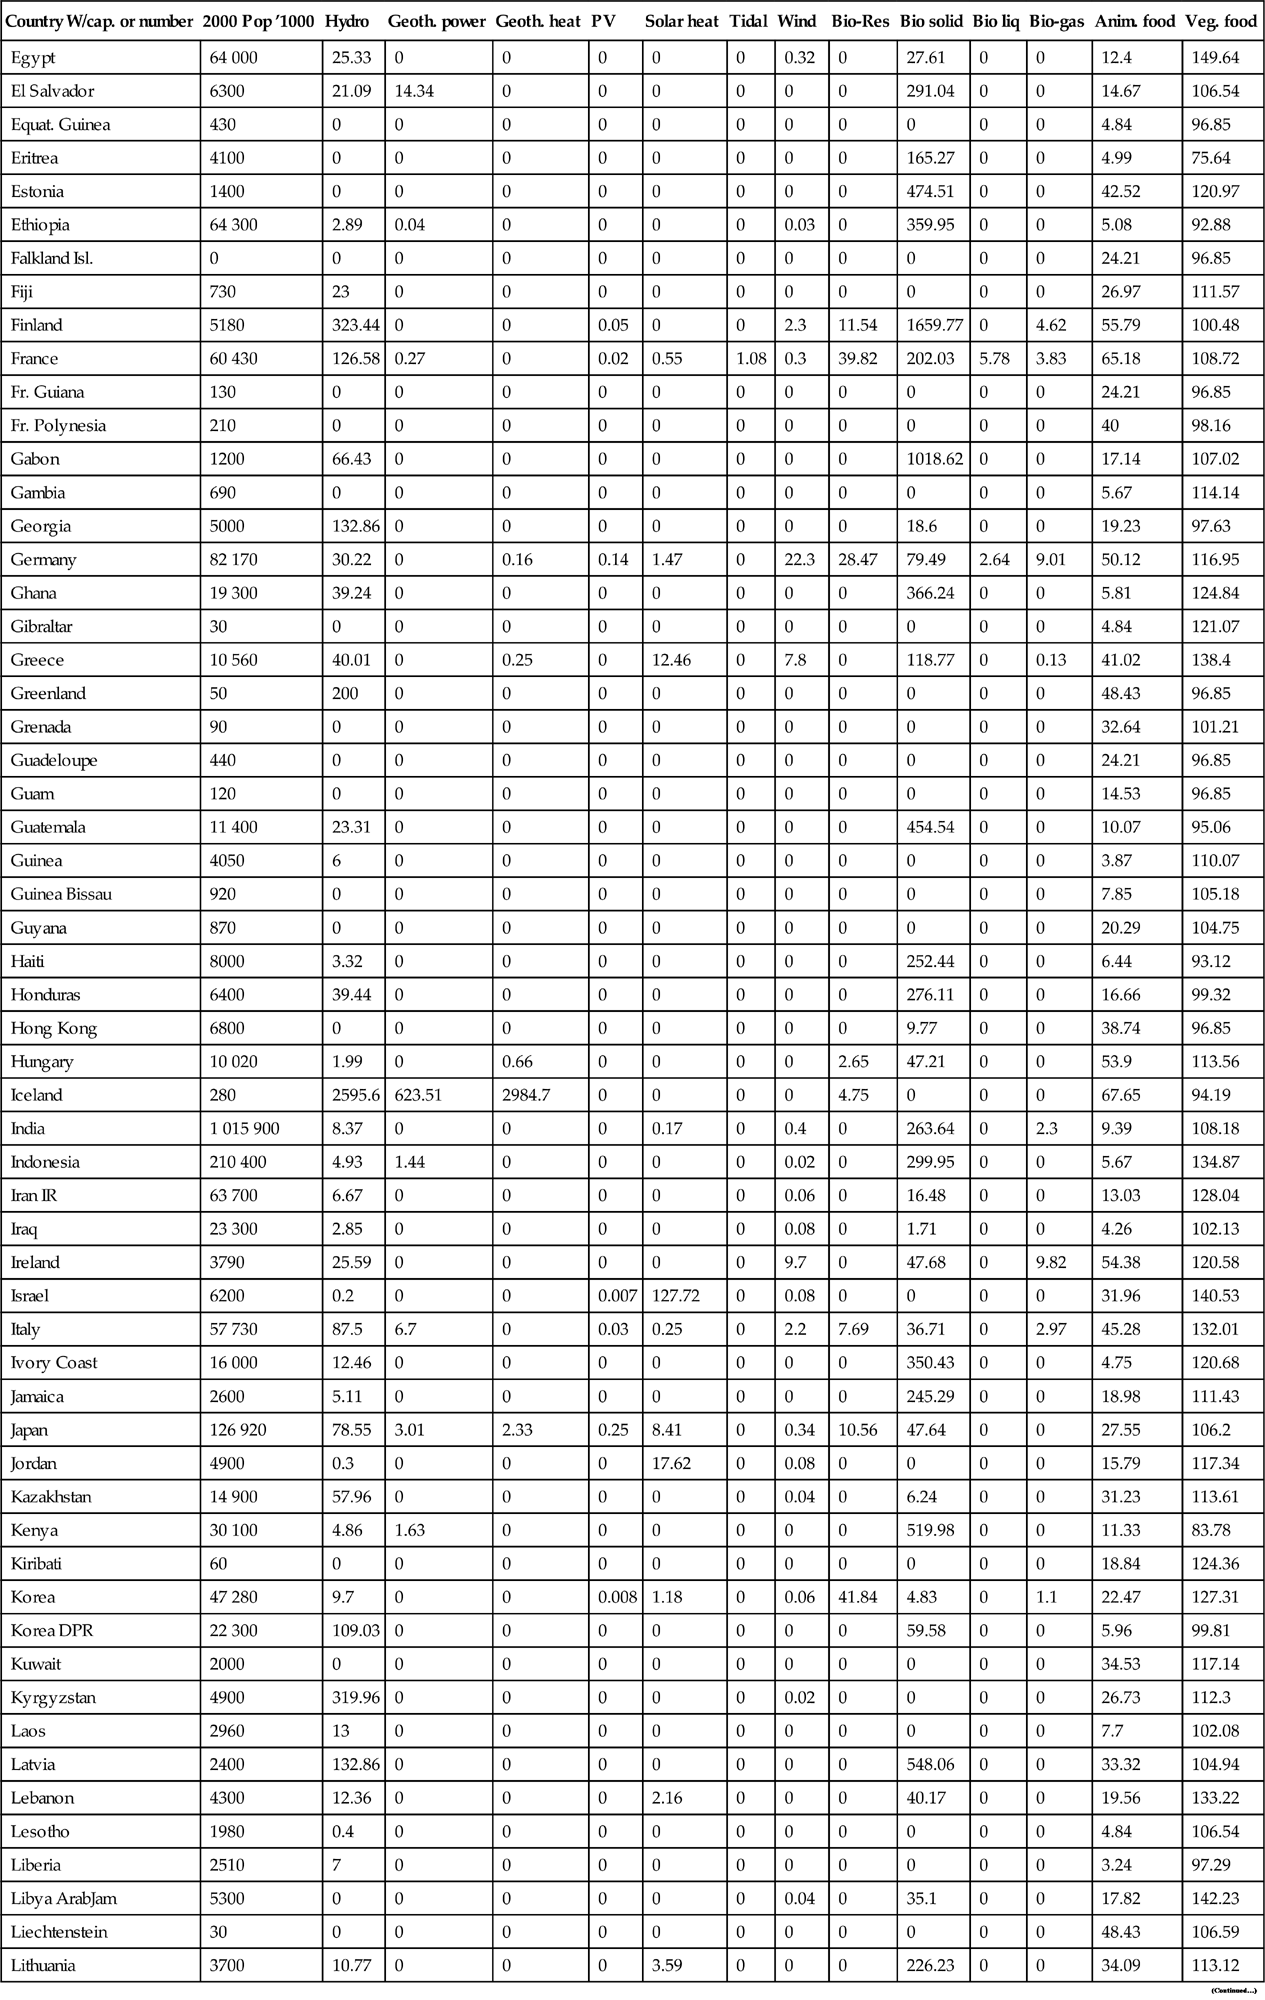
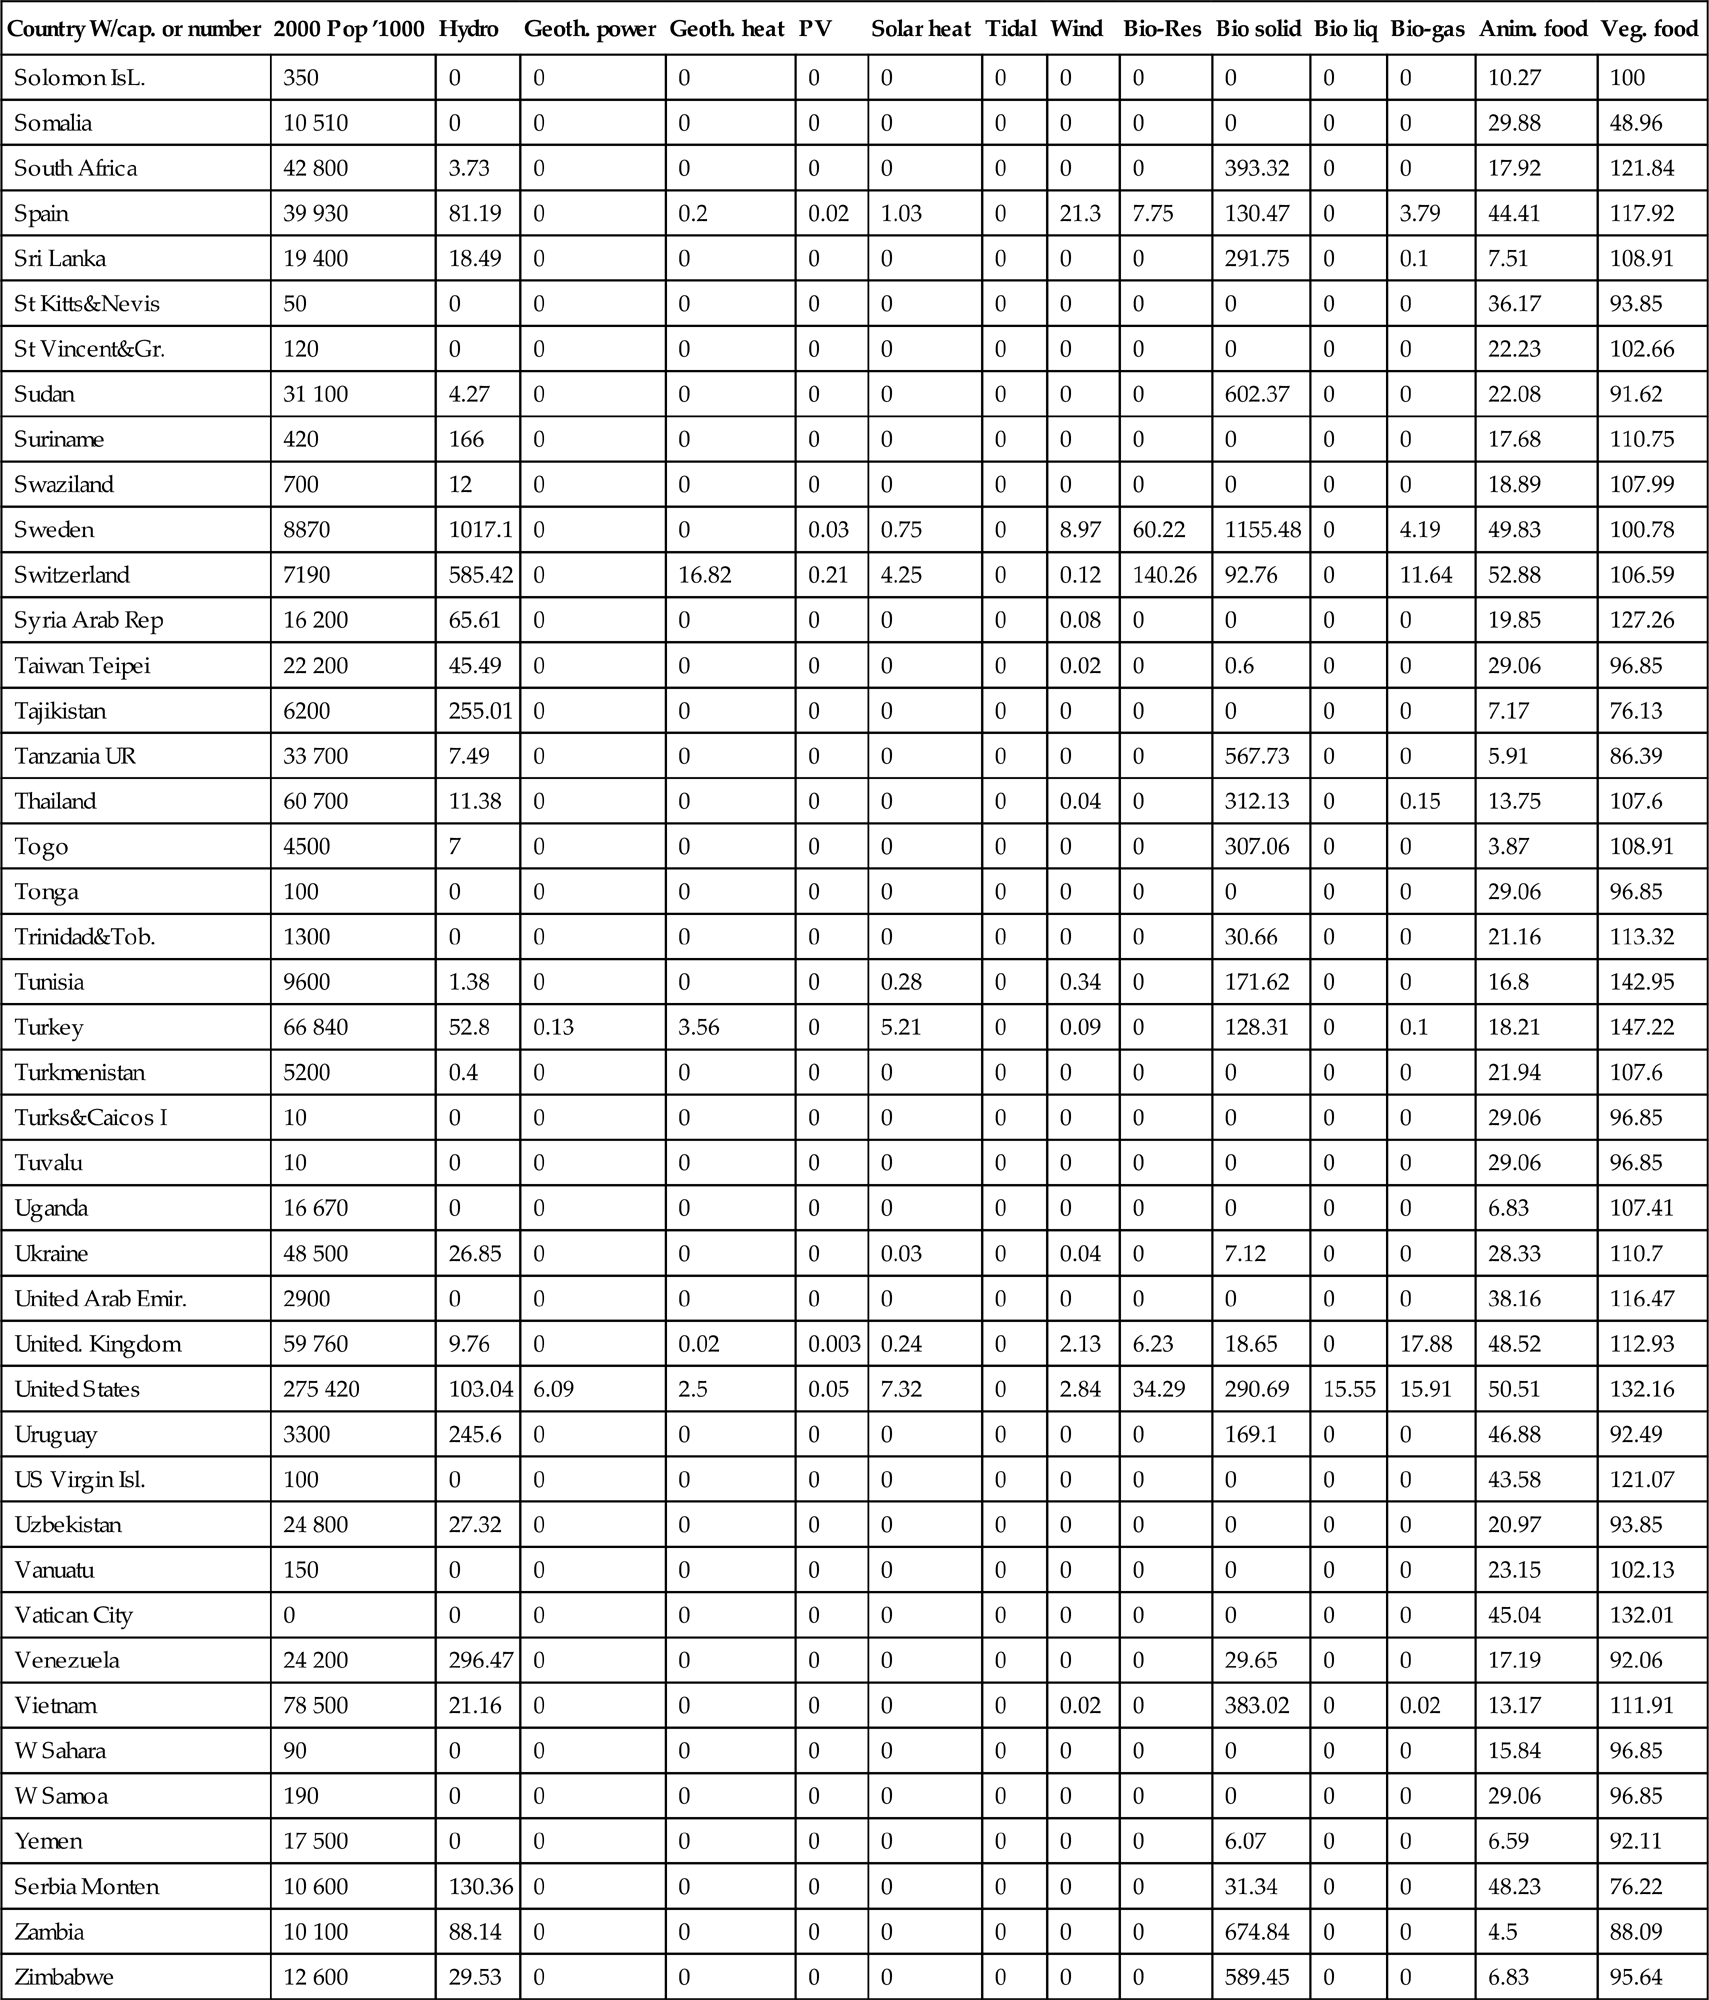
Table 1.2
Year 2013 average renewable energy use (number or W/cap.; FAO, 2016, OECD, 2015; cf. Figs. 1.2, 1.4–1.15)
| Country/W/cap. or number/2013 | Pop ′000 | Hydro | Geoth. | Solar PV | Solar Th. | Tidal, etc. | Wind | Bio Res. | Bio solid | Bio liq. | Bio gas | Anim food | Veget food |
| Afghanistan | 30 683 | 0 | 0 | 0 | 0 | 0 | 0 | 0 | 0 | 0 | 0 | 10.41 | 91.57 |
| Albania | 2883 | 275.49 | 0 | 0 | 5.47 | 0 | 0 | 0 | 92.73 | 0 | 0 | 42.61 | 103.78 |
| Algeria | 38 186 | 0.99 | 0 | 0 | 0 | 0 | 0 | 0 | 0.76 | 0 | 0 | 18.74 | 137.09 |
| Andorra | 76 | 0 | 0 | 0 | 0 | 0 | 0 | 0 | 0 | 0 | 0 | 44.41 | 121.07 |
| Angola | 23 448 | 20.69 | 0 | 0 | 0 | 0 | 0 | 0 | 489.36 | 0 | 0 | 11.77 | 104.84 |
| Anguilla | 14 | 0 | 0 | 0 | 0 | 0 | 0 | 0 | 0 | 0 | 0 | 12.00 | 65.00 |
| Antigua & Barbuda | 90 | 0 | 0 | 0 | 0 | 0 | 0 | 0 | 0 | 0 | 0 | 39.71 | 76.37 |
| Argentina | 42 538 | 83.35 | 0 | 0.04 | 0 | 0 | 1.27 | 0 | 70.56 | 67.10 | 0 | 45.76 | 107.02 |
| Armenia | 2992 | 82.89 | 0 | 0 | 0 | 0 | 0.15 | 0 | 3.77 | 0 | 0 | 33.51 | 102.52 |
| Australia | 23 270 | 89.13 | 0.02 | 18.70 | 17.53 | 0 | 35.94 | 0 | 251.21 | 12.34 | 19.26 | 51.23 | 106.88 |
| Austria | 8487 | 564.55 | 5.70 | 7.83 | 27.81 | 0 | 42.38 | 23.11 | 742.53 | 35.69 | 30.54 | 56.61 | 126.63 |
| Azerbaijan | 9498 | 17.89 | 0 | 0.01 | 0 | 0 | 0.01 | 3.51 | 14.23 | 0 | 0 | 24.46 | 118.45 |
| Bahamas | 378 | 0 | 0 | 0 | 0 | 0 | 0 | 0 | 0 | 0 | 0 | 38.79 | 85.91 |
| Bahrain | 1349 | 0 | 0 | 0 | 0 | 0 | 0 | 0 | 0 | 0 | 0 | 38.74 | 121.07 |
| Bangladesh | 157 157 | 0.65 | 0 | 0.11 | 0 | 0 | 0 | 0 | 76.00 | 0 | 0 | 5.04 | 112.64 |
| Barbados | 283 | 0 | 0 | 0 | 0 | 0 | 0 | 0 | 0 | 0 | 0 | 34.53 | 113.03 |
| Belarus | 9497 | 1.66 | 0 | 0 | 0 | 0 | 0.10 | 0 | 210.30 | 3.19 | 1.27 | 39.90 | 117.63 |
| Belgium | 11 153 | 3.89 | 0.40 | 27.02 | 2.24 | 0 | 37.20 | 35.07 | 167.56 | 52.73 | 22.49 | 56.76 | 126.88 |
| Belize | 344 | 0 | 0 | 0 | 0 | 0 | 0 | 0 | 0 | 0 | 0 | 25.23 | 108.47 |
| Benin | 10 322 | 0 | 0 | 0 | 0 | 0 | 0 | 0 | 286.79 | 0 | 0 | 5.42 | 120.14 |
| Bermuda | 63 | 0 | 0 | 0 | 0 | 0 | 0 | 0 | 0 | 0 | 0 | 41.89 | 92.01 |
| Bhutan | 755 | 0 | 0 | 0 | 0 | 0 | 0 | 0 | 0 | 0 | 0 | 4.84 | 96.85 |
| Bolivia | 10 400 | 27.82 | 0 | 0.03 | 0 | 0 | 0 | 0 | 127.52 | 0 | 0 | 21.79 | 87.36 |
| Bosnia Herzegovina | 3824 | 216.01 | 0 | 0 | 0 | 0 | 0 | 0 | 62.23 | 0 | 0 | 25.81 | 125.76 |
| Botswana | 2177 | 0 | 0 | 0.05 | 0 | 0 | 0 | 0 | 299.33 | 0 | 0 | 16.13 | 94.53 |
| Brazil | 204 259 | 218.49 | 0 | 0 | 3.58 | 0 | 3.67 | 0 | 436.53 | 101.72 | 0.63 | 38.89 | 120.29 |
| Brunei Darussalam | 412 | 0 | 0 | 0.55 | 0 | 0 | 0 | 0 | 0 | 0 | 0 | 29.10 | 113.66 |
| Bulgaria | 7253 | 64.21 | 6.12 | 21.42 | 3.49 | 0 | 21.62 | 2.81 | 205.35 | 8.32 | 0.41 | 31.19 | 108.14 |
| Burkina Faso | 17 085 | 0 | 0 | 0 | 0 | 0 | 0 | 0 | 0 | 0 | 0 | 8.28 | 120.77 |
| Burundi | 10 466 | 0 | 0 | 0 | 0 | 0 | 0 | 0 | 0 | 0 | 0 | 1.74 | 75.98 |
| Cabo Verde | 507 | 0 | 0 | 0 | 0 | 0 | 0 | 0 | 0 | 0 | 0 | 31.28 | 100.24 |
| Cambodia | 15 079 | 7.69 | 0 | 0.02 | 0 | 0 | 0 | 0 | 352.01 | 0 | 0 | 10.46 | 106.29 |
| Cameroon | 22 211 | 24.95 | 0 | 0 | 0 | 0 | 0 | 0 | 285.46 | 0 | 0 | 7.22 | 118.06 |
| Canada | 35 231 | 1269.20 | 0 | 1.18 | 1.40 | 0.05 | 37.56 | 3.20 | 431.96 | 36.10 | 8.93 | 44.21 | 121.40 |
| Central African Rep. | 4711 | 0 | 0 | 0 | 0 | 0 | 0 | 0 | 0 | 0 | 0 | 12.98 | 91.33 |
| Chad | 13 146 | 0 | 0 | 0 | 0 | 0 | 0 | 0 | 0 | 0 | 0 | 6.00 | 93.85 |
| Chile | 17 576 | 128.18 | 0 | 0.05 | 1.42 | 0 | 3.60 | 0 | 772.76 | 0 | 1.01 | 35.54 | 109.25 |
| China PR | 1 362 514 | 76.17 | 4.39 | 1.29 | 18.25 | 0 | 11.67 | 0 | 195.72 | 1.65 | 7.66 | 33.41 | 115.79 |
| Colombia | 47342 | 106.83 | 0 | 0 | 0 | 0 | 0.13 | 0 | 110.15 | 0.86 | 0 | 23.63 | 106.97 |
| Comoros | 752 | 0 | 0 | 0 | 0 | 0 | 0 | 0 | 0 | 0 | 0 | 4.46 | 80.44 |
| Congo | 4394 | 26.52 | 0 | 0 | 0 | 0 | 0 | 0 | 436.96 | 0 | 0 | 10.75 | 95.54 |
| Congo DR | 72 553 | 13.52 | 0 | 0 | 0 | 0 | 0 | 0 | 357.63 | 0 | 0 | 6.39 | 101.26 |
| Costa Rica | 4706 | 166.15 | 327.64 | 0.07 | 0 | 0 | 11.76 | 0 | 190.17 | 0 | 0.03 | 28.28 | 112.06 |
| Côte d'Ivoire | 21 622 | 9.12 | 0 | 0 | 0 | 0 | 0 | 0 | 591.66 | 0 | 0 | 5.62 | 129.20 |
| Croatia | 4272 | 213.80 | 2.12 | 0.29 | 2.53 | 0 | 13.81 | 0 | 218.82 | 9.01 | 5.14 | 39.18 | 108.62 |
| Cuba | 11 363 | 1.28 | 0 | 0.09 | 0 | 0 | 0.17 | 0 | 144.23 | 27.52 | 0 | 23.15 | 135.54 |
| Cyprus | 1142 | 0 | 1.72 | 4.70 | 76.37 | 0 | 23.10 | 0 | 5.80 | 2.04 | 12.94 | 34.09 | 94.82 |
| Czech Republic | 10 545 | 29.59 | 0 | 22.00 | 1.80 | 0 | 5.21 | 10.44 | 288.49 | 28.68 | 71.86 | 41.50 | 117.92 |
| Denmark | 5624 | 0.26 | 1.29 | 10.51 | 5.78 | 0 | 225.73 | 116.55 | 354.68 | 23.37 | 26.16 | 59.47 | 103.44 |
| Djibouti | 2000 | 0 | 0 | 0 | 0 | 0 | 0 | 0 | 0 | 0 | 0 | 9.10 | 113.17 |
| Dominica | 72 | 0 | 0 | 0 | 0 | 0 | 0 | 0 | 0 | 0 | 0 | 33.70 | 113.85 |
| Dominican Republic | 10 281 | 25.98 | 0 | 1.67 | 0 | 0 | 0 | 0 | 104.46 | 0 | 0 | 18.50 | 105.62 |
| Ecuador | 15 661 | 80.45 | 0.21 | 0.01 | 0 | 0 | 0.42 | 0 | 46.98 | 0.38 | 0 | 35.50 | 84.45 |
| Egypt | 87 614 | 16.86 | 0 | 0.32 | 0 | 0 | 1.68 | 0 | 24.91 | 0 | 0 | 16.27 | 155.93 |
| El Salvador | 6090 | 33.55 | 292.29 | 0 | 0 | 0 | 0 | 0 | 169.85 | 0 | 0 | 17.53 | 104.16 |
| Eritrea | 4999 | 0 | 0 | 0.05 | 0 | 0 | 0 | 0 | 170.11 | 0 | 0 | 4.99 | 75.64 |
| Estonia | 1320 | 2.25 | 0 | 0 | 0 | 0 | 45.74 | 0 | 1072.89 | 0 | 7.25 | 39.03 | 116.61 |
| Ethiopia | 94 558 | 10.06 | 0.21 | 0 | 0 | 0 | 0.43 | 0 | 625.31 | 0.05 | 0 | 6.10 | 95.74 |
| Fiji | 880 | 0 | 0 | 0 | 0 | 0 | 0 | 0 | 0 | 0 | 0 | 26.25 | 115.64 |
| Finland | 5453 | 268.72 | 0 | 0.13 | 0.30 | 0 | 16.20 | 54.02 | 1975.28 | 86.69 | 14.11 | 62.03 | 97.05 |
| France | 63 845 | 126.02 | 4.68 | 8.33 | 1.80 | 0.74 | 28.66 | 24.38 | 225.35 | 50.57 | 9.08 | 57.14 | 113.46 |
| French Polynesia | 277 | 0 | 0 | 0 | 0 | 0 | 0 | 0 | 0 | 0 | 0 | 43.24 | 97.29 |
| Gabon | 1650 | 62.25 | 0 | 0 | 0 | 0 | 0 | 0 | 1015.39 | 0 | 0 | 19.32 | 115.35 |
| Gambia | 1867 | 0 | 0 | 0 | 0 | 0 | 0 | 0 | 0 | 0 | 0 | 10.41 | 127.55 |
| Georgia | 4083 | 231.23 | 4.66 | 0 | 0.36 | 0 | 0 | 0 | 156.38 | 0 | 0 | 22.61 | 109.68 |
| Germany | 80 566 | 32.58 | 2.42 | 43.93 | 9.60 | 0 | 73.26 | 48.20 | 179.57 | 51.16 | 113.24 | 52.93 | 118.50 |
| Ghana | 26 164 | 35.92 | 0 | 0.01 | 0 | 0 | 0 | 0 | 180.25 | 0 | 0 | 6.92 | 138.50 |
| Greece | 11 055 | 65.52 | 2.33 | 37.66 | 22.45 | 0 | 42.73 | 0 | 101.62 | 16.55 | 10.62 | 41.60 | 124.65 |
| Greenland | 56 | 100 | 0 | 0 | 0 | 0 | 0 | 0 | 0 | 0 | 0 | 48.43 | 96.85 |
| Grenada | 106 | 0 | 0 | 0 | 0 | 0 | 0 | 0 | 0 | 0 | 0 | 29.01 | 89.78 |
| Guatemala | 15 691 | 33.85 | 15.42 | 0 | 0 | 0 | 0 | 0 | 639.47 | 0 | 0 | 13.08 | 107.26 |
| Guinea | 11 949 | 0 | 0 | 0 | 0 | 0 | 0 | 0 | 0 | 0 | 0 | 4.75 | 118.84 |
| Guinea-Bissau | 1757 | 0 | 0 | 0 | 0 | 0 | 0 | 0 | 0 | 0 | 0 | 8.14 | 103.44 |
| Guyana | 761 | 0 | 0 | 0 | 0 | 0 | 0 | 0 | 0 | 0 | 0 | 20.77 | 107.46 |
| Haiti | 10 431 | 1.54 | 0 | 0 | 0 | 0 | 0 | 0 | 422.77 | 0 | 0 | 7.65 | 93.90 |
| Honduras | 7849 | 39.83 | 0 | 0 | 0 | 0 | 4.51 | 0 | 381.75 | 0 | 0 | 19.76 | 108.62 |
| Hong Kong SAR | 7164 | 0 | 0 | 0.02 | 0 | 0 | 0.03 | 0 | 9.94 | 0.81 | 7.23 | 60.10 | 97.72 |
| Hungary | 9925 | 2.45 | 15.07 | 0.29 | 0.80 | 0 | 8.26 | 5.68 | 193.66 | 40.81 | 10.27 | 44.12 | 99.61 |
| Iceland | 325 | 4512.09 | 16979.75 | 0 | 0 | 0 | 1.05 | 0 | 0 | 0 | 6.91 | 72.01 | 89.64 |
| India | 1 279 499 | 12.64 | 0 | 0.31 | 0.46 | 0 | 3.00 | 0.30 | 194.33 | 0.16 | 0.41 | 11.23 | 107.60 |
| Indonesia | 251 268 | 7.69 | 85.50 | 0 | 0 | 0 | 0 | 0.05 | 286.45 | 10.12 | 0 | 8.57 | 122.76 |
| Iran IR | 77 152 | 22.55 | 0 | 0 | 0 | 0 | 0.31 | 0 | 8.57 | 0 | 0.11 | 16.08 | 132.06 |
| Iraq | 34 107 | 19.38 | 0 | 0 | 0 | 0 | 0 | 0 | 1.65 | 0 | 0 | 7.55 | 112.98 |
| Ireland | 4671 | 14.12 | 0 | 0 | 3.20 | 0 | 110.98 | 13.85 | 55.45 | 6.32 | 13.69 | 45.81 | 128.09 |
| Israel | 7818 | 0.41 | 0 | 7.14 | 186.77 | 0 | 0.09 | 0 | 0.74 | 0 | 3.45 | 39.27 | 136.03 |
| Italy | 59 771 | 100.78 | 111.36 | 41.23 | 3.73 | 0 | 28.45 | 18.37 | 165.35 | 12.19 | 40.31 | 44.26 | 127.07 |
| Jamaica | 2773 | 4.77 | 0 | 0 | 0 | 0 | 4.73 | 0 | 236.30 | 0 | 0 | 23.68 | 110.36 |
| Japan | 126 985 | 70.17 | 25.16 | 12.84 | 3.31 | 0 | 4.67 | 6.69 | 88.42 | 0 | 0 | 26.78 | 104.89 |
| Jordan | 7215 | 0.87 | 0 | 0 | 26.67 | 0 | 0.05 | 0 | 0.59 | 0 | 0.32 | 18.93 | 133.51 |
| Kazakhstan | 17 100 | 51.60 | 0 | 0.01 | 0 | 0 | 0.03 | 0 | 5.12 | 0 | 0 | 45.23 | 105.23 |
| Kenya | 43 693 | 10.31 | 52.41 | 0 | 0 | 0 | 0.05 | 0 | 471.42 | 0 | 0 | 14.09 | 90.99 |
| Kiribati | 109 | 0 | 0 | 0 | 0 | 0 | 0 | 0 | 0 | 0 | 0 | 18.31 | 128.09 |
| Korea | 49 847 | 9.82 | 2.32 | 3.68 | 0.74 | 1.11 | 2.63 | 9.24 | 25.36 | 9.38 | 6.31 | 26.83 | 134.38 |
| Korea DPR | 24 896 | 62.82 | 0 | 0 | 0 | 0 | 0 | 0 | 58.16 | 0 | 0 | 6.20 | 95.50 |
| Kosovo | 8.16 | 0 | 0 | 0.19 | 0 | 0 | 0 | 164.71 | 0 | 0 | |||
| Kuwait | 3594 | 0 | 0 | 0 | 0 | 0 | 0 | 0 | 0 | 0 | 0 | 32.35 | 135.74 |
| Kyrgyzstan | 5746 | 260.18 | 0 | 0 | 0 | 0 | 0 | 0 | 0.88 | 0 | 0 | 30.02 | 106.92 |
| Laos PDR | 6580 | 0 | 0 | 0 | 0 | 0 | 0 | 0 | 0 | 0 | 0 | 9.78 | 104.31 |
| Latvia | 2012 | 165.21 | 0 | 0 | 0 | 0 | 6.81 | 0 | 1155.29 | 39.95 | 42.46 | 47.60 | 111.86 |
| Lebanon | 5287 | 25.91 | 0 | 0 | 5.99 | 0 | 0 | 0 | 29.90 | 0 | 0 | 21.26 | 132.78 |
| Lesotho | 2083 | 0 | 0 | 0 | 0 | 0 | 0 | 0 | 0 | 0 | 0 | 7.89 | 117.77 |
| Liberia | 4294 | 0 | 0 | 0 | 0 | 0 | 0 | 0 | 0 | 0 | 0 | 4.46 | 104.55 |
| Libya | 6266 | 0 | 0 | 0 | 0 | 0 | 0 | 0 | 35.66 | 0 | 0 | 17.82 | 142.23 |
| Liechtenstein | 37 | 0 | 0 | 0 | 0 | 0 | 0 | 0 | 0 | 0 | 0 | 48.43 | 106.59 |
| Lithuania | 2964 | 20.06 | 0.75 | 1.73 | 0 | 0 | 23.22 | 5.00 | 466.17 | 52.94 | 6.94 | 49.20 | 118.50 |
| Luxembourg | 545 | 24.93 | 0 | 15.50 | 6.05 | 0 | 17.39 | 26.06 | 133.32 | 0 | 36.99 | 55.74 | 117.05 |
| Macao SAR | 568 | 0 | 0 | 0 | 0 | 0 | 0 | 0 | 0 | 0 | 0 | 46.30 | 92.45 |
| Macedonia FYR | 2073 | 87.24 | 5.80 | 0.50 | 0 | 0 | 0 | 0 | 101.19 | 0 | 0 | 26.92 | 114.62 |
| Madagascar | 22 925 | 0 | 0 | 0 | 0 | 0 | 0 | 0 | 0 | 0 | 0 | 7.51 | 93.46 |
| Malawi | 16 190 | 0 | 0 | 0 | 0 | 0 | 0 | 0 | 0 | 0 | 0 | 4.75 | 108.28 |
| Malaysia | 29 465 | 41.01 | 0 | 0.55 | 0 | 0 | 0 | 0.14 | 157.85 | 21.62 | 0.36 | 25.13 | 113.12 |
| Maldives | 0 | 0 | 0 | 0 | 0 | 0 | 0 | 0 | 0 | 0 | 33.46 | 98.40 | |
| Mali | 16 592 | 0 | 0 | 0 | 0 | 0 | 0 | 0 | 0 | 0 | 0 | 19.90 | 117.34 |
| Malta | 417 | 0 | 0 | 8.76 | 13.16 | 0 | 0 | 0 | 0 | 2.80 | 4.94 | 43.63 | 120.48 |
| Mauritania | 3873 | 0 | 0 | 0 | 0 | 0 | 0 | 0 | 0 | 0 | 0 | 23.68 | 111.48 |
| Mauritius | 1264 | 8.58 | 0 | 0.27 | 0 | 0 | 0.36 | 0 | 219.50 | 0 | 6.02 | 22.42 | 125.57 |
| Mexico | 123 740 | 25.83 | 35.67 | 0.10 | 1.83 | 0 | 3.86 | 0 | 95.09 | 0 | 0.50 | 29.69 | 116.95 |
| Mongolia | 2859 | 0 | 0 | 0 | 0 | 0 | 3.39 | 0 | 66.54 | 0 | 0 | 38.60 | 80.68 |
| Montenegro | 625 | 457.55 | 0 | 0 | 0 | 0 | 0 | 0 | 373.89 | 0 | 0 | 52.11 | 120.68 |
| Morocco | 33 453 | 9.50 | 0 | 0 | 0 | 0 | 5.05 | 0 | 56.12 | 0 | 0 | 14.87 | 146.54 |
| Mozambique | 26 467 | 62.73 | 0 | 0 | 0 | 0 | 0 | 0 | 431.26 | 0 | 0 | 4.65 | 104.70 |
| Myanmar | 52 984 | 19.13 | 0 | 0 | 0 | 0 | 0 | 0 | 271.04 | 0 | 0 | 20.97 | 101.65 |
| Namibia | 2347 | 61.87 | 0 | 0 | 0.97 | 0 | 0 | 0 | 187.02 | 0 | 0 | 15.98 | 85.04 |
| Nepal | 27 835 | 14.91 | 0 | 0 | 0 | 0 | 0 | 0 | 387.82 | 0 | 7.65 | 9.54 | 117.05 |
| Netherlands | 16 809 | 0.77 | 1.87 | 3.50 | 2.05 | 0 | 38.21 | 63.06 | 87.90 | 117.02 | 24.61 | 48.67 | 103.78 |
| New Caledonia | 256 | 0 | 0 | 0 | 0 | 0 | 0 | 0 | 0 | 0 | 0 | 38.35 | 98.79 |
| New Zealand | 4465 | 589.05 | 1261.20 | 0.18 | 2.58 | 0 | 51.63 | 0 | 321.38 | 0.82 | 20.19 | 57.53 | 95.98 |
| Nicaragua | 5946 | 8.75 | 130.30 | 0 | 0 | 0 | 10.79 | 0 | 325.15 | 0 | 0 | 15.06 | 109.10 |
| Niger | 18 359 | 0 | 0 | 0.02 | 0 | 0 | 0 | 0 | 148.15 | 0 | 0 | 10.07 | 113.27 |
| Nigeria | 172 817 | 3.52 | 0 | 0 | 0 | 0 | 0 | 0 | 836.10 | 0 | 0 | 5.18 | 125.86 |
| Northern Mariana Isl | 54 | 0 | 0 | 0 | 0 | 0 | 0 | 0 | 0 | 0 | 0 | 14.53 | 95.85 |
| Norway | 5083 | 2884.74 | 0 | 0 | 0 | 0 | 42.53 | 54.14 | 255.70 | 9.18 | 6.85 | 54.29 | 114.43 |
| Oman | 3907 | 0 | 0 | 0 | 0 | 0 | 0 | 0 | 0 | 0 | 0 | 31.38 | 117.63 |
| Pakistan | 181 193 | 19.64 | 0 | 0 | 0 | 0 | 0 | 0 | 222.66 | 0 | 0 | 25.13 | 92.35 |
| Panama | 3806 | 193.24 | 0 | 0 | 0 | 0 | 0 | 0 | 149.02 | 2.68 | 0 | 27.02 | 101.11 |
| Papua New Guinea | 7309 | 0 | 0 | 0 | 0 | 0 | 0 | 0 | 0 | 0 | 0 | 10.12 | 95.25 |
| Paraguay | 6466 | 1065.87 | 0 | 0 | 0 | 0 | 0 | 0 | 444.15 | 19.45 | 0 | 26.30 | 100.29 |
| Peru | 30 565 | 83.50 | 0 | 0 | 0.55 | 0 | 0 | 0 | 119.41 | 2.82 | 0.96 | 14.09 | 113.32 |
| Philippines | 97 572 | 11.72 | 112.32 | 0 | 0 | 0 | 0.08 | 0.12 | 105.99 | 2.19 | 0 | 18.79 | 105.76 |
| Poland | 38619 | 7.21 | 0.64 | 0 | 0.52 | 0 | 17.75 | 1.22 | 234.83 | 24.05 | 6.23 | 45.62 | 123.15 |
| Portugal | 10 460 | 149.83 | 22.92 | 5.23 | 9.23 | 0 | 131.10 | 12.27 | 339.51 | 34.76 | 8.29 | 49.35 | 118.01 |
| Puerto Rico | 3691 | 0 | 0 | 0 | 0 | 0 | 0 | 0 | 0 | 0 | 0 | 48.43 | 121.07 |
| Qatar | 2101 | 16.84 | 0 | 0 | 0 | 0 | 0.05 | 0 | 169.10 | 0 | 0.54 | 38.74 | 96.85 |
| Republic of Moldova | 4074 | 0 | 0 | 0 | 0 | 0 | 0 | 0 | 0 | 0 | 0 | 32.78 | 104.60 |
| Réunion | 849 | 0 | 0 | 0 | 0 | 0 | 0 | 0 | 0 | 0 | 0 | 29.06 | 96.85 |
| Romania | 19 794 | 86.25 | 1.75 | 2.42 | 0.01 | 0 | 26.06 | 0.01 | 245.14 | 9.83 | 1.32 | 39.32 | 123.53 |
| Russian Fed | 143 367 | 144.22 | 4.17 | 0 | 0 | 0 | 0 | 0 | 28.04 | 0 | 0 | 39.03 | 123.63 |
| Rwanda | 11078 | 0 | 0 | 0 | 0 | 0 | 0 | 0 | 0 | 0 | 0 | 3.63 | 100.39 |
| St Kitts Nevis | 54 | 0 | 0 | 0 | 0 | 0 | 0 | 0 | 0 | 0 | 0 | 33.70 | 87.70 |
| St Lucia | 182 | 0 | 0 | 0 | 0 | 0 | 0 | 0 | 0 | 0 | 0 | 34.82 | 92.45 |
| St Vincent Grenadines | 109 | 0 | 0 | 0 | 0 | 0 | 0 | 0 | 0 | 0 | 0 | 30.61 | 112.78 |
| Samoa | 190 | 0 | 0 | 0 | 0 | 0 | 0 | 0 | 0 | 0 | 0 | 35.06 | 104.02 |
| San Marino | 31 | 0 | 0 | 0 | 0 | 0 | 0 | 0 | 0 | 0 | 0 | 45.14 | 132.01 |
| Sao Tome Principe | 182 | 0 | 0 | 0 | 0 | 0 | 0 | 0 | 0 | 0 | 0 | 8.86 | 120.73 |
| Saudi Arabia | 30 201 | 0 | 0 | 0 | 0 | 0 | 0 | 0 | 0 | 0 | 0 | 23.58 | 127.60 |
| Senegal | 14 221 | 2.47 | 0 | 0.03 | 0 | 0 | 0 | 0 | 161.62 | 0 | 0 | 8.47 | 109.01 |
| Serbia | 8938 | 130.30 | 0.67 | 0 | 0 | 0 | 0 | 0 | 163.75 | 0 | 0.61 | 31.19 | 100.73 |
| Seychelles | 95 | 0 | 0 | 0 | 0 | 0 | 0 | 0 | 0 | 0 | 0 | 23.97 | 93.80 |
| Sierra Leone | 6179 | 0 | 0 | 0 | 0 | 0 | 0 | 0 | 0 | 0 | 0 | 5.71 | 107.26 |
| Singapore | 5405 | 0 | 0 | 0.34 | 0 | 0 | 0 | 78.92 | 0 | 0 | 0 | 29.06 | 96.85 |
| Slovak Rep | 5419 | 102.11 | 1.60 | 12.38 | 1.37 | 0 | 0.13 | 3.79 | 188.20 | 36.17 | 13.45 | 35.30 | 105.23 |
| Slovenia | 2065 | 255.00 | 24.65 | 11.88 | 6.20 | 0 | 0.22 | 0 | 367.25 | 1.13 | 22.32 | 41.50 | 112.15 |
| Solomon Islands | 561 | 0 | 0 | 0 | 0 | 0 | 0 | 0 | 0 | 0 | 0 | 10.27 | 109.49 |
| Somalia | 10 268 | 0 | 0 | 0 | 0 | 0 | 0 | 0 | 0 | 0 | 0 | 29.88 | 48.96 |
| South Africa | 53 417 | 2.48 | 0 | 0.52 | 2.26 | 0 | 0.08 | 0 | 386.39 | 0 | 0 | 22.37 | 123.24 |
| Spain | 46 455 | 90.37 | 0.52 | 20.39 | 56.11 | 0 | 132.44 | 4.18 | 159.25 | 25.07 | 8.16 | 40.24 | 113.90 |
| Sri Lanka | 20 522 | 38.48 | 0 | 0.11 | 0 | 0 | 1.31 | 0 | 311.30 | 0 | 0 | 8.14 | 112.49 |
| Sudan | 38 515 | 24.64 | 0 | 0 | 0 | 0 | 0 | 0 | 313.08 | 0 | 0 | 25.76 | 87.84 |
| Suriname | 533 | 0 | 0 | 0 | 0 | 0 | 0 | 0 | 0 | 0 | 0 | 17.82 | 114.24 |
| Swaziland | 1251 | 0 | 0 | 0 | 0 | 0 | 0 | 0 | 0 | 0 | 0 | 10.80 | 99.37 |
| Sweden | 9624 | 727.72 | 0 | 0.42 | 1.54 | 0 | 116.72 | 113.08 | 1270.04 | 62.91 | 19.99 | 51.86 | 101.16 |
| Switzerland | 8119 | 540.72 | 53.21 | 7.65 | 7.97 | 0 | 1.27 | 86.31 | 163.84 | 0.63 | 15.95 | 54.43 | 114.43 |
| Syrian Arab Republic | 19 323 | 17.72 | 0 | 0 | 0 | 0 | 0 | 0 | 0.48 | 0 | 0 | 19.85 | 127.26 |
| Taiwan Teipei | 23 337 | 26.52 | 0 | 1.57 | 5.90 | 0 | 6.57 | 37.63 | 12.00 | 7.17 | 0.34 | 32.01 | 111.14 |
| Tajikistan | 8112 | 240.20 | 0 | 0 | 0 | 0 | 0 | 0 | 0 | 0 | 0 | 9.25 | 92.49 |
| Thailand | 67 451 | 9.73 | 0.02 | 1.83 | 0 | 0 | 0.52 | 1.97 | 444.17 | 25.03 | 13.30 | 16.71 | 116.95 |
| Timor-Leste | 1129 | 0 | 0 | 0 | 0 | 0 | 0 | 0 | 0 | 0 | 0 | 10.80 | 90.07 |
| Togo | 6929 | 1.47 | 0 | 0 | 0 | 0 | 0 | 0 | 490.47 | 0 | 0 | 4.16 | 110.41 |
| Trinidad and Tobago | 1348 | 0 | 0 | 0 | 0 | 0 | 0 | 0 | 13.52 | 0 | 0 | 27.31 | 112.59 |
| Tunisia | 11 006 | 0.62 | 0 | 0.11 | 4.75 | 0 | 3.71 | 0 | 129.64 | 0 | 0 | 16.66 | 146.15 |
| Turkey | 76 224 | 88.98 | 45.89 | 0 | 13.84 | 0 | 11.32 | 0 | 74.53 | 0.76 | 3.54 | 23.78 | 154.48 |
| Turkmenistan | 5240 | 0 | 0 | 0 | 0 | 0 | 0 | 0 | 0 | 0 | 0 | 33.46 | 106.15 |
| Uganda | 36 573 | 0 | 0 | 0 | 0 | 0 | 0 | 0 | 0 | 0 | 0 | 8.52 | 101.89 |
| Ukraine | 45 165 | 34.88 | 0 | 1.44 | 0 | 0 | 1.61 | 0 | 55.26 | 1.28 | 0 | 31.09 | 121.02 |
| United Arab Emirates | 9040 | 0 | 0 | 0 | 0 | 0 | 0 | 0 | 0 | 0 | 0 | 24.46 | 131.23 |
| United Kingdom | 63 956 | 8.38 | 0.02 | 3.63 | 3.93 | 0.01 | 50.75 | 14.19 | 44.66 | 10.97 | 37.85 | 47.89 | 117.43 |
| UR of Tanzania | 50 213 | 3.90 | 0 | 0.03 | 0 | 0 | 0 | 0 | 529.82 | 0 | 0 | 6.88 | 99.66 |
| United States | 317 136 | 97.48 | 36.15 | 5.27 | 6.90 | 0 | 61.08 | 15.12 | 214.96 | 127.21 | 26.56 | 48.18 | 128.04 |
| Uruguay | 3408 | 274.84 | 0 | 0 | 0 | 0 | 4.82 | 0 | 553.64 | 16.95 | 0 | 35.54 | 106.78 |
| Uzbekistan | 29 033 | 45.45 | 0 | 0 | 0 | 0 | 0 | 0 | 0.18 | 0 | 0 | 24.26 | 105.28 |
| Vanuatu | 253 | 0 | 0 | 0 | 0 | 0 | 0 | 0 | 0 | 0 | 0 | 21.84 | 114.72 |
| Venezuela | 30 276 | 314.96 | 0 | 0 | 0 | 0 | 0 | 0 | 32.72 | 0 | 0 | 27.70 | 111.77 |
| Viet Nam | 91 379 | 71.36 | 0 | 0 | 0 | 0 | 0.11 | 0 | 220.44 | 0 | 0 | 27.84 | 103.68 |
| Yemen | 25 533 | 0 | 0 | 0 | 0 | 0 | 0 | 0 | 5.60 | 0 | 0 | 8.18 | 98.69 |
| Zambia | 15 246 | 99.42 | 0 | 0 | 0 | 0 | 0 | 0 | 644.63 | 0 | 0 | 5.28 | 87.07 |
| Zimbabwe | 14 898 | 38.17 | 0 | 0 | 0 | 0 | 0 | 0 | 621.09 | 0 | 0 | 9.69 | 96.85 |
| World | 8 575 084 | 50.45 | 10.24 | 1.85 | 4.38 | 0.01 | 8.45 | 2.43 | 189.70 | 10.67 | 4.71 | 23.79 | 111.75 |
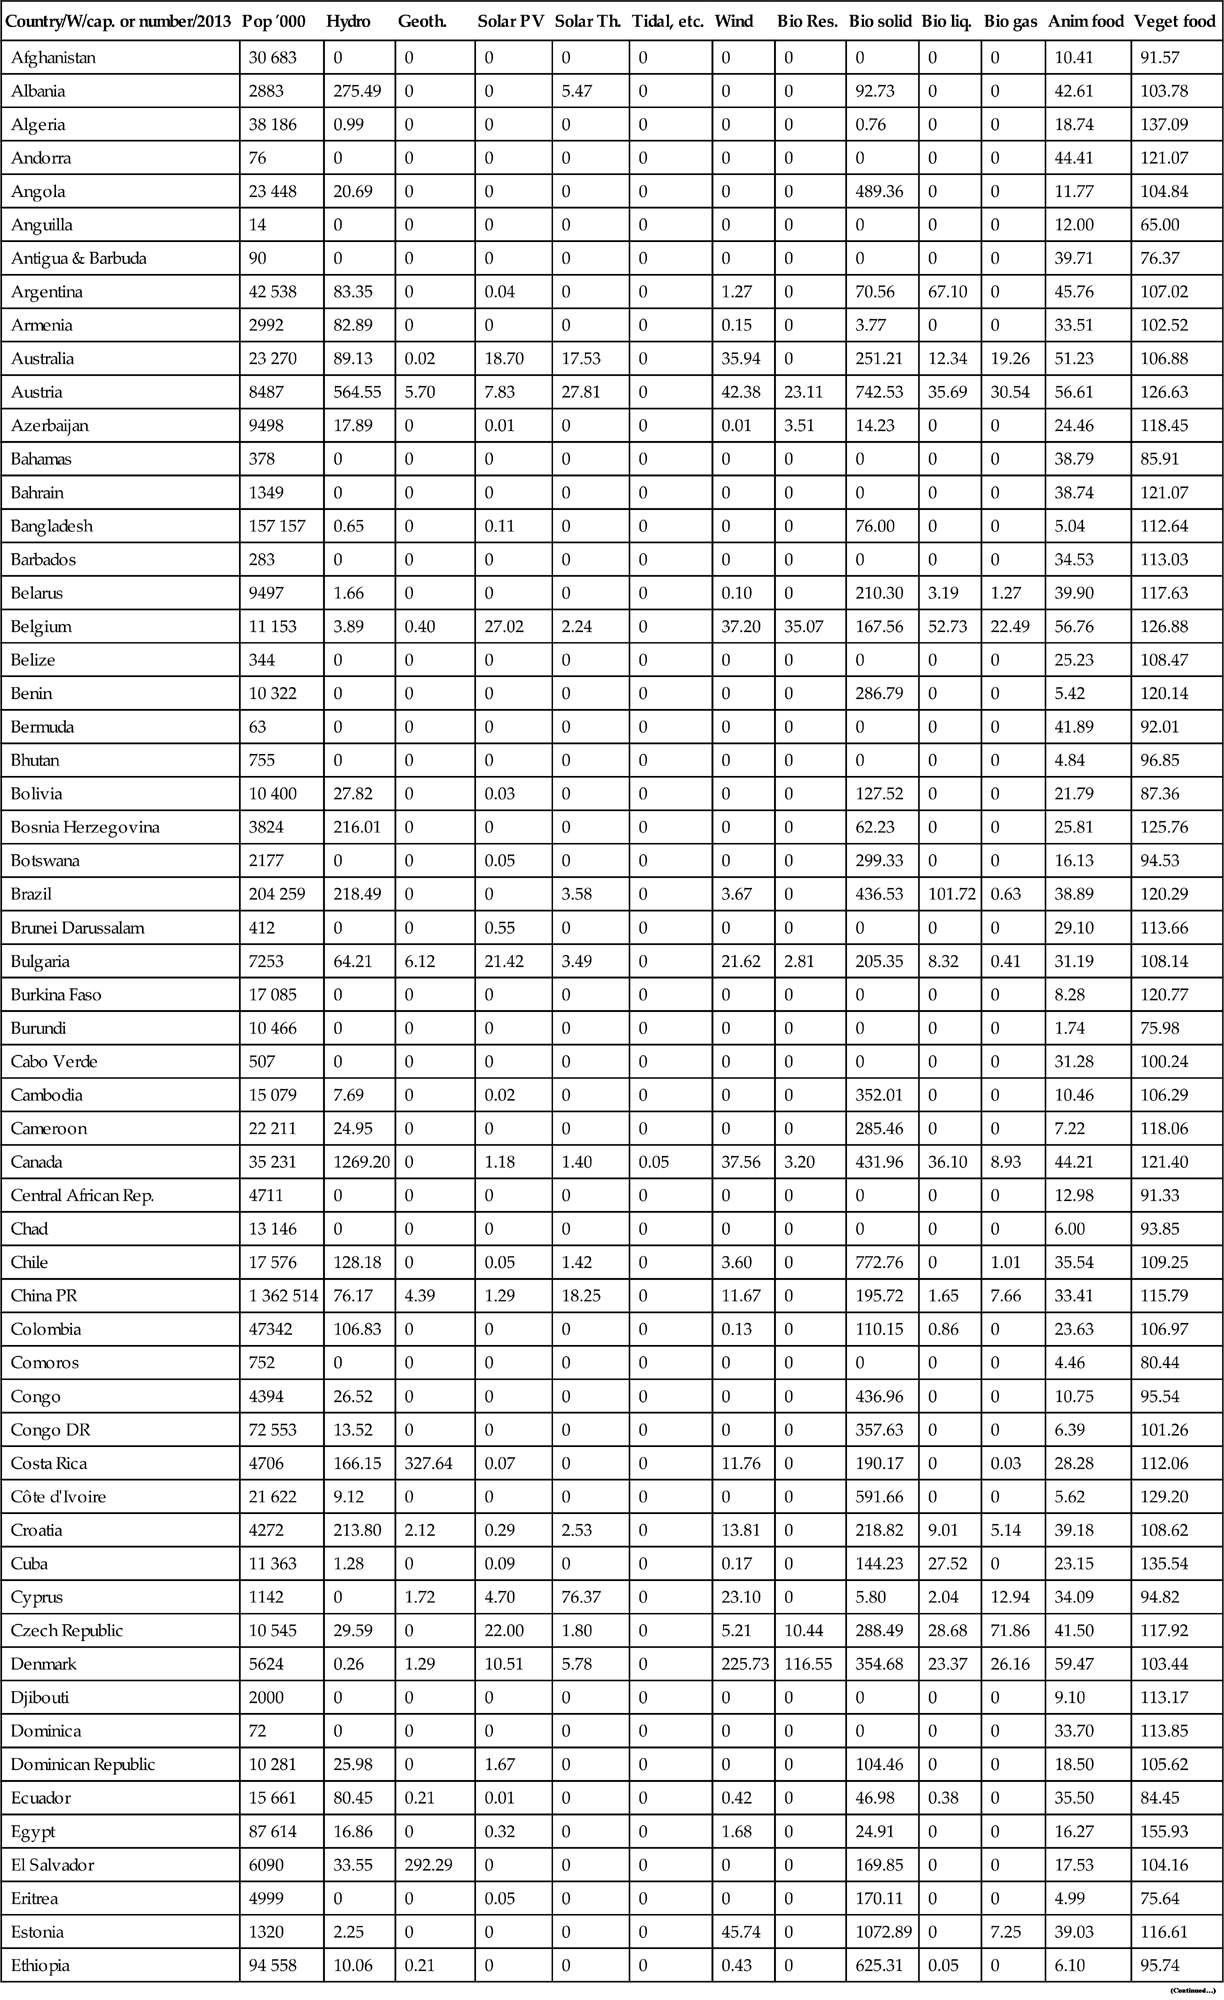
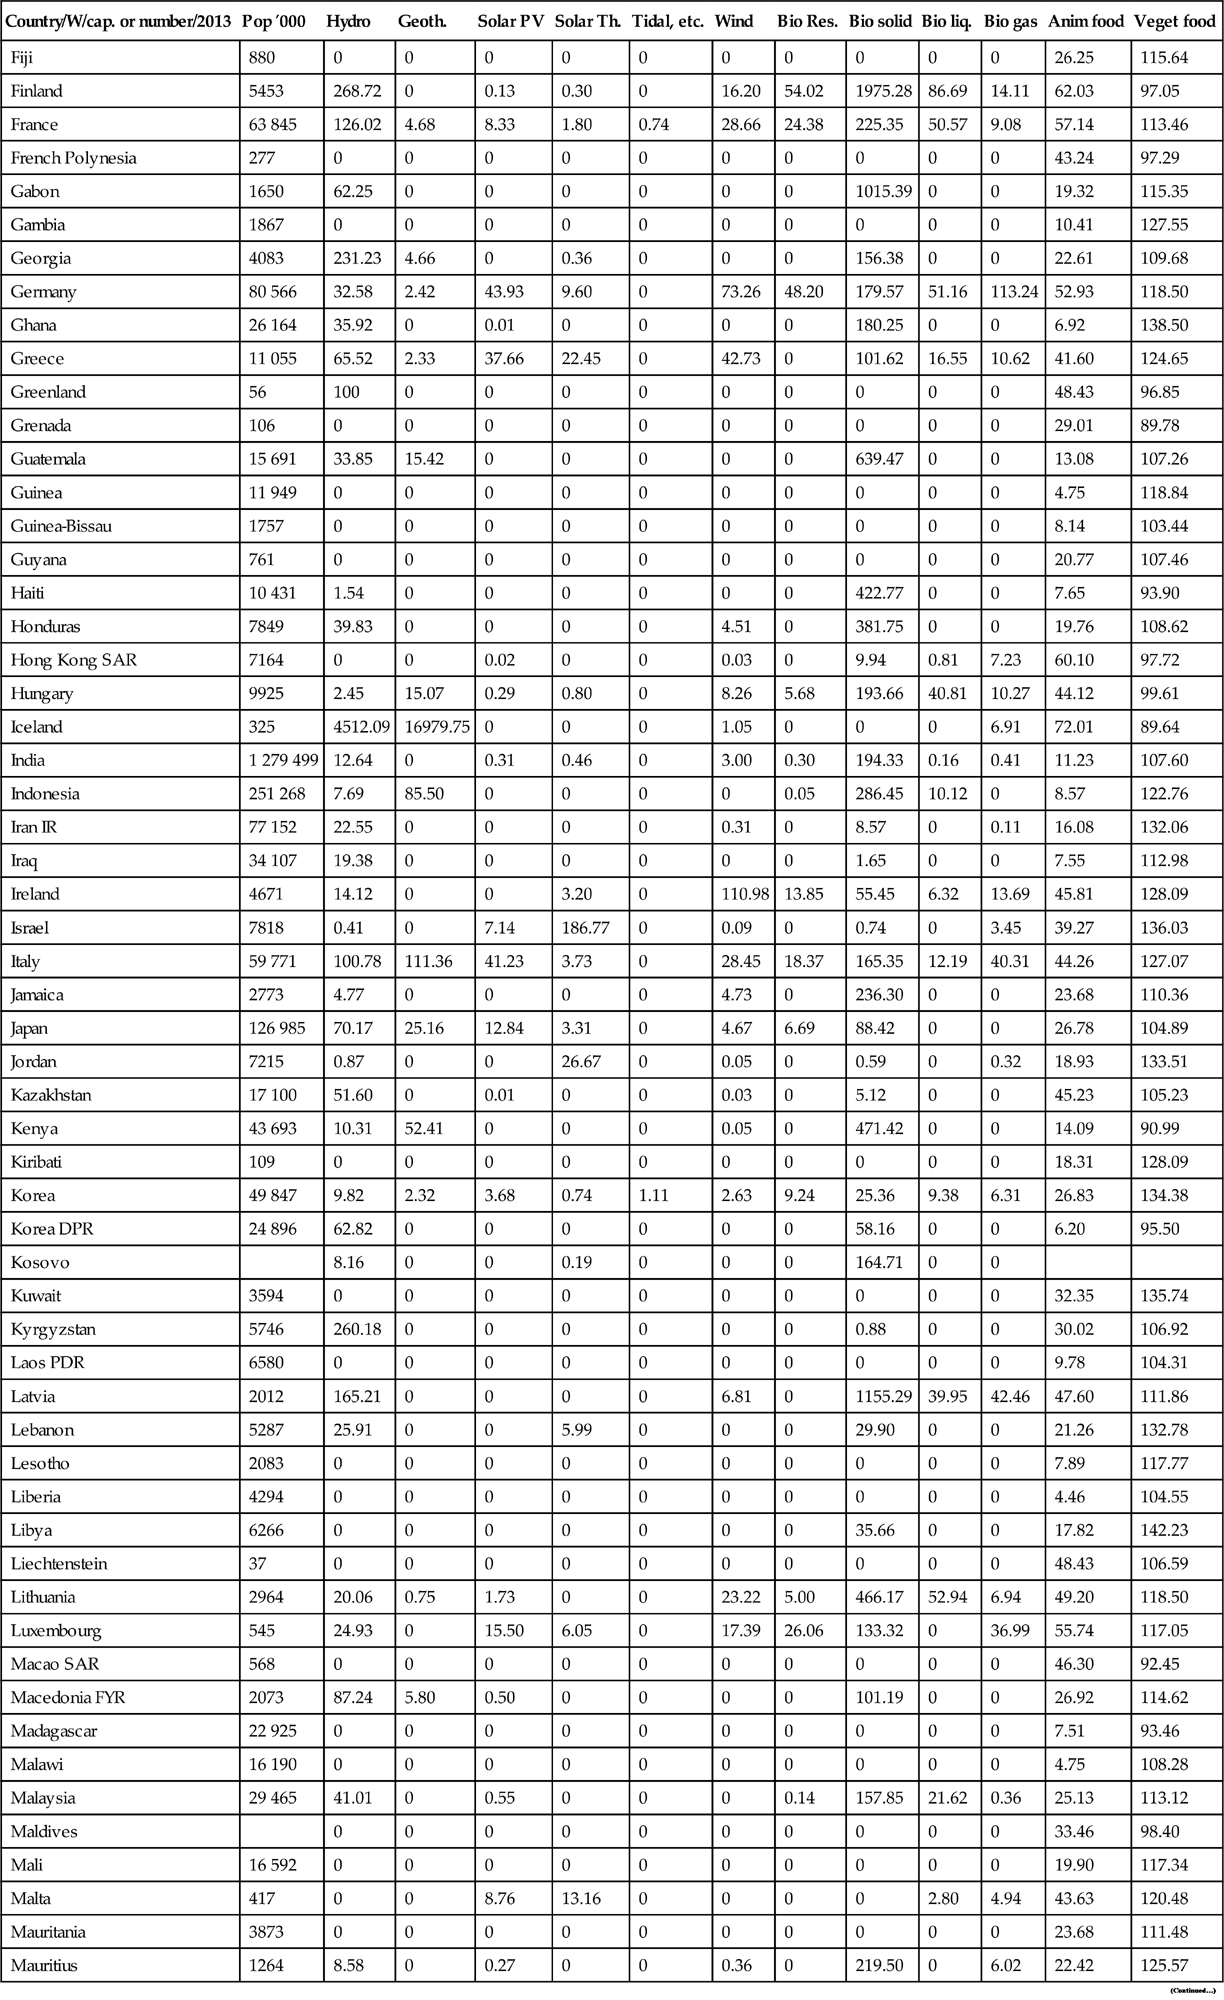

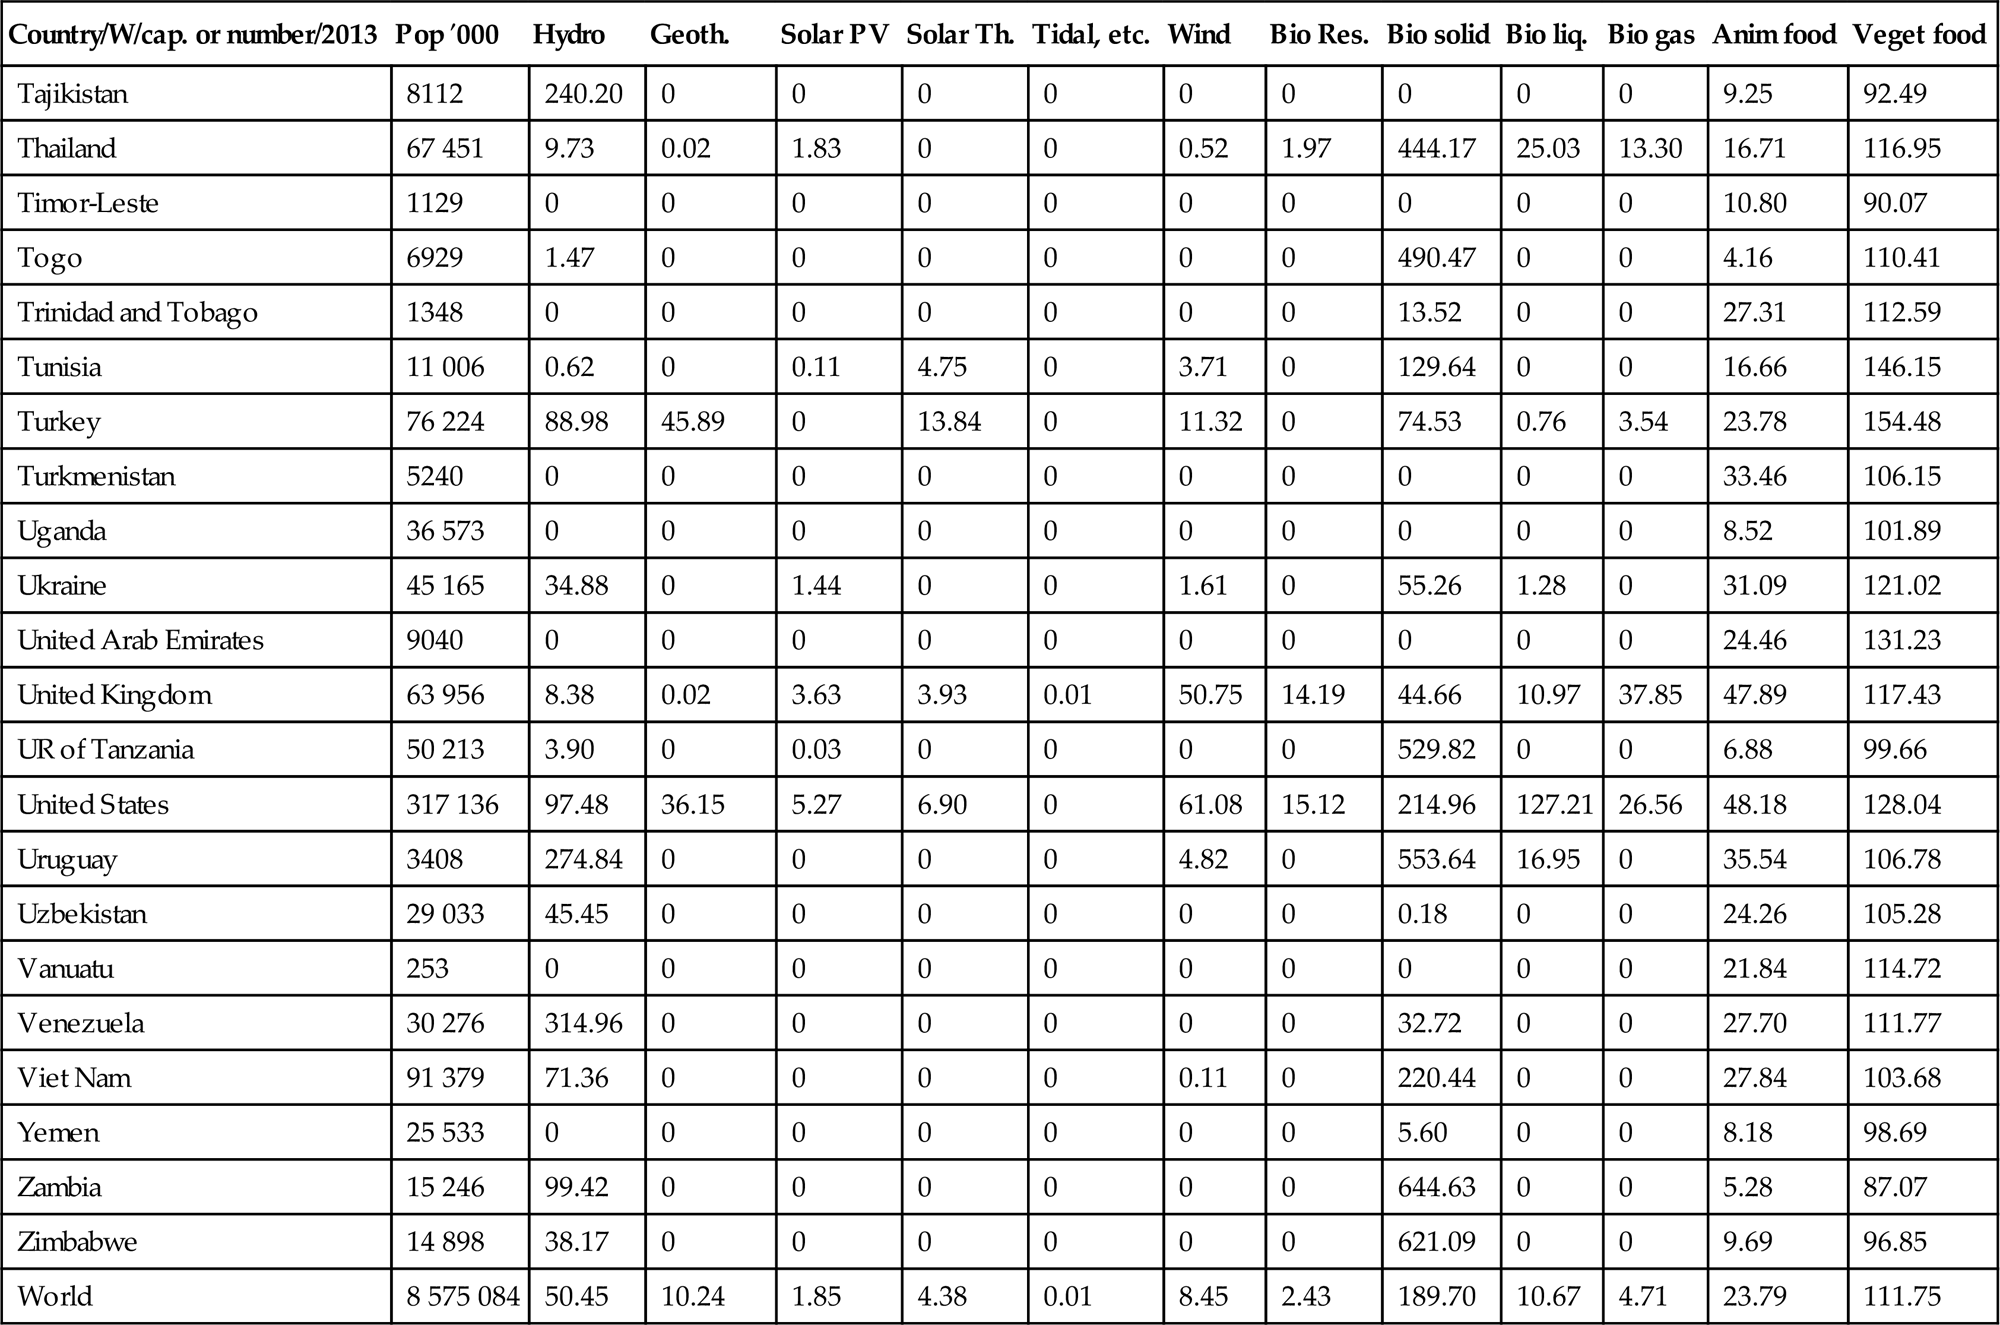


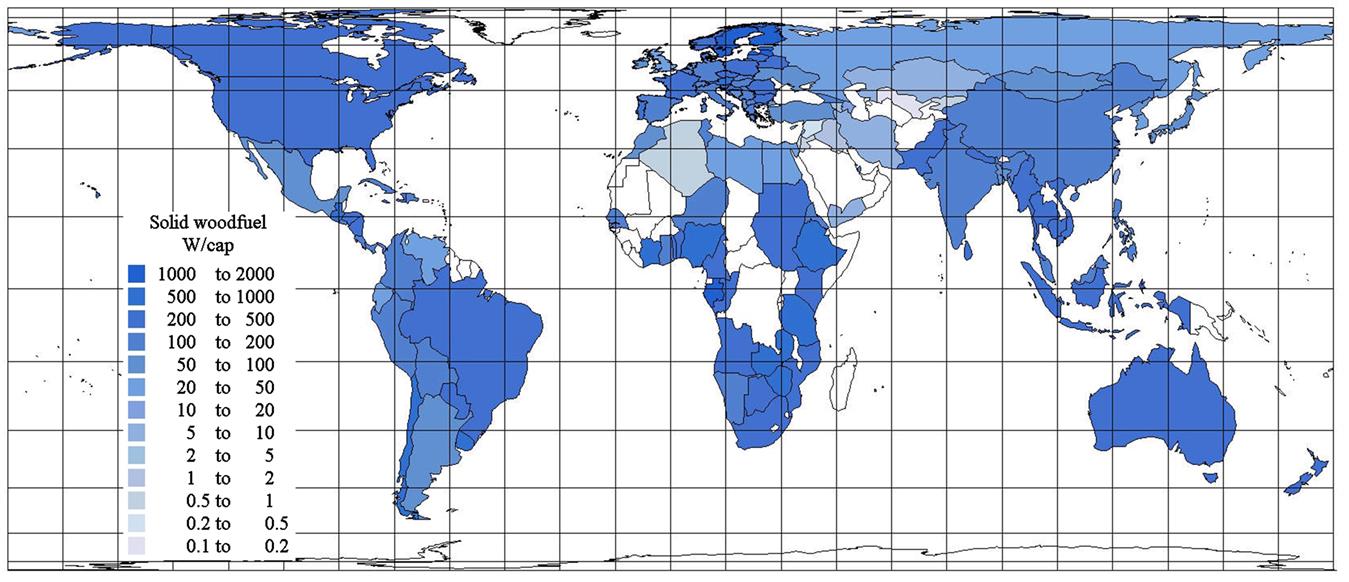


As a comparison of Tables 1.1 and 1.2 shows, the traditional use of biomass for combustion is still the dominating use of renewable energy, in 2013 at an average of 190 W/cap., although the efficiency of combustion varies. Most of the biomass combusted is woodfuel, where the claim of CO2-neutrality made, e.g., by EU countries and in global climate negotiations is false, because the time between CO2 assimilation by trees and release to the atmosphere is of the order of a hundred years, implying that current emissions are not necessarily compensated by present assimilation of CO2. Particularly disturbing is the fact that combustion of wood in inefficient private burners is rising in the wealthiest countries of Europe, for no compelling reason other than saving a little money by ignoring environmental issues (both locally and globally) that are not included in the woodfuel prices, and sometimes also evading fuel taxes and profits by acquiring the fuelwood from non-commercial sources. In the poorest countries, wood combustion is declining due to increasing scarcity of free wood resources, which combined with the increase in the developed world made the total woodfuel use decline by 15% from year 2000 to 2013. Combustion in large facilities in developed countries largely avoids the pollution from biomass burning by use of tall stacks and electrostatic filters, but of course cannot avoid the CO2 emission impacts.
Another large biofuel use (136 W/cap. by 2013, slightly less than in year 2000) is the use of food energy in biomass of animal or vegetable origin (the nutrient value of food being, in any case, more than that of the energy it provides). Next comes hydropower (50 W/cap.) and then geothermal power, which only in part can be classified as renewable (as many steam reservoirs are exploited at a rate that will exhaust the reservoir over periods of decades). In addition to the limited number of sites with high-temperature steam available, there is a significant possibility for using low-temperature geothermal heat of widespread occurrence for district heating.
Use of liquid biofuels was in 2013 at 11 W/cap., up from 2.3 W/cap. in year 2000, but delays of basing biofuel production on biomass residues rather than food crops have slowed the progress. Use of municipal biomass waste for power or heat has declined from 3.7 to 2.4 W/cap., possibly due to better separation of waste. Solar heating installations in 2013 provided 4.4 W/cap., compared with just 0.1 W/cap. by the year 2000. Tidal power has stayed below 0.01 W/cap., and wave or ocean thermal power is still at the research stage.
The market characteristics of the various renewable energy forms exhibit differences linked to the nature of each source. For food energy, the price is influenced by population size, by variations in production due to climatic variations, by the choices made in regard to area use, by livestock holdings, by fish quotas, and by the competitive behavior of the food processing and marketing industry. Yet the bulk prices of different commodities seem remarkably consistent with their energy content, largely varying only in the interval 0.8–2.5 US$ or € per kWh (heat value).* According to OECD (2016a) data, translated to energy units, the current wholesale price of cereals like rice is in the low end of the interval, while the wholesale price of typical meat and dairy products is about 1.25 $ or € per kWh. Only specialized gourmet products obtain the higher prices in the marketplace. Consumer retail prices are typically some five times higher than the bulk prices here quoted. This is some 20 times the current consumer price of a kWh of electricity produced from fossil fuels, suggesting that it would be economically unacceptable to use food crops for energy. However, this is not always true, because food prices vary all the time according to local supply and demand (cf. the discussion in Chapter 7.1), and sometimes surpluses are dumped on the energy market at very low prices.
Wholesale market prices for biomass waste and fuelwood range from not much more than 1 ($ or €) cents per kWh of “burning value,” i.e., energy of combustion, in India (FAO-Asia, 2003) to 2–3 c/kWh in industrialized countries, which is higher than the price of coal (Danish Energy Agency, 1996, 2002; Alakangas et al., 2002).
The production cost of biogas is 6–11 c/kWh (Danish Energy Agency, 1992), while that of wind power is 3–7 c/kWh (depending on wind conditions) and that of photovoltaic solar power is 6–60 c/kWh (based on IEA-PVPS, 2016; for a typical capacity factor of 0.15–0.20 and capital cost depreciation over 20 years). The photovoltaic market enjoys substantial public start-up subsidies (often in the form of subsidized customer investments or attractive buy-back rates for excess solar power). This has been the case in countries like Germany and Japan, while in Switzerland the market has largely been created by industries’ buying photovoltaic panels for reasons of aesthetics or image greening.
Hydropower costs 2–10 c/kWh, while coal- and gas-based power costs about 5–9 c/kWh to produce (depending on cleaning features; Danish Energy Agency, 2002; Kraemer, 2016). To all costs given above one should add the cost of distribution, which is likely different in the case of centralized and decentralized production units (the latter may be zero), and, in many countries, there are further taxes and environmental externality payments, leading in some cases to customer prices above 30 c/kWh. As a result, in countries where wind power and photovoltaic power are exempt from pollution and CO2 taxes, they have become the cheapest options for the consumer much earlier than in countries partially or fully neglecting externalities.
For fossil fuels such as oil and natural gas, current production costs vary from very small figures at some Middle East wells to over 3 c/kWh from offshore facilities or from low-grade resources such as shale and tar sand. The sales price is not strongly coupled to production prices, but is determined by market and political considerations. Some countries are willing to wage war against oil-producing countries in order to control production and prices. Refined products like gasoline are currently sold at prices around 7 c/kWh, with diesel fuel slightly lower, plus taxes and environmental fees where they apply. Not long ago the prices were higher, and along the path of exhaustion, prices have to increase. Alternatives such as liquid biofuels have production costs of 4–10 c/kWh (ethanol from sugar cane and methanol from woody biomass at the low end, ethanol from sugar beet higher, and biofuels from cellulosic material at the high end or above it). The cost of hydrogen is also an issue, as it may be the best option for underground storage of energy to handle the intermittency of renewable resources such as solar end wind energy (independent of whether hydrogen succeeds in penetrating the transportation sector, cf. Sørensen, 2012). Factors such as the willingness to consider externalities in pricing, the uncertainty of future fossil fuel prices (for political and resource depletion reasons) and an ongoing revealing of new environmental problems for fossil and nuclear fuels, all contribute to making it difficult to predict the rate of penetration of renewable energy sources. More on these issues will be said in Chapters 7 and 8.
1.2 Past and present energy resources
From a scientific point of view, an issue more essential than the place of renewable energy in the marketplace is its place within the physical universe. This view is developed in the following paragraphs, as a prerequisite for estimating the amounts of energy that can be extracted for use by human society at a rate that qualifies the process as renewable. Other views are philosophical and economic, the latter of which is taken up in Chapter 7.
The speed of the Earth in its orbit around the Sun is about 3×10⁴ m s−1, corresponding to a kinetic energy of some 2.7×1033 J. The Earth further rotates around its axis with an angular velocity of about 7.3×10⁻⁵ rad s−1, furnishing an additional kinetic energy of some 2.2×1029 J. The work required to pull the Earth infinitely far away from the Sun, against gravitational attraction, is about 5.3×1033 J, and the corresponding work required to separate the Earth from its moon is of the order of 8×1028 J.
These are some of the external conditions for our planet, spelled out in energy units. It is a little more difficult to obtain reliable estimates for the amount of energy residing within the Earth itself. The kinetic energy of molecular motion, heat energy, is of the order of 5×1030 J. This estimate represents the total heat energy, relative to the absolute zero temperature. It is extrapolated from the value 4×1030 J, given in section 3.4.2, for the heat energy in the interior of the Earth relative to the average surface temperature of 287 K.
The materials forming the Earth carry further energy, in addition to the heat energy corresponding to their temperature. About 1021 J is, on average, present as kinetic energy in the atmospheric and oceanic circulation (cf. section 2.3), and the potential energy of the continental height-relief, relative to sea level, is about 2×1025 J, taking into account density variations in the crust (Goguel, 1976). Much larger amounts of energy are involved in the chemical and nuclear bindings, which determine the state and structure of matter. The carbon compounds of biological material provide an example of chemical energy. During earlier periods of the Earth’s history, fossilization of biological material created the deposits of coal, oil, and natural gas, of which at least 1023 J is presently believed to be recoverable in a form suitable for fuel uses (see sections 2.3 and 4.6). Current standing crops of biomass correspond to an average of 1.5×10²² J (cf. sections 2.3 and 3.5).
Nuclear energy may be released in large quantities from nuclear reactions, such as fission of heavy nuclei or fusion of light nuclei. Except for spontaneously fissioning nuclear isotopes in the Earth’s crust, which release about 4×10²⁰ J y−1, an initial amount of energy must be provided in order to get the energy-releasing fission or fusion processes going. Set-ups for explosive release of nuclear energy involving both types of processes are used for military purposes. Only the fission process has as yet been demonstrated as a basis for controlled energy supply systems, and, with necessary additional improvements in the technology of fast breeder reactors, recoverable resources of nuclear fuels are estimated to be of the order of 1024 J (see Sørensen, 2012). If fusion of deuterium nuclei to form helium nuclei could be made viable on the basis of deuterium present in seawater, this resource alone would amount to more than 1031 J.
Energy conversion processes depleting certain materials of the Earth may be said to constitute irreversible processes. This is often true from a practical point of view, even if the reverse process may be theoretically possible.
The terms energy use, spending energy, etc., which are commonly used in energy literature as well as in everyday language, are of course imprecise expressions describing energy conversion processes. Such processes are in most cases associated with an increase in entropy. Entropy (S) is a property of a system that quantifies the “quality” of the energy contained in the system. The system may be, for example, an amount of fuel, a mass of air in motion, or the entire Earth–atmosphere system.
The entropy change for a process (e.g., an energy conversion process) that brings the system from a state 1 to a state 2 is defined as
(1.1)
where the integral is over successive infinitesimal and reversible process steps (not necessarily related to the real process, which may not be reversible), during which an amount of heat dQ is transferred from a reservoir of temperature T to the system. The imagined reservoirs may not exist in the real process, but the initial and final states of the system must have well-defined temperatures T1 and T2 in order for (1.1) to be applicable.
Conversion of certain forms of energy, such as electrical or mechanical energy, among themselves may, in principle, not change entropy, but in practice some fraction of the energy always gets converted into heat. The energy processes characteristic of human activities on Earth involve a series of successive conversion processes, usually ending with all the converted energy in the form of heat, radiated to space or released to the atmosphere, from which radiation of heat energy into space also takes place. The temperatures involved (the T2) are typically 200–300 K. The processes involved are discussed in more detail in Chapter 2.
Stored energy of any form that may be converted to heat that is ultimately lost to space could then be called a non-renewable energy resource. The term renewable energy resource is used for energy flows that are replenished at the same rate as they are “used.” The prime renewable energy resource is thus solar radiation intercepted by the Earth, because the Earth (i.e., the Earth–atmosphere system) re-radiates to space an amount of heat equal to the amount of solar radiation received (see Chapter 2). To utilize solar energy thus means converting it in a way convenient for man, but the net result is the same as if man had not interfered: that is, ultimately to convert solar radiation into heat radiated to space. Such usage may involve a delay in returning the heat, either as a part of man’s conversion scheme or by a natural process. For this reason, energy stores, which are part of the natural process of converting solar energy into heat re-radiation, are also considered renewable energy resources.
Renewable energy is not narrowly defined here, and it may be taken to include the usage of any energy storage reservoir that is being “refilled” at rates comparable to that of extraction.
The amount of solar energy intercepted by the Earth and hence the amount of energy flowing in the solar energy cycle (from incident radiation flux via reflection, absorption, and re-radiation to heat flux away from the Earth) is about 5.4×1024 J per year.
Energy fluxes of other than solar origin that occur naturally at the surface of the Earth are numerically much smaller. For example, the heat flux from the interior of the Earth through the surface is about 9.5×10²⁰ J y−1 (cf. section 3.4), and the energy dissipated in connection with the slowing down of the Earth’s rotation (due to tidal attraction by other masses in the solar system) is of the order of 1020 J y−1 (cf. section 2.5).
1.2.1 Energy history
The minimum human energy requirement may be taken as the amount of “exchangeable” chemical energy that can be associated with the amount of food necessary to maintain life processes for someone performing a minimum of work and not losing weight. This minimum depends on the temperature of the surroundings, but for an adult human is generally considered to lie in the region of 60–90 W on average for extended periods, corresponding to (6–8)×106 J day−1. The total intake requirements for sustaining human life are, of course, more than energy, comprising adequate supplies of water, nutrients, etc.
In order to perform any (muscle) work not purely vegetative, additional energy must be supplied in the form of food, or energy stored in the body will become depleted. The efficiency in converting stored energy into work typically ranges from 5% to 50%, with the lower efficiencies being associated with activities involving large fractions of static conversion (e.g., carrying a weight, which requires the conversion of body energy even if the weight is not being moved). The percentage complementary to the efficiency is released as various forms of heat energy.
The maximum average rate of food energy intake that a human being can continue for extended periods is about 330 W, and the maximum average rate at which work can be delivered for extended periods is of the order of 100 W (Spitzer, 1954). During work periods, the “man-power” output level may be 300–400 W, and the maximum power that can be delivered by an adult male for a period of about a minute is roughly 2000 W.
Although it is not certain that the rates of energy conversion by the human body have remained constant during human evolution, it may be reasonable to assume that the average amount of “muscle power” used by the earliest members of the genus Homo, which evidence suggests lived some 4×10⁶ years ago in Africa (Leakey, 1975), was of the order of 25 W.
The total energy flux received by an individual man in a food-gathering or hunting society is then the sum of the energy in the food, averaging say 125 W, and the absorbed flux of radiation and heat from the surroundings, which may reach considerably larger values, but is highly dependent on clothing, climate, and the nature of the surroundings (cf. Budyko, 1974). The outgoing energy flux again consists of heat and radiation fluxes, as well as turnover of organic material, plus the amount of energy converted into work. For growing individuals, the net flux is positive and the mass of biological material increases, but also for adult individuals with zero net energy flux, new biomass continues to be produced to replace “respiration losses.”
Humans have successively developed new activities that have allowed them to gain access to larger amounts of energy. Solar energy may have been used for drying purposes, and as soon as fires became available, a number of activities based on firewood energy may have started, including heating, food preparation, and process heat for tool making. The earliest evidence for fires used in connection with dwellings is from Hungary; it dates from 350 000 to 400 000 years ago (H. Becker, 1977, personal communication).
A good fire in open air, using some 10–50 kg of firewood per hour, may convert energy at a rate of 104–105 W, whereas indoor fires are likely to have been limited to about 103 W. Several persons would presumably share a fire, and it would probably not burn continuously at such a power level, but rather would be relit when required (e.g., from glowing embers). It is thus difficult to estimate the average fire energy per person, but it would hardly exceed 100 W in primitive societies. The efficiency of delivering energy for the desired task is quite low, in particular for open-air fires.
A recent estimate of the energy used by Neanderthals during the warm interglacial Eem period some 125 000 years ago is an average of 135 W/cap. for a location in Northern Europe with an average temperature of about 8°C (Sørensen, 2009). Table 1.3 gives an estimate of activities requiring energy use beyond the basic metabolic rate (which for Neanderthal males averaged 92 W, for females 77 W), based on a group with 10 adult members and 15 children. Activities include hunting, wood provision, and tool making; fires were used for cooking and heating the cave or hut used for dwelling; but without woolen covers and some clothes and footwear, survival at Northern latitudes would not be possible.
Table 1.3
Estimate of activities requiring metabolic food conversion, muscle energy, or heat from fires in a Northern Eem Neanderthal group (Sørensen, 2009)
| Example of time use and corresponding rate of monthly average Energy Use (W/cap.) | 4 Males | 1 Male | 1 Female | 4 Females |
| Hunt: tracking down prey (8 h, 1 day in month) | 2.04 | 2.04 | 1.71 | |
| Hunt: prey killing (1 h, 1 day in month) | 0.45 | 0.45 | 0.37 | |
| Hunt: parting mammoth, drying, (3 h, 1 day in month) | 0.96 | 0.96 | 0.80 | |
| Hunt: eat, sleep, rest at hunt site (12 h, 1 day in month) | 1.69 | 1.69 | 1.41 | |
| Hunt: eat, watch, cut, scrape, sleep (24 h, 12 days in month) | 44.16 | 36.96 | ||
| Hunt: carrying meat back (10 h, 7 or 1 days in month) | 26.83 | 3.83 | 3.21 | |
| Hunt: sleep, rest at home (14 h, 7 or 1 days in month) | 13.77 | 1.97 | 1.65 | |
| Hunt: returning to hunt site from home (8 h, 6 days in month) | 12.27 | |||
| Hunt: eat, sleep, rest at hunt site (16 h, 6 days in month) | 14.72 | |||
| Home: wood cutting (8 h, 5 days in month) | 15.33 | |||
| Home: stone flaking, tools construction, clothes making | ||||
| (8 h, 11, 16, 30 days) | 22.49 | 32.71 | 27.38 | 61.33 |
| Home: fire attention, child rearing, food prep., leisure, eat (8 h, 16, 30 days) | 22.90 | 22.90 | 19.16 | 42.93 |
| Home: sleep (8 h, 16 or 30 days in month) | 16.36 | 16.36 | 13.69 | 25.67 |
| Monthly average energy expenditure, adult humans | ||||
| (W/cap.)* | 149.81 | 127.06 | 106.35 | 129.93 |
| Summary: | Male | Female | ||
| Average adult minimum energy requirement (W/cap.) | 145.26 | 125.22 | ||
| Total average adult energy requirement, W for whole group of 10 adults | 1352.37 | |||
| Children’s average energy requirement (W for whole group of 15 children) | 400.00 | |||
| Equivalent meat intake (loss 30%), W and GJ per month for whole group of 25 people | 2503 W or 6.5 GJ/month | |||
| Equivalent meat intake (loss 30%), in kg/month for whole group of 25 people | 813 kg/month | |||
| Fires: 5 cooking fires 8 h, 30 days (346 kg dry wood), average over month | 1667 W | |||
| Fires: large outdoor fire 8 h, 30 days (622 kg dry wood) | 3000 W | |||
| Fires: Possible fire at hunt site 12 h, 14 days in month (168 kg) | 810 W | |||
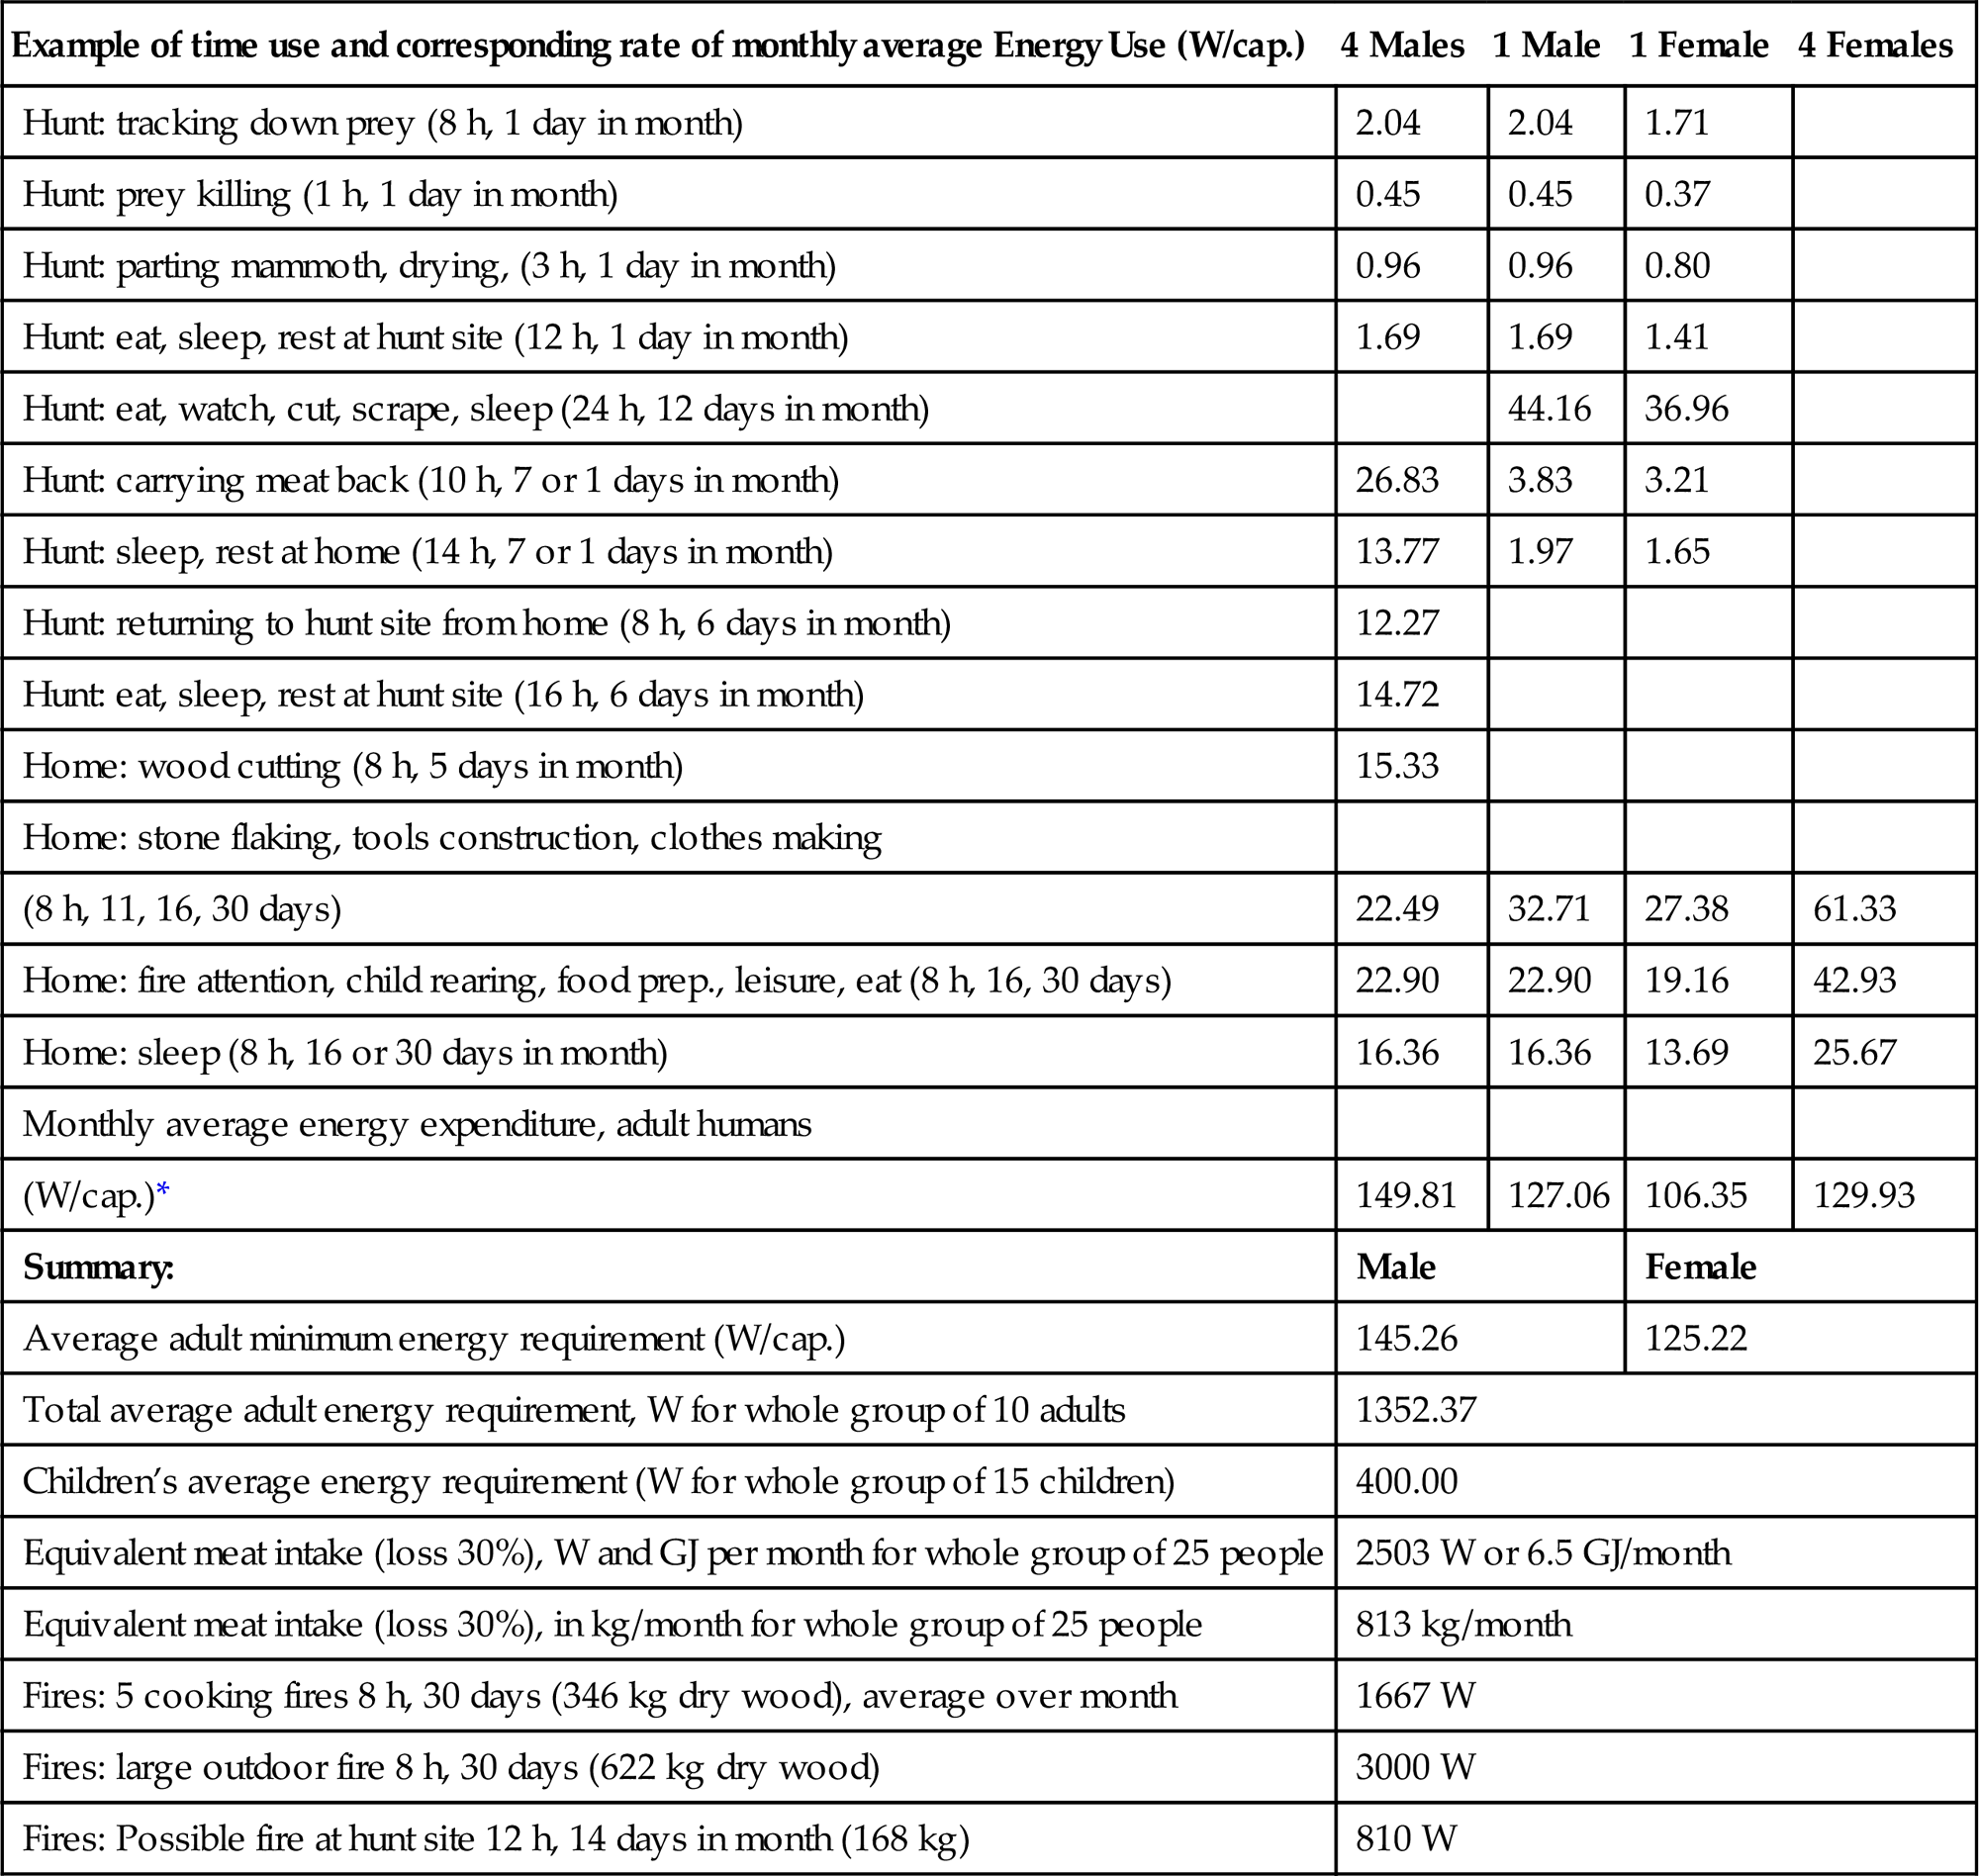
*1 W (watt) is 1 J/s or 2.63 MJ/month or 0.73 kWh/month.
The next jump in energy utilization is generally considered to have been associated with the taming of wild animals to serve as livestock and the introduction of agriculture. These revolutions have been dated to about 104 years ago for the Near East region (cf. DuRy, 1969), but may have developed at about the same time in other regions, such as in Thailand and Peru (Pringle, 1998). The introduction of livestock would have promoted the tendency to settle at a given place (or vice versa), increasing in turn the requirement for food beyond the capacity of a hunting society. Agriculture was based at first on wild varieties of wheat, for example, and it is believed that artificial irrigation was necessary at many of the sites where evidence of agriculture (various tools) has been found. The power for water transport and, later, pumping would then be derived from suitable draught animals in the livestock pool, as a substitute for man’s own muscle power. The transition from a hunting to an agricultural society, often called the Neolithic or new Stone Age, occurred several thousand years later in the temperate zones of northern America and Europe.
The creation of cultures of growing size and increasing levels of sophistication, leading to the formation of large cities (for example, at the Euphrates, Tigris, and Nile rivers), from about 7000 years ago, witnessed a growing use of energy for plowing, irrigation, grinding, and transport (of food supplies and of materials, for example, in connection with buildings and monuments), as well as the harvest of solar energy through agricultural crops. It is not known exactly how much of the physical work was performed by men and how much by animals, but it is likely that another 100–200 W was added to the average energy usage per capita in the most developed regions.
Figure 1.16 gives an example of a recent reconstruction of energy use from 125 000 to 1100 years ago, for Denmark (Sørensen, 2011). The energy use is taken at the end-user and delivered energy would be higher, due to losses (e.g., from open fires). There are no specific energy data for the period, but energy is derived from indirect data, such as number of farms and taxes paid in medieval times, and from burial sites in the Stone Age. An attempt to maintain consistency is made by use of a demographic model, where parameters are changed only when identifiable events suggest so. The resulting variations agree well with the “free-hand” estimate for the early period in Fig. 1.18, which was made for the first (1979) edition of this book.

It is important to bear in mind that there must have been large differences in energy use between different societies and, at least in later times, between individuals within a given society. Throughout man’s history (the term history not being restricted to the presence of written records) there have been individuals whose access to energy was largely limited to that converted by their own bodies. In large regions of Asia and Africa today, the average energy spent per person is only a few hundred watts above the muscle-power level (with firewood as an important energy source). This means that parts of the population today use no more energy than the average person during the Neolithic period.
Thus, Neolithic energy sources were direct solar radiation, environmental heat, and animal biomass, as well as primary (plant) biomass in the form of food and then as firewood, plus mechanical work from the muscle power of animals.
In the Near East, oil was used for lighting, and bitumen had non-energy uses. Boat travel in the open sea (the Mediterranean) is believed to have started over 9000 years ago (Jacobsen, 1973), and there is evidence of wind energy utilization by means of sails in Egypt about 4500 years ago (Digby, 1954). Per person, wind energy may not at this time have contributed a significant proportion of the total energy use in the Mediterranean region, but later, when trade became more developed (about 4000 years ago), the total amount of energy spent on transportation on land and at sea constituted a less negligible share (maybe a few percent) of the total amount of energy spent in the “developed regions” of the world at the time.
The building of houses in many cases implied the creation of a required indoor climate with utilization of solar energy. In low-latitude regions, structures with high heat capacities were employed in order to smooth out day-to-night temperature variations, and often houses were built partly underground and the evaporation of soil moisture was utilized to create cool environments for living (during hot periods) and food storage (Bahadori, 1977). In regions with a colder climate, insulating* building materials (e.g., straw for roofs) were employed to reduce heat losses, and heat production not involving fires was increased by keeping livestock within the living area of the houses, so as to benefit from their respirational heat release.
Water mills and windmills (e.g., the vertical axis panemone type, probably derived from waterwheels, or the sail-wing type, presumably copied from ships’ sails) also played a role after a certain stage in development. The earliest mention of windmills in actual use is from India about 2400 years ago (Wulff, 1966). Considering these windmills’ low efficiency and overall size, it is unlikely that wind power has at any time accounted for a large proportion of average energy use. On the other hand, windmills and water mills offered the only alternative to muscle power for high-quality (i.e., low-entropy) mechanical energy, until the invention of the steam engine.
The Industrial Revolution 200–300 years ago placed at man’s disposal amounts of power capable of producing work far beyond his own muscle power. However, at that time, firewood was barely a renewable resource in the developed regions of the world, despite quite extensive programs to plant new forests to compensate for usage. The increase in energy usage made possible by growing industrialization did not really accelerate, therefore, before large amounts of coal became available as fuel. In the 20th century, the large growth in energy consumption was made possible by the availability of inexpensive fossil fuels: coal, natural gas, and oil.
An outline of the possible development in energy usage up to the present is presented in Figs. 1.17 and 1.19. Only over the past century or two have reliable worldwide data on energy usage been recorded, and even for this period the data comprise mainly direct use of commercial fuels, supplemented with incomplete information on biomass and other renewables. One reason for this is that it is more difficult to specify the remaining energy use, because, for example, solar collectors are often not individually monitored, local biomass use is not quantified in energy units, environmental heat gains vary from day to day, and so on. In Figs. 1.17 and 1.19, which are anyway only indicative, fuels are included in terms of their gross energy value, independently of end-use efficiency. The use of renewable energy flows, on the other hand, is given as an estimated net energy at the primary conversion stage, that is, the energy in food intake rather than the total amount of energy absorbed by the plants or the total biomass of plants and animals. The environmental energy contribution to maintaining man’s body temperature as well as the regulation of indoor climate by the choice of materials and building systems (“passive energy systems”) are excluded.
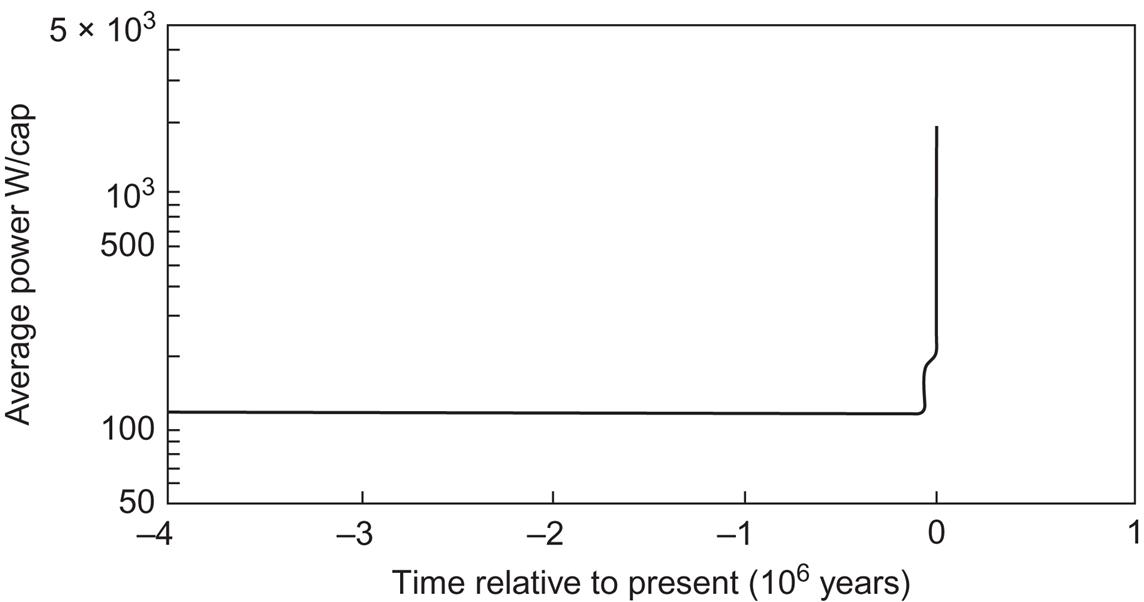
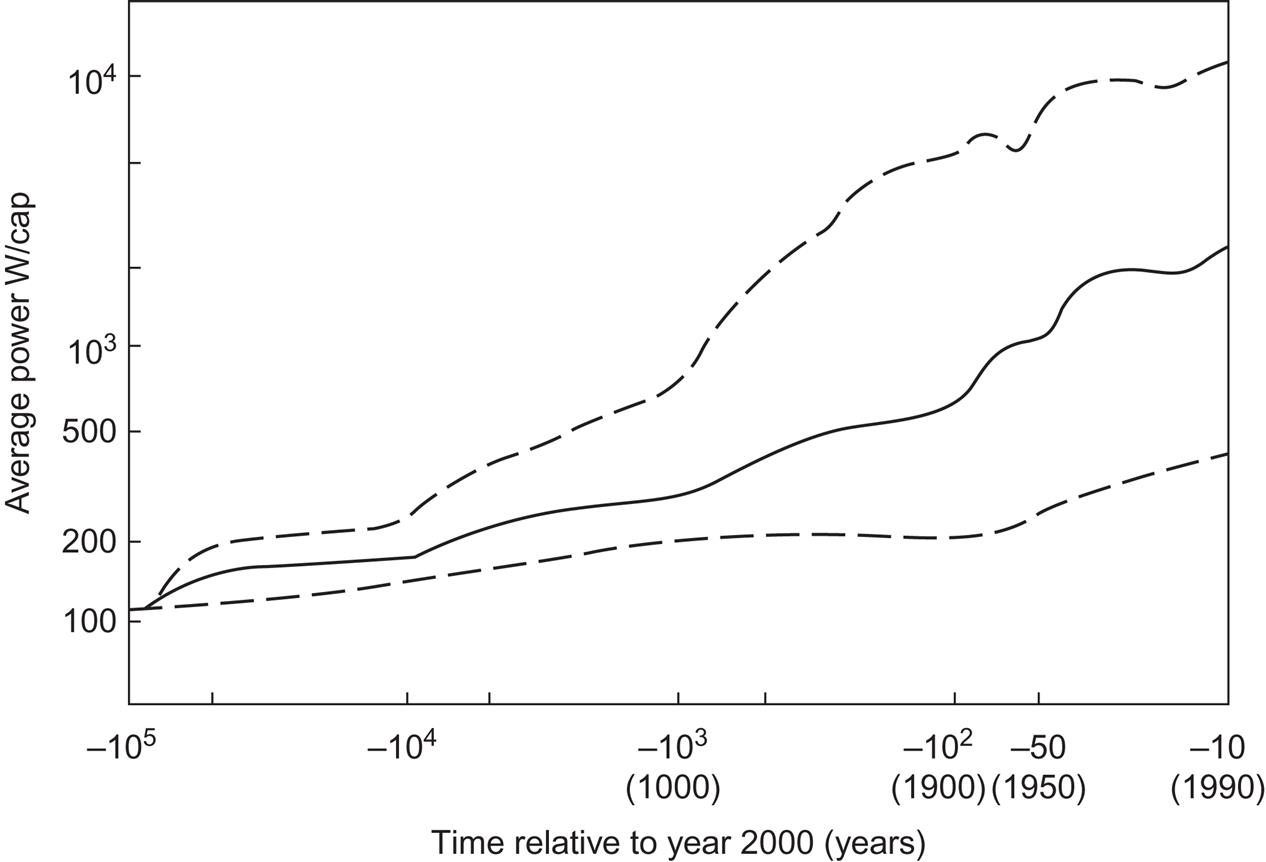
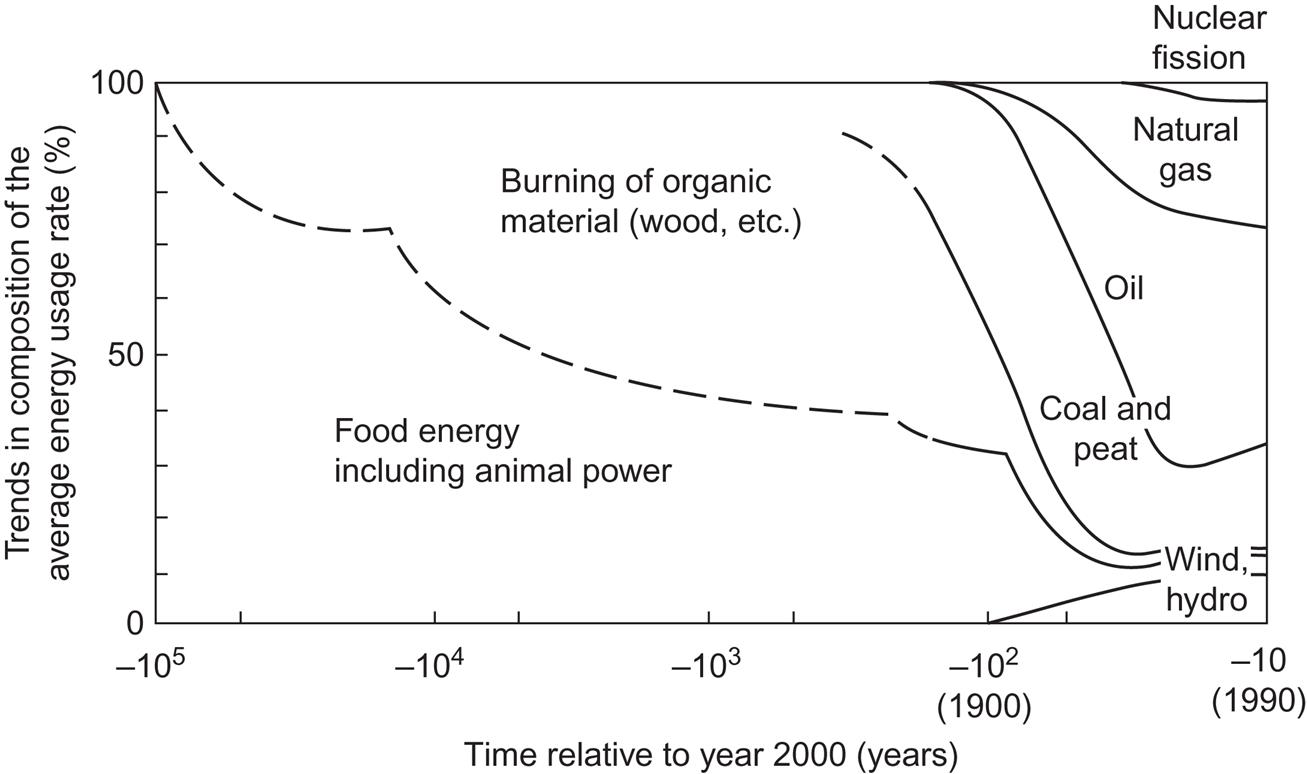
Figure 1.17 shows the trend in average rate of energy conversion per capita, on a linear time scale, and Fig. 1.18 shows the same trend on a logarithmic time scale, extending backward from the year 2000. Figure 1.18 also indicates the estimated spread in energy usage, with the upper curve representing the societies with highest energy use at a given time, and the lower curve representing the societies with the lowest energy use. These curves, which do not reflect any great degree of accuracy, do not represent rigorous limits, and values outside the interval may certainly be appropriate for individuals of a given society—the very rich or the very poor.
The energy conversion rate for food alone has been taken as 125 W throughout the time interval. The increase in energy usage from about –105 is associated with access to fire. The amount of energy derived from fires depends on whether fires were used only for cooking and for heating as well. The choice of the average curve also rests on the assumption that between −7×10⁴ and −104 years (i.e., during the latest ice age; cf. section 2.4) about half of the world’s population used fires for heating purposes.
In the time interval −104 to −103 years, human settlements developed into a variety of societies, some of which had a very high degree of organization and urbanization. The increase in energy usage was mainly associated with more systematic heating and cooking practices, with tool production (e.g., weapons) and with transportation (e.g., by riding or by draught animals). With increasing population density, materials that previously had been available in the immediate natural surroundings had to be transported from far away, or substitutes had to be manufactured; either way, additional energy had to be spent. In several of the societies in question, mechanical work was performed not only by animals but also by human slaves, so that the average per capita energy usage was less affected. The trends of the curves also reflect the differences in development characterizing different geographical regions. Simultaneously with the culmination of the civilizations in Mesopotamia and Egypt, northern Europe and northern America entered the Neolithic period, with warm climatic conditions quite different from those of the preceding several thousand years.
During the last 1000 years, the increasing energy usage is, in part, due to the shift in population distribution toward higher latitudes, and to overall increased requirements for space heating in such regions (the little Ice Age, cf. section 2.4). It should also be mentioned that the efficiency of converting the energy of firewood (supplemented by animal dung and later by peat) into useful heat for cooking, craft work, hot water, and space heating was quite low, for example, in 16th-century Europe, but gradually improved nearing the 20th century (Bjørnholm, 1976). During the period 1500–1900, the curves are a result of this feature (in particular, the early high maximum value attained for the most affluent societies) combined with increased energy demand (e.g., larger proportions of the population acquiring energy-demanding habits or lifestyles, such as taking hot baths, drinking hot beverages, washing clothes in hot water, etc.). The development in the last century is dominated by the energy consumption of the industrialized countries (industrial process heat, transportation, increased room temperature, refrigeration, lighting, etc.). During this period, the top curve in Fig. 1.17 represents the energy use of an affluent American, while the lowest curve represents the average energy use in the poor regions of Africa or India, including non-commercial fuels, such as cow dung and stray wood (which used to be absent from official statistics, as first noted by Makhijani, 1977).
In Fig. 1.19, the distribution of the energy consumption on different sources of energy is sketched. Again, only for the past century or two have actual data been used. The shape of the curve describing the diminishing share of food energy starting about 105 years ago is again dependent on emerging cultures and geographical distribution of the population, outlined above. It is clear, however, that the energy basis for human societies has been renewable energy sources until quite recently. Whether all the wood usage should be counted as renewable is debatable. Early agricultural practice (e.g., in northern Europe) involved burning forest areas for farming purposes and repeating the process in a new area after a few years, as the crop yield diminished owing to nutrient deficiency in the soil. Most forests not being converted into permanent agricultural land survived this exploitation, owing to the low population density and the stability of the soils originating from glacier deposits. Similar overuse, or overgrazing by livestock, would be (and was in fact) disastrous in low-latitude regions with a very shallow soil layer, which would simply be eroded away if the vegetation cover were removed (cf. section 2.4). Replanting forests has been common in northern Europe during the last few centuries, but the strongly increasing demand for wood over the last century (not just for fuel purposes), as well as construction work associated with urbanization, has led to an actual decrease in forest area in most parts of the world.
From the middle of the 19th century, non-renewable fossil fuels have rapidly increased their share of total energy usage, to the present 80%–90%. In the beginning, fossil fuels replaced wood, but they soon became the basis for exponential growth in energy use, associated with a number of novel energy-demanding activities. During the same period, usage of hydropower has increased, and recently nuclear fission power passed the 1% level. Growth has been interrupted by wars and periods of economic recession. The high dependence on non-renewable energy sources has developed over a very short period of time. The briefness of this era compared with the history of man on Earth stands out clearly on the linear scale used in Fig. 1.18.
1.3 Resource prospects for the future
Figure 1.18 shows the very large difference between the energy use of the affluent countries or affluent persons within countries and the energy use of the least energy-using inhabitants of poor countries. The situation may currently be changing, as the level of global interaction increases and every world citizen becomes aware of the kind of lifestyle that is “possible.” However, current development does not seem to indicate a diminishing gap between the energy use of those using the most and those using the least energy. This is also true of other commodities related to living standard.
Energy use and resource depletion do not, of course, constitute the primary goals of any society or any individual within a society. For example, the average European or Japanese uses about half as much energy as the average North American, but the former have a living standard no lower than that of the average North American. This fact demonstrates that, while living standard and welfare depend on having primary needs (food, shelter, relations) met, there are also secondary standards based on individual preference and implementation that can have different implications for energy use.
The relationship between economic activities and social welfare has been debated for a considerable period of time, as has the possibility of physical limits to growth in material exploitation of the resources of a finite planet. Conventional economists argue that the inventiveness of man will lead to substitution of new materials for those threatened by exhaustion, in an ever-ongoing process. Recognizing the finiteness of fossil and nuclear energy sources, this argument leads to the general prediction that renewable energy sources must take over at some stage, and the only debate is on how soon it will happen.
Most geologists believe that oil and natural gas production will peak sometime within the next one or two decades. After that, prices are bound to rise, thereby easing the introduction of alternative energy sources. The predicted higher price of energy also suggests that energy should be used more efficiently, in order to prevent higher energy cost’s slowing down improvement of human welfare. Measures for improving energy efficiency are already available that will raise efficiency by a factor of 3–5 without any substantial increase in cost (Sørensen, 1991, 2008).
Carbon capture could extend the use of coal, which is the fossil commodity that seems most abundant (see section 4.6). However, if coal is used for combustion, there might still be pollution beyond greenhouse gas emissions to worry about. Of course, the same is true for biofuels, unless the conversions are not to hydrocarbons but to pure hydrogen (producing only water by combustion and possibly not even combusted but rather used in fuel cells).
Nuclear fuel resources are no more abundant than oil or gas, when considered for use in conventional light-water reactors. Breeder technologies are currently no longer actively developed, since they proved to present problems with safety, capacity factors, and cost (Sørensen, 2012), and nothing suggests that fusion reactors, should they become workable, would have fewer radioactivity problems than fission reactors. The hope entertained by some fusion researchers, that it may some day be possible to find materials for the confinement structure that do not present a radioactivity danger after exposure to the operating conditions for nuclear fusion, seems to be inconsistent with the physics of fusion.
1.4 Global temperature impacts and other climate impacts
Currently, the interest in renewable energy is closely tied to the discussion of global warming, which is caused by the increased injection of greenhouse gases into the atmosphere (cf. section 2.4). However, it should not be forgotten that the prime reason for choosing renewable solutions is renewability, a property very closely linked to the desire to establish sustainable solutions that do not just replace old problems with new ones. Sustainability means exploiting flows, rather than stocks.
The greenhouse effect itself is a completely understood physical phenomenon, to which we owe the habitability of the Earth, as explained in Chapter 2 (see also Fig. 1.1). However, climate development is an extremely complex issue, of which the greenhouse effect is only a part. Human interference is altering both the magnitude of the greenhouse effect and a number of other things, and it is the climate change induced by this that should worry us. Human interference includes land-use change, emission into the atmosphere of light-absorbing gases, emission of particulate matter with different size distributions, and injection of chemical pollutants into the atmosphere at various levels. All of these cause changes in temperature and solar radiation budget, in a pattern that varies with latitude and longitude and can be positive or negative. The climate models used to predict the changes all include the basic greenhouse effect, but differ in how many of the other possible climate impacts they model. Furthermore, the models’ accuracy is limited by two approximations: One is use of an integration mesh that is much more coarse than some known variations in atmospheric variables (the model grid size has diminished from 250 to around 20 km over the last 20 years, but the accuracy of the model predictions is up to five times poorer than the grid dimensions, e.g., presently no better than about 100 km). The other approximation is that the climate variables used in models are averages of the true variables, such as wind velocity at a given location in the atmosphere. The true variables may be split into the sum of a mean value and a deviation from the mean value, but the latter is neglected in all climate models. In consequence, so are also the terms in the circulation equations that couple average motion and small-scale motion (i.e., the deviations from averages, cf. section 2.3). Finally, only a subset of the effects involving more than just air velocity, moisture, and temperature are included. Particles, chemical pollutants, and land use are quantities that can be treated theoretically, whereas the effects of localized volcanic eruptions or sunspot flares are more difficult to deal with. So people who do not “believe” in greenhouse warming can plainly be ignored, but those concerned about the accuracy of climate models are legitimate discussants. Even so, over the last 50+ years, each addition to the climate models has yielded results indicating a man-made, global warming (global average temperature increase for a given increase of greenhouse gases in the atmosphere), although justified question marks are attached to specific regional model predictions or statements on the frequency of extreme atmospheric events.
It is important to realize that the Earth–atmosphere system is not in its most stable state. The present state is meta-stable, and a more stable situation could occur if snow and ice covered the entire Earth’s surface (thus causing maximum reflection of sunlight, see section 2.4). This means that nudging the present system could trigger a change disproportionate to the amount of initial action. However, it is known that the present state possesses a certain level of stability, because neither seasonal variations nor annual climatic fluctuations nor long-term dispersal of particulates from major volcanic eruption has been able to induce a transition to another quasi-stable or fundamental state of the Earth–atmosphere system. Yet, the present pattern of ice ages and intermediate warmer periods has only lasted some six ice age cycles. Before that, very different climates existed. The suggestion (IPCC, 2013) that extreme events are becoming more frequent, and that the amplitude of excursions is increasing, suggests a finite (although likely small) probability of a climate change far beyond the causal implication of greenhouse warming.
The bottom line is clearly “Don’t play with the climate”! This dictum overrules suggestions like spraying soot on the Arctic/Antarctic ice or injecting radiation-absorbing dust into the atmosphere, for a “least-cost” suppression of global warming, without having to change any fossil energy habits. Although the suggested actions appear to have an effect opposite to that of greenhouse gas emissions, the differing geographical and height dependences of the intended effect make it difficult to ensure (and beyond present model-building capabilities to predict) that the result would not be different than the one aimed for, such as inducing a new glacial period in combination with changes in the Earth’s orbital parameters (cf. section 2.4).
1.5 Role of environmental and social issues
The development in energy use is linked to another factor that may serve to accelerate the energy transition, namely, increased awareness of the negative environmental impacts of energy production and use. Early man was capable of causing environmental disturbance only on a very local scale. However, extensive burning of forests, for example, to provide land for agriculture, which would later be abandoned when overexploitation diminished the crop or grazing yields, may have been instrumental in creating the desert and semi-desert regions presently found at low latitudes (Bryson, 1971). This is an early example of a possibly man-made climatic change. Recently, man has reached a technological level enabling him to convert energy at rates that can be maintained over extended areas and that are no longer small compared to the energy fluxes of solar origin that are responsible for the climate.
The average heat flux of anthropogenic origin (i.e., from fossil fuels) in an industrial and urban area like the Los Angeles Basin (about 1010 m2) was estimated in 1970 to be 7 W m−2 (Lees, 1970). The global average value in 1970 was 0.015 W m−2, and the average solar flux absorbed by the Earth–atmosphere system is 240 W m−2 (see section 2.4). In comparison, a forest fire, burning down an area of fertile, tropical forests in one week, would release a heat flux of about 1000 W m−2. Yet the average heat flux from forest fires in all continental regions, the average being over several years, is less than the average anthropogenic heat flux. The nuclear weapons arsenal built up during the last 50 years is somewhere in the range of 104–105 megatons (Feld, 1976), with the higher figure corresponding to about 4.4×10²⁰ J. If these weapons were detonated within a 24-hour interval, the average energy flux would be 5×10¹⁵ W, and if the target area were 1012 m2, the average heat flux would be 5000 W m−2. The destructive effects would not be confined to those of the immediate energy release. Radioactive contamination of the environment would cause additional death and decay and would establish other mechanisms for climatic disturbance (e.g., destruction of the stratospheric ozone shield), in addition to threatening human survival as the dominant species on the planet.
In the recent century, energy habits have been formed largely by those who sell fossil energy and energy-using equipment. They are responsible for consumer behavior biased toward buying an additional kWh of energy instead of saving one by efficiency measures, even if they are cheaper. This is linked to the “growth paradigm” introduced by the simplistic market economy in the 18th century. Even today, all financial sector accounting is done in terms of growth rates and all economic figures are calculated as a percentage of last year’s, a procedure that makes sense only during periods of exponential growth. Such periods must necessarily end and be replaced by more quiet variations, or they may even lead to declines. Today’s liberal paradigm also counts on “globalization” to achieve the lowest cost of welfare. The idea is that labor is done where it is cheapest, implying that a typical European or North American consumer product has been shipped back and forth to the Far East a number of times, in order to have each part produced, or each process performed, as cheaply as possible (so far, keeping the artistic designs at home). Similarly, food comes from areas where it appears cheapest to produce, and fruits are shipped from the opposite side of the Earth, at least during winter at the location of the consumer. This behavior rests on a fundamental assumption: Transportation around the globe, and the energy required for it, is a negligible part of the price of the goods in question. So far, fossil fuels have supported this assumption, because they cost little to extract (especially in the Middle East) and the negative environmental and climate impacts have not been reflected in intercontinental transportation costs. Some European nations have tried to levy taxes on fossil fuels consumed within their borders (to at least partially compensate for the negative impacts), but transport by ship or plane has continually escaped taxation (as demanded by the United States’ in the World Trade Organization). These factors make it clear why the majority of financial and political decision-makers still regard fossil fuels as the backbone of the energy supply for decades to come. As long as they are cheap, they cannot be scarce! Of course, such arguments are invalid in malfunctioning economic markets like the one prevailing today: In the 18th century, liberalism made it clear that the theory behind a market economy was valid only if markets consisted of many small actors and only if they all had full access to the knowledge needed to make the right decisions. Neither of these conditions is even approximately fulfilled in the present world economic system. The sad conclusion is that the proper energy solutions (as well as policies compatible with climate stabilization) will not prevail until the economic paradigm has been changed in a positive direction.
Some would say that certain energy supply systems and economic organizations go better together than other ones. However, it is probably an exaggeration to imagine that the introduction of one kind of energy technology rather than another will determine or solve such institutional problems. What may be true, though, is that certain types of technology allow a meaningful discussion of how societies could be organized differently from their present organization. At least some of the renewable energy technologies fit well with the needs of sophisticated, decentralized societies with responsible use of information technologies and with consideration of the needs of the underprivileged people in the present world characterized by strong inequality within and between its nations.
1.6 The sustainability test
Science and technology literature contains a range of suggestions for handling future energy demands. In the past, some of the technologies brought forward as “technically feasible” have actually been developed to commercial viability, and others not, for a variety of reasons. Over the last few decades, renewable energy has passed from the level of technical feasibility to a level of cautious introduction into the marketplace and not least into long-term government planning. One reason for its slow penetration is that some influential funding institutions, including the European Commission, have continued to use a large fraction of their R&D funds, as well as loan and aid money, on coal, fission, and fusion, ignoring the risk of pollution and long-range radioactive waste problems and hoping to obtain short-term industry advantages in export of outdated technology to former Eastern bloc and developing nations. If funds had wholeheartedly been aimed at a rapid transition from the fossil to the renewable era, progress could have been made much faster. This has been demonstrated by a number of recent scenario studies, some of which are described in Chapter 6. The general question of who controls technology development was discussed by Elliott and Elliott (1976) and by Sørensen (1983, 2014). For decades, advocates of using renewable energy were largely limited to a number of “grassroot” movements, to which credit is due for having finally begun to swing the mainstream thinking.
Renewable energy sources are typically characterized by a theoretical maximum rate at which energy may be extracted in a “renewable” mode—that is, the rate at which new energy is arriving or flowing into the reservoirs associated with many of the renewable energy flows. In some cases, the additional loop on a given renewable energy cycle, caused by man’s utilization of the source, will by itself modify the rate at which new energy is arriving. For instance, utilization of temperature differences in the oceans may alter surface evaporation rates and the velocities of ocean currents, which in both cases means the mechanisms for establishing the temperature differences may be altered (cf. section 3.3). The geothermal energy flux from the interior of the Earth is not a renewable resource, since the main part of the flux is associated with cooling of the interior (section 3.4). On the other hand, it is a very small fraction of the heat that is lost annually (2.4×10⁻¹⁰), so for practical purposes geothermal energy behaves as a renewable resource. Only in case of overexploitation, which has characterized some geothermal steam projects, is renewability not ensured.
Sustainability is discussed further in Chapter 8. The general structure of the chapters in this book is:
In Chapter 2, the nature and origin of renewable energy sources are discussed in what may resemble an odyssey through the sciences of astrophysics, atmospheric physics and chemistry, oceanography, and geophysics. The importance of connecting all the pieces into an interlocking, overall picture becomes evident when the possible environmental impact of extended use of the renewable energy sources in the service of mankind is investigated in Chapter 7.
Chapter 3 provides, for each renewable energy source, an estimate of the size of the resource, defined as the maximum rate of energy extraction that on an annual average basis can be renewed, independently of whether it is possible to extract such energy by known devices. Issues of power density and variability are also discussed in this chapter.
Chapter 4 opens with some general features of energy conversion devices and then describes a number of examples of energy conversion equipment suitable for specific renewable energy sources.
Chapter 5 gives an overview of various methods of energy transport and storage, which, together with the energy conversion devices, form the components of the total energy supply systems discussed in Chapter 6.
Chapter 6 discusses modeling the performance of individual renewable energy devices as well as whole systems and, finally, scenarios for the global use of renewable energy, with consideration of both spatial and temporal constraints in matching demand and supply.
In Chapter 7, renewable energy resources are first placed in the framework of current economic thinking, as a preliminary to quantifying some of the considerations that should go into constructing a viable energy supply system. Next, the chapter presents a survey of indirect economic factors to be considered, which leads to the description of the methodology of life-cycle analysis, which, together with the scenario technique, constitutes the means for an up-to-date economic analysis. Finally, concrete examples of systems assessment are given.
Chapter 8 concludes with a general discussion of sustainability, climate, and the position of renewable energy technologies in a world dominated by outdated environmental and economic behavior.