Chapter 23. SAP Reporting with Microsoft Access
In this chapter
Maximizing SAP Reports by Using Access 286
Maximizing SAP and Third-Party Solution Reports by Using Access 292
This chapter describes how you can maximize the use of the Microsoft Access application in reporting. This chapter is designed for those who are currently using some form of reporting that they wish to transmit and share with Access for further analysis. You can use this chapter even if you do not create any SAP reports but can execute reports in SAP and have access to Access.
This chapter explains how to use the Access Report Wizard to import and create reports and how to create reports that contain data from SAP combined and merged with data from a third-party solution.
Maximizing SAP Reports by Using Access
Access is a popular software solution used for all kinds of reporting. Access, like other Microsoft products, including Word, Excel, and Outlook, serves as a great complement to SAP R/3 reporting solutions. Access is a common solution used by many organizations that do not know how to create reports using the tools outlined in this book. Because Access is a standard software solution installed on many company computers, and because it is very easy for an end user who has no technical skills to use, it is commonly used for SAP reporting.
I have heard of organizations that run a daily or weekly download of information from their SAP solution, which they import into Access. They then do most of their reporting from Access. Although this may be helpful for organizations that do not know how to create reports in SAP, it does require some considerations, as outlined in the next section.
There are three general reasons why companies use Access in addition to their existing SAP reporting. The first is because Access and its wizards are very user-friendly; any user can follow along and create reports and so on. The second reason has to do with the volume of data: When working with data that is particularly large and cumbersome, it may be more time-efficient to work with that data outside the SAP environment, in Access. Finally, Access gives you the ability to cross-reference data from multiple systems and sources into a single report. An example of this is provided later in this chapter. All in all, Access can be a great complement to your existing SAP reporting solutions.
Considerations When Using Access for SAP Reporting
The dramatic difference between reporting directly within SAP and reporting using Access is based on two factors: security and timeliness. One of the most important considerations when using Access for reporting on SAP data is the appreciation that the data, once in Access, has no security limitations. I know this one sounds like a no-brainer, but sometimes a company does not realize the implications until the solution is in place. When the SAP reporting tools described in this book (and configured using the recommended guidelines) are used, security is not a concern. SAP security identifies who the user is and permits that user to see only the data that he or she is allowed to see (regardless of what type of access the person who created the report had). The concern with extracting your SAP data and placing it in Microsoft Access is that all data is downloaded, and any user can access it when it is outside the SAP R/3 environment.
The second consideration when using Access for SAP reporting is timeliness. This concern is the same with any non-SAP R/3 reporting solution, including Crystal Reports and SAP’s Business Information Warehouse (BIW), where the reporting is first fed to a repository and then reported from. Reporting in this manner, as opposed to online reporting in the SAP Query tool, for example, does not occur in real time. In some cases, reporting does not need to be real-time, so a solution such as Crystal Reports, BIW, or Access would be a good fit.
Where tools such as BIW and Access are really useful is when you want to evaluate data from multiple sources. By using the SAP reporting tools described in this book, you can easily create thorough, detailed reports of data from your SAP R/3 system. However, if you want to report on data from your SAP R/3 solution plus data from an additional system (such as your distribution database), you can do so easily by using Access.
The Fictional SAP Report for a Basic Access Report
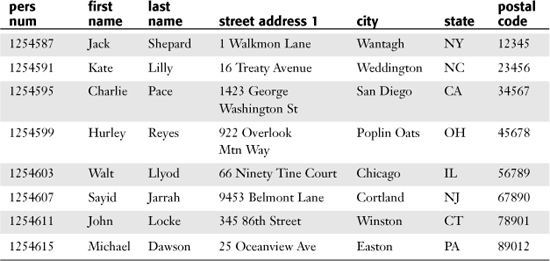
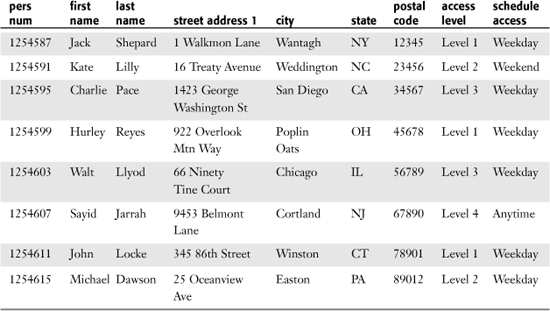
This fictional example uses a basic Human Capital Management (HCM) module report from SAP that contains information about associates, including their names, personnel numbers, and home mailing addresses. Table 23.1 shows a sample of the data in the fictional report.
Table 23.1. Sample SAP HCM Report of Associate Information
Getting Your SAP Report Data into Access
To get SAP report data into Access, follow these steps:
1. Open any report output screen that displays an SAP report. It can be an SAP query, a custom ABAP report, a standard SAP-delivered report, or any other format.
2. You have multiple options for how to get your SAP data into Access, each of which varies depending on your installation version of SAP R/3 and your installation version of Access. Because there are multiple options for different versions, the menu path and buttons vary for each. It is a good idea to save your SAP report output in an Excel worksheet, which you will use as your mail merge data file. The most popular way to do this is to click the Excel button on your report output toolbar. Excel launches and displays the SAP report in an Excel worksheet. Next, save the report in Excel (for example, as c:employee-data_file.xls). Close and exit SAP and Excel.
3. Launch Access and create a new Access database by selecting the white page Create button on the Application toolbar and then selecting the link Create a Blank Database. A dialog box appears, asking you to name and save your database. Name and save your database, using a name such as c:my documentsdatabase1.mdb. Click OK to continue to the main screen of your newly created empty Access database.
4. Import the SAP data into the empty Access database. To do so, select File, Get External Data, Import. A dialog box appears, giving you the opportunity to locate the file you saved in step 2.
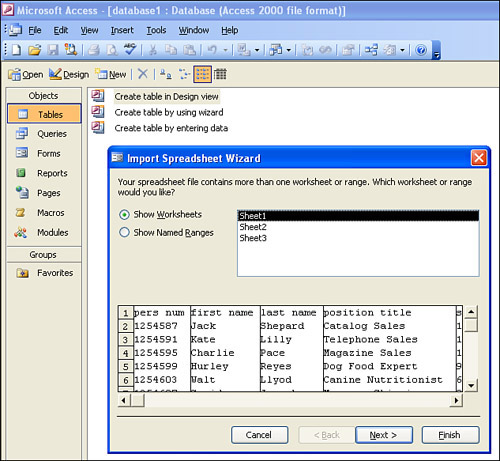
5. Select the file (for example, c:employee-data_file.xls) and then click the Import button. The Import Spreadsheet Wizard appears, to walk you through the import of your SAP data into Access (see Figure 23.1).
Figure 23.1. The Import Spreadsheet Wizard helps you import a data file by allowing you to simply pick and choose the information required.
Helpful Hint
By default, the Import dialog box looks for Access database files only. You need to change the File As Type box at the bottom of the dialog box to Excel Files in order for your file to appear.
6. Look at the list of worksheets on the wizard (for example, Sheet 1, Sheet 2, and so on), and select the worksheet that contains your SAP data (depending on your installed version of SAP and your SAPGUI settings, it may be the last sheet in the list labeled Raw Data). Then click the Next button.
7. In the next screen, select the check box to indicate that your data source contains column headers, and then click the Next button.
8. The next screen has two options: You can either merge the data into an existing table or create a new table. Because this is an empty database that you created from scratch, select the option In a New Table and then click the Next button.
9. On the next screen, specify information about each of the fields you are importing. For example, you can alter the column heading names and select to exclude some columns if you wish. Click the Next button to proceed.
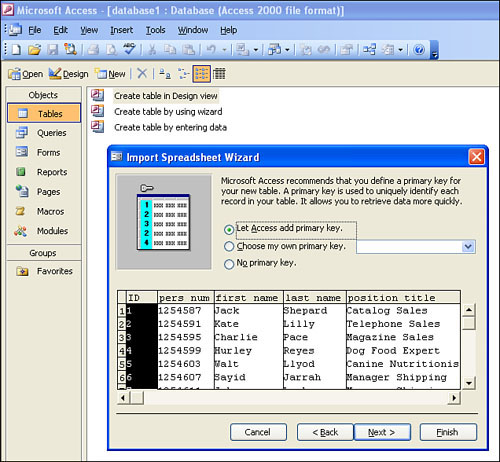
10. When the wizard prompts you to assign or select a primary key, do so. A primary key is a unique record in your data file that distinguishes all the records from each other. For basic SAP reporting, it is sufficient to allow Microsoft to create one for you, which is the default option (see Figure 23.2). Click the Next button to proceed.
Figure 23.2. The Import Spreadsheet Wizard inserts a primary key at the start of your data file that contains a unique number that can be used to make a record in the report unique.
11. Name your table (for example, Employee Address Table) and then click the Finish button. A dialog box appears, indicating that your table was successfully imported.
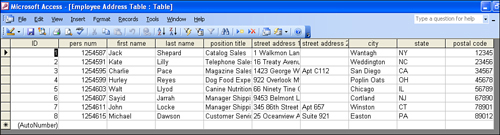
12. Click OK. If you had any errors in importing the data, you are alerted of that at this time. Your database now contains one table called Employee Address Table, which you can view by double-clicking the table name listed on the screen. The table opens on the screen; it looks a good deal like an Excel worksheet, as shown in Figure 23.3.
Figure 23.3. This Access table and the one defined in Table 23.1 at the beginning of this chapter contain the same information.
Using the Access Report Wizard to Create a Report of SAP Data
One of the primary reasons that Access is a popular reporting complement to SAP is its availability to be used by casual users who have no technical skills. Access includes step-by-step wizards that can be used to easily create a variety of reports. To use the Access Report Wizard to create a report with your imported SAP data, follow these steps:
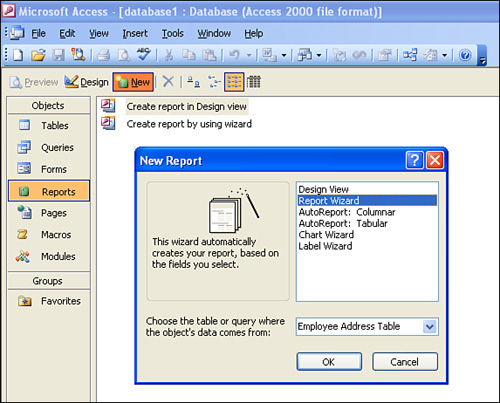
1. Select the link Reports from the menu on the left side of the screen, and then click the New button on the Application toolbar. A New Report dialog box appears.
2. In the New Report dialog box, select the option Report Wizard, and then select your table from the drop-down box at the bottom of the screen (see Figure 23.4). Then click the OK button.
Figure 23.4. The Access Report Wizard makes it easy for end users with no technical training to create reports in Access.
3. The first screen of the Access Report Wizard lists all the fields available in your table and gives you the option of adding some or all of these fields to your report by using the single selection (>) or all selections (>>) field indicators in the middle of the screen. Select all fields and then click the Next button.
4. On the next screen, select grouping levels, if desired, and then click Next.
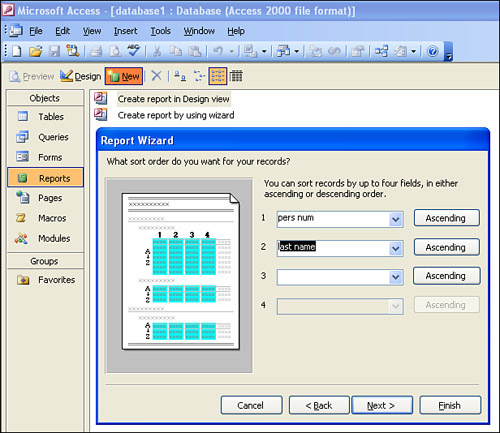
5. On the next screen (see Figure 23.5), indicate your sorting (ascending or descending) preference. For this example, sort on the unique ID key (ascending) followed by the last name field (ascending). Then click the Next button.
Figure 23.5. You have the option to sort in either ascending or descending order for up to four fields in this step of the wizard.
6. On the next screen, specify the layout for your report. In this case, indicate that you want it to appear in landscape orientation and in tabular layout. Then click the Next button.
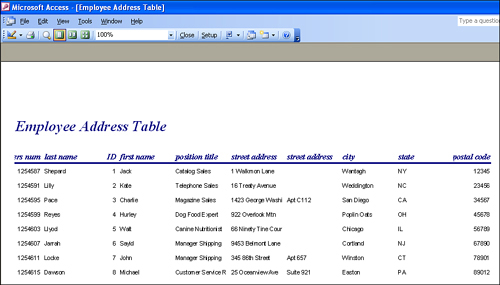
7. The next screen displays at least six different predefined styles for you to choose from for your report. By default, the Corporate format is selected, but you can preview each by selecting it. Click the Next button, change the title of the report, and then click the Finish button to see the finished report (see Figure 23.6).
Figure 23.6. The selected formatting option enhances the look of the report with colors and fonts.
Besides the Report Wizard, Access also has wizards for creating charts, graphs, mailing labels, and so on. To see what other options are available for easy reporting, select the Reports link from the left side of the screen and then click the New button on the Application toolbar. The New Report dialog box appears, listing the various wizards.
Maximizing SAP and Third-Party Solution Reports by Using Access
Creating basic reports, charts, graphs, labels, and so on is easy, thanks to the Access Report Wizard. Using Access with SAP is especially helpful when you want to report on data from two different computer systems. Table 23.1, earlier in this chapter, includes sample data from an SAP HCM system. What if you wanted to create a report with data from SAP plus data from a separate third-party system, such as a building’s security access system? You could do so if both systems shared a common key. The following sections explain how.
The Fictional Data Source for a Third-Party Database
Table 23.1, earlier in this chapter, showed the SAP HCM module report data used in the earlier example. Table 23.2 shows a report run from non-SAP third-party building security software, UCGI Access System. To create a report that contains data from SAP (for example, name and address) plus data from the security system (for example, access level and schedule access), you could use Access.
Table 23.2. UCGI Access System Data (Non-SAP Third-Party Technology)
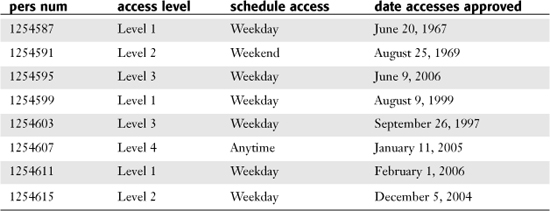
The key requirement for being able to create a report that contains fields from each of these separate databases within the same integrated report is that you have to have a unique common field between the two. You need a field that exists in both data sources, such as pers num, that you can use to link the two sources together. The following sections describe how to create a single Access report that contains integrated data from these two different computer systems.
Getting Third-Party Computer System Report Data into Access
Earlier in this chapter, I explained how to import SAP report data into Access. This example builds on that earlier one. You will be adding additional data to your existing Access database so that you can report on both within the same report. To get your third-party computer solution report data into your existing Access database, follow these steps:
1. Open your third-party computer solution (whatever it may be) and download your report to an Excel file on your computer. Save the file (for example, as c:UCGI_security_file.xls). After saving your report in Excel, close and exit your third-party solution.
2. Launch Access and open the existing Access database you created earlier (that is, c:my documentsdatabase1.mdb). Click OK to continue to the main screen of your Access database, which should now contain at least one table (Employee Address Table, from your SAP system).
3. To bring in your third-party computer system (for example, UCGI) report data that you saved in step 1, select File, Get External Data, Import.
4. In the dialog box that appears, locate the file you saved in step 1 (for example, c:UCGI_security_file.xls). Then click the Import button. The Import Spreadsheet Wizard appears, to walk you through the import of your third-party database data into Access.
Helpful Hint
By default, the Import dialog box looks for Access database files only. You need to change the File As Type box at the bottom of the dialog box to Excel Files in order for your file to appear. The Import Spreadsheet Wizard appears, to walk you through the import of your SAP data into Access.
5. Look at the list of worksheets on the wizard (for example, Sheet 1, Sheet 2, and so on). Select the worksheet that contains your third-party report data, and then click the Next button.
6. In the next screen, select the check box to indicate that your data source contains column headers, and then click the Next button.
7. The next screen has two options: You can either merge the data into an existing table or create a new table. Select the option Place It in a New Table, and then click the Next button.
8. On the next screen, specify information about each of the fields you are importing. For example, you can alter the column heading names and select to exclude some columns if you wish. Click the Next button to proceed.
9. When the wizard prompts you to assign or select a primary key, do so. A primary key is a unique record in your data file that distinguishes all the records from each other. For this basic example, allow Microsoft to create one for you, which is the default option. Click the Next button to proceed.
10. Give your table a name (for example, UCGI Security Access Table) and then click the Finish button. A dialog box appears, indicating that your table was successfully imported.
11. Click OK. If you had any errors in importing the data, you are alerted of that at this time. Your database now contains two separate tables: one called Employee Address Table and another called UCGI Security Access Table.
Creating an Access Query to Link Data from Two Different Computer Systems
This section explains how to combine data from two different tables (from two different database computer sources) into a single report. Using the fictional data sources in Tables 23.1 and Table 23.2 earlier in this chapter, you need to now create a single report that includes data from both, as shown in Table 23.3.
Table 23.3. Sample Combined Report: SAP HR Report of Associate Addresses and UCGI Access System Report of Associate Access Levels
To create an Access query that links data from the two existing tables, follow these steps:
1. Launch Access and open the Access database you created earlier (that is, c:my documentsdatabase1.mdb). Click OK to continue to the main screen of your Access database, which should now contain two tables (Employee Address Table, from your SAP system, and UCGI Security Access Table, from the third-party computer solution).
2. Select the Query navigation tab on the left side of the window, and then click the New button on the Application toolbar.
3. When the New Query dialog box appears, click OK. The dialog box changes to a box labeled Show Table that lists all the tables that exist in the database.
4. Select each table and insert it into your query by clicking the table name and then clicking the Add button. After adding both tables, click the Close button. The screen should now look like the one shown in Figure 23.7.
Figure 23.7. Access links the two tables by the ID field because it has the same name in both tables.
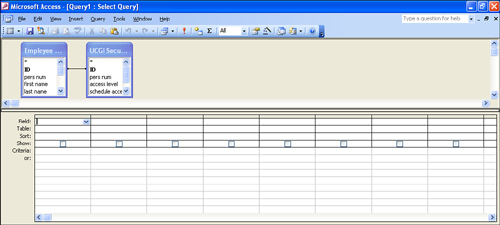
5. Notice that the two tables are linked with a line. Access assumes that because the two tables contain a field called ID, the data in them is the same. As in this situation, that may not always be the case. Select the line between the two fields and then press Delete to delete it.
6. One field in the two tables contains the same data: the pers num field (refer to Tables 23.1 and 23.2). Therefore, you want to create a relationship between the two tables based on the pers num field. To do so, place your cursor on the pers num field in the first table and drag it to the pers num field in the second table. A line linking the two appears.
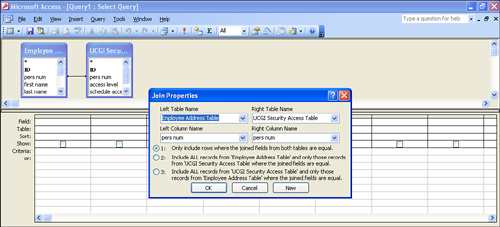
7. Double-click the linking line to see the properties of the join, as shown in Figure 23.8. The default option on the Join Properties screen is the one you want, so click OK.
Figure 23.8. Two tables that contain the same unique value (in this case, pers num) can be joined.
8. Now that the two tables are joined, select the individual fields from the specific tables you want to include in your query (report). You do so by selecting a field from a table at the top of the screen and dragging it to the bottom of the screen.
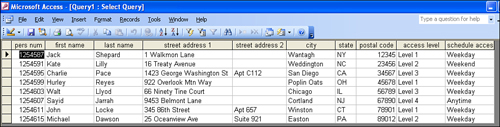
9. To see the finished, combined data source, click the View button (see Figure 23.9). The finished query is shown in Figure 23.10. Click the Save button on the Application toolbar and then give your new query a name (for example, Query 1).
Figure 23.9. The Query Design view in Access lists each table and field name.
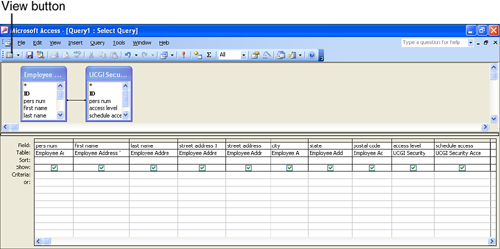
Figure 23.10. The Query Preview view of Access looks the same as a table view in Access.
Using the Access Report Wizard to Create a Report of SAP and Third-Party Query Data
To use a Microsoft Access wizard to create a report with your newly created query that contains data from your two imported tables (from SAP and from the third-party computer system, UCGI), follow these steps:
1. Select the Reports link from the menu on the left side of the screen and then click the New button on the Application toolbar. A New Report dialog box appears.
2. In the New Report dialog box, select the option Report Wizard, and then select your query from the drop-down box at the bottom of the screen. Then click the OK button.
3. The first screen of the Access Report Wizard lists all the fields available in your table and gives you the option of adding some or all of these fields to your report by using the single selection (>) or all selections (>>) field indicators in the middle of the screen. Select the pers num, first name, last name, access level, and schedule access fields, and then click the Next button.
4. On the next screen, select a grouping level, if desired, and then click Next.
5. On the next screen, indicate your sorting (ascending or descending) preference. For this example, sort on the pers num field (ascending) followed by the last name field (ascending). Then click the Next button.
6. On the next screen, specify the layout for your report. In this case, indicate that you want it to appear in landscape orientation and in tabular layout. Then click the Next button.
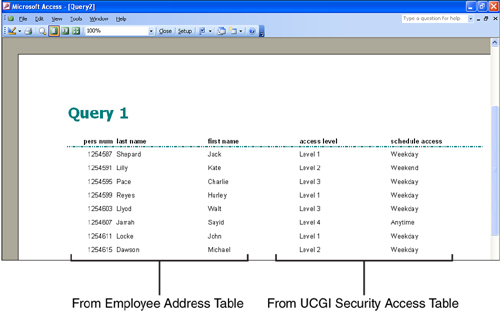
7. The next screen displays at least six different styles for you to choose from for your report. By default, the Corporate format is selected, but you can preview each by selecting it. Select the Casual option and then click the Next button to change the title of the report. Then click the Finish button to see the finished report (see Figure 23.11).
Figure 23.11. Access reports created with the Report Wizard have special formatting and design based on the template selected (in this example, the Casual template).
Things to Remember
• Microsoft Access is a good complement to SAP reporting solutions.
• The menu paths in SAP vary based on your installation versions. However, the ability to download an SAP report from SAP to an Excel file is available in all versions.
• Access is great for combining data from multiple systems into a single report.
• Access can produce mailing labels and charts via the helpful Report Wizard.
• There is no security on data placed in Access, so be sure that any databases that store confidential information are stored on a secure drive.