
Chapter 7. Creating Advanced Reports with the SAP Query Tool
In this chapter
An Overview of the SAP Query Tool’s Advanced Screens 86
Using the Advanced Screens of the SAP Query Tool 86
In Chapter 3, “Creating Basic Reports with the SAP Query Tool,” you learned how to create basic list reports by using the SAP Query tool. This chapter describes how to use the additional screens of the SAP Query tool to perform more advanced functions in SAP query reporting.
Helpful Hint
Although it is recommended that you create SAP query reports live in your production environment, while you are learning, it is important that you practice in your test/quality assurance client so as to not have any impact on your live production environment.
An Overview of the SAP Query Tool’s Advanced Screens
The SAP Query tool, in its standard form, is designed so that an end user who has no technical skills can create a report from scratch. It has five basic screens that you can utilize to create a report. In addition to the five basic screens, seven advanced screens give you more options and functionality when creating reports with the SAP Query tool:
• Control Levels—You use this screen to add subtotals to a report. SAP uses the term control level to indicate subtotals.
• Control Level Texts—You use this screen to change subtotal texts.
• List Line Output Options—You use this screen to format the list line.
• Field Output Options—You use this screen to alter the column widths, add colors, hide leading zeros, and create templates.
• Field Templates—You use this screen to insert text to appear before output for each line.
• Basic List Header—You use this screen to create custom headers and footers.
• Graphics—You use this screen to create graphics (such as charts and diagrams).
Using the Advanced Screens of the SAP Query Tool
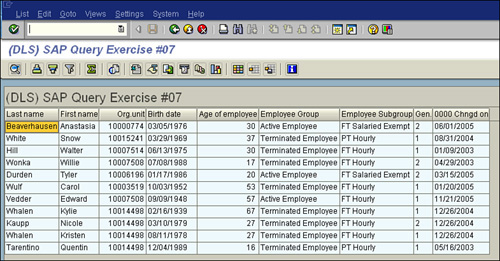
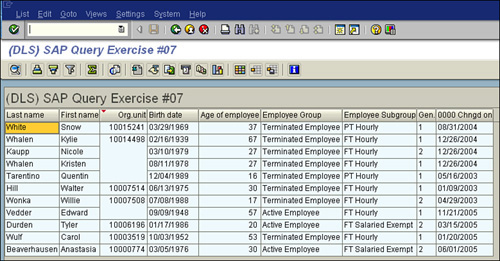
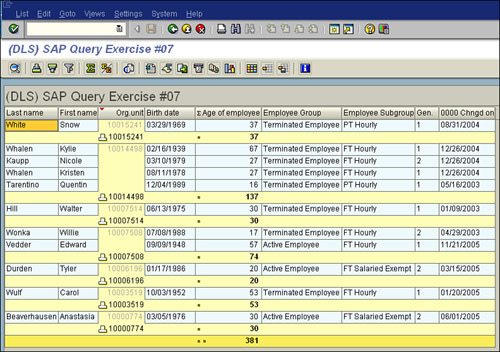
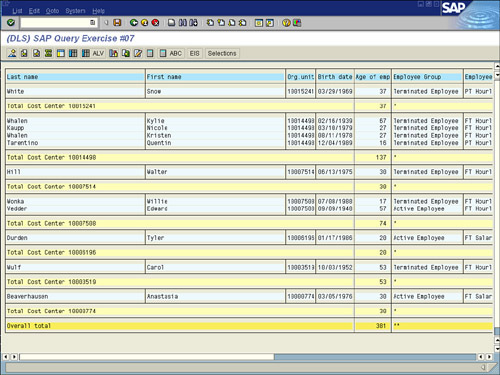
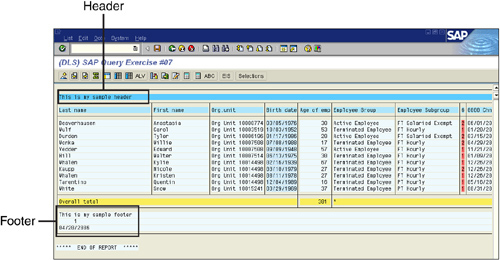
This section explains the functionality available on each of the advanced screens in the SAP Query tool. I’ll use an SAP Human Capital Management (HCM) query report, DLS_Query_07, to display the impact that each of these advanced screens can have on an SAP query report. If you want to follow along on your own system, you can do so by selecting any existing SAP query from your list or creating one from scratch. You will want to have at least a half dozen fields in your output, including a combination of text fields and number fields (for example, Last Name and Age of Employee; see Figure 7.1).
Figure 7.1. A sample SAP query report created in the HCM module of the SAP Query tool.
To navigate to the advanced screens of the SAP Query tool, you begin by navigating to the Queries from User Group: Initial screen by using the transaction code /nSQ01. You select one of your existing queries by selecting the gray tab to the left of the query or by typing the query name into the top of the screen in the SAP Query entry box (for example, DLS_Query_07). Then you click the Change button to get to the first screen of the SAP Query tool (that is, the Title, Format screen). To navigate to the advanced screens, you have a couple of options:
• Click the Basic List button on the Application toolbar and then click the Next Screen button (that is, the white navigational arrow) on the Application toolbar.
• Use the toolbar menu Goto, Basic List and then select one of seven advanced screens to jump directly to it.
Note
In SAP terms, there is no real distinction between basic and advanced screens. I have coined these terms to make it easier for you to implement, teach, and use the SAP Query tool at your organization. After years of teaching the SAP Query tool, I found that it was helpful for users to first learn and master the five basic screens before moving on to these screens.
The Control Levels Screen
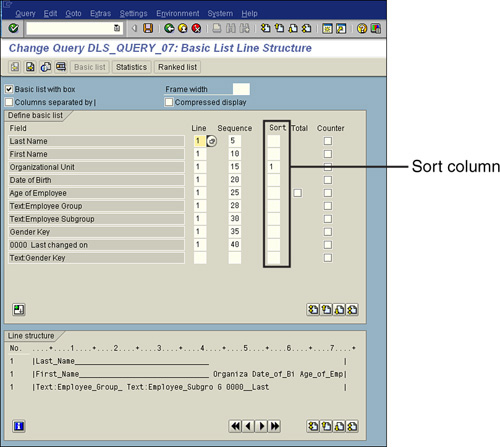
The Control Levels screen appears only if you indicated sorting information in the Sort column on the Basic List Line Structure screen for your field output, as shown in Figure 7.2.
Figure 7.2. The Sort column on the Basic List Line Structure screen requires the input of at least one sort in order for the Control Levels screen to appear.
To use the Control Levels screen, follow these steps:
1. Navigate to the Queries from User: Group Initial screen by using the transaction code /nSQ01. Identify an existing query that you want to work with and then click the Change button.
2. Click the Basic List button on the Application toolbar to navigate to the Basic List Line Structure screen. On this screen, make sure a value is present somewhere in the Sort column (most appropriately on a field that you want to sort or group on). For example, Figure 7.2 shows a sort based on the Organizational Unit field. Click the Save button on the Application toolbar.
3. On the Basic List Line Structure screen, you click the Next Screen button on the Application toolbar. As shown in Figure 7.3, the Control Levels screen indicates any field that was specified as a sort on the Basic List Line Structure screen. For example, Figure 7.3 displays the Organizational Unit field. (Note that if more than one field was indicated as a sort, they would all be listed on this screen.)
Figure 7.3. This advanced screen provides subtotaling and formatting options for any fields indicated on the previous screen as sorting criteria.
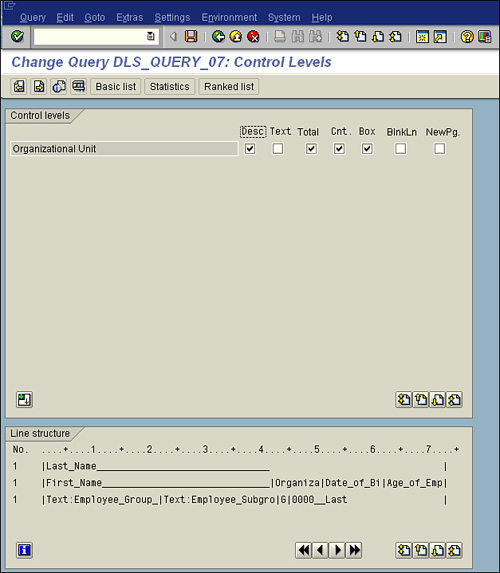
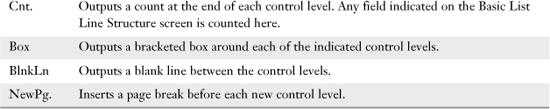
4. The Control Levels screen provides options for formatting subtotals. Using Table 7.1 as a reference, vary the input on your screen (in my example, I selected the Desc, Total, Cnt, and Box check boxes).
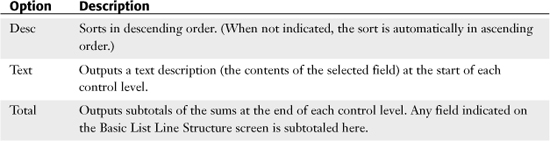
Table 7.1. Options on the Control Levels Screen
5. To execute the report and view the selection screen, press F8. To see the finished report, click the Execute button on the Application toolbar (or press F8). Figure 7.4 shows the impact of these changes to a sample report.
Figure 7.4. Based on the selections used in my example, the report output appears sorted.
The Control Levels screen has the seven options described in Table 7.1.
Modifying the Output Format to Vary the Look of a Finished Report
It is important to note that the look and formatting of a finished SAP query report varies based on the type of selected output indicated on the report’s selection screen. That might sound confusing, but recall from Chapter 5, “Basics of Using Reporting Selection Screens,” that multiple report output formats are available to select from. The default output format listed on the selection screen for SAP queries is SAP List Viewer. (See the section “Understanding Output Options on the Selection Screen” in Chapter 5 for more information.) What is important to note is that your finished report output format may vary based on the output format you selected on the report’s selection screen.
To make it even more confusing, not all output formats are compatible with each of the options when displayed onscreen. Here is a real-world example: If you compare Figure 7.3 (which shows the selections I indicated on the Control Levels screen) against Figure 7.4 (which shows the report output), you will notice that even though I indicated that I wanted a total and a count for each of the subtotaled organizational units, my finished report did not include them. Rather, the finished report, shown in Figure 7.4, only groups the organizational units in descending order. (To see the change, compare Figure 7.1 against Figure 7.4.)
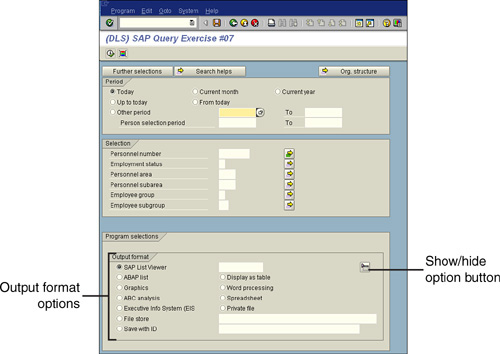
The default output format, SAP List Viewer, displays data in a spreadsheet format. However, you can easily change the report output format on your selection screen from SAP List Viewer to any of the other available options. Figure 7.5 shows the list of options.
Figure 7.5. If the output format options are not displayed on the selection screen, you can click the small arrow button to the right of the SAP List Viewer option.
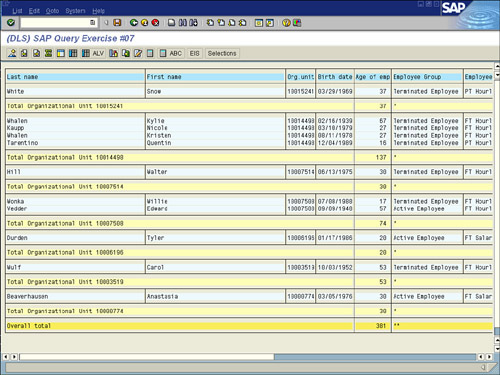
In addition to the output format options having an impact on the report output, another field on the Basic List Line Structure screen has an impact on the look of the finished report: Total. For my example, I will navigate to the Basic List Line Structure screen and indicate that I want to have a total for my Age of Employee field (see Figure 7.6). Indicating the Total box to the right of the Age of Employee field (as it is the only truly numeric field in the report) will change my report output from what was displayed in Figure 7.4 to appear like the formatted sample shown in Figure 7.7.
Figure 7.6. The Total field will only appear for any numeric field that can be mathematically totaled.
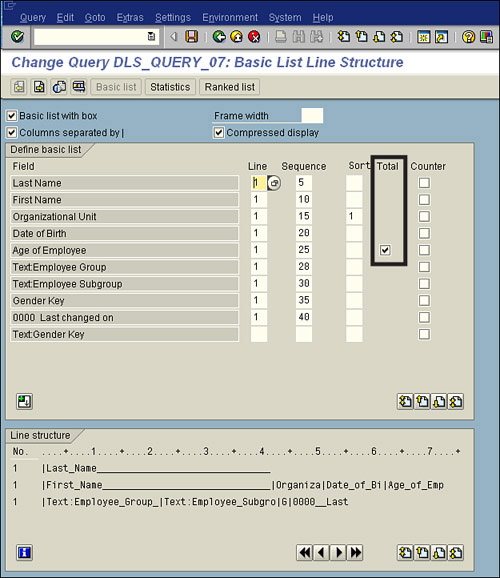
Figure 7.7. The indication to include a total in the report changes the format of the report output dramatically.
Now is a good time to vary the input on the Control Levels screen and change the output format selections on your selection screen to see the impact each modification makes when the report is viewed in different outputs. For example, you can change the report Output format from SAP List Viewer to ABAP List. The resulting report data appears in Figure 7.8.
Figure 7.8. The ABAP List view removes any special table or Excel-like formatting from the report.
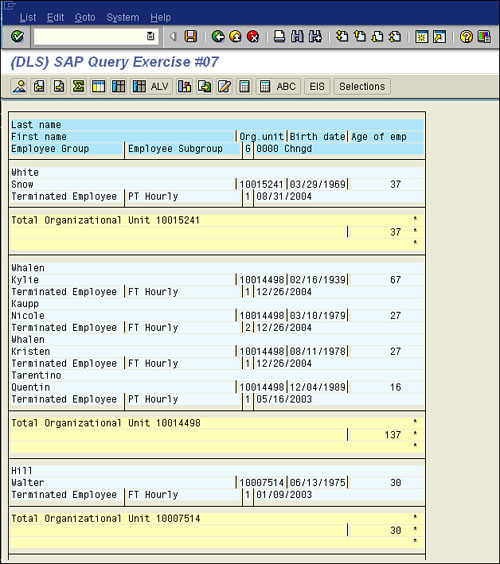
When you view this report in ABAP List view, you see that additional functions appear, including the counts and the control level texts. However, the text wraps on to the second line, and the report appears garbled. When a report is displayed onscreen in the ABAP List Output format, it often wraps the characters across lines based on the default paper size for printing in SAP. The most common is letter-size paper, and with that, the default column width setting is 83. (In other words, it will only display 83 characters of the first line before it wraps it to the second line.) If you want to expand that setting, you can go to the Title Format screen and vary the default width of the report by using the Column field, which drives the number of characters across the page. Figure 7.9 shows what the screen looks like if you change this setting from the default of 83 to 255 (the maximum for letter-size printing).
Figure 7.9. Altering the column width for the report and then changing the output format to ABAP List makes your special indicated formatting appear.
Helpful Hint
When displaying a format in the ABAP List view, it is a good idea to return to the Basic List Line Structure screen and select the check box Columns Separated by |. Doing so makes your report output appear more formatted, with boxes around each column of data.
The Control Level Texts Screen
The Control Level Texts screen appears only if you indicated sorting information in the Control Level screen because this advanced screen gives you the opportunity to modify any of your subtotal heading, which SAP refers to as control levels.
To navigate to the second of the advanced screens, the Control Level Texts screen, you click the Basic List button on the Application toolbar and indicate at least one sort option (for example, Text:Gender Key). On the Basic List screen, you click the Next Screen button on the Application toolbar two times to navigate to the Control Level Texts screen. The Control Levels screen, as shown in Figure 7.3, indicates any field that is specified as a sort on the Basic List Line Structure screen. The Control Level Texts screen appears only if you indicate sorting information in the Sort column on the Basic List Line Structure screen, and if you indicate selections on the Control Levels screen. The Control Level Texts screen allows you to vary the text that appears at each control level (see Figure 7.7).
To use the Control Levels screen, follow these steps:
1. Navigate to the Queries from User: Group Initial screen by using the transaction code /nSQ01. Identify an existing query that you want to work with and then click the Change button.
2. Click the Basic List button on the Application toolbar to navigate to the Basic List Line Structure screen. On this screen, make sure that a value is present somewhere in the Sort column (most appropriately on a field that you want to sort or group on). Click the Next Screen button on the Application toolbar to confirm that at least one entry exists on the Control Levels screen, as shown in Figure 7.10.
Figure 7.10. The section labeled Standard Texts at the top of the screen shows the subtotal texts as they appear before changes.
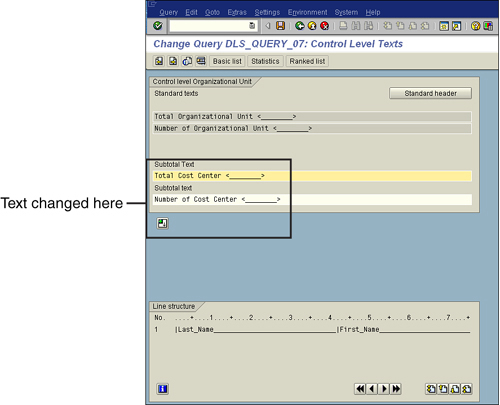
3. Vary how the subtotals appear by changing the text on this screen from the default (which is shown at the top). For example you could replace the words on the bottom half of the screen under the heading Subtotal Text from Organizational Unit to Cost Center. You should leave the field placeholders (<________>) intact so that SAP knows where the data should be output.
4. To execute the report and view the selection screen, press F8. To see the finished report, click the Execute button on the Application toolbar (or press F8). Figure 7.11 shows the impact of these changes to a sample report; you can compare it to Figure 7.9 to see the changes.
Figure 7.11. For this example, the report is output in the ABAP List view, and the text for each control level is different than it was in Figure 7.9.
At any time, you can return to the Control Level Texts screen and click the Standard Header button to return the control level texts to their original state.
Note
It is important that you not type over the placeholders on the Control Level Texts screen. For example, note that Figure 7.10 shows only the text to the left of the placeholder (indicated as <___________________>) replaced. Overwriting that placeholder would interfere with the report output. It is import that when you use this screen, you toggle between Insert and Overwrite modes by pressing the Insert key on your keyboard. If you accidentally overwrite the placeholder, you can simply click the Standard Header button and then press the Insert key and try it again.
The List Line Output Options Screen
The List Line Output Options screen provides options for varying the output of the entire report list. In the examples included in this book so far, only a single list has been produced for each report. (List, in this case, is a collective term to describe the entire report output.) In Chapter 14, “Creating Ranked Lists with the SAP Query Tool,” you will learn how to create multiple-line lists. To use the List Line Output Options screen, follow these steps:
1. Navigate to the Queries from User: Group Initial screen by using the transaction code /nSQ01. Identify an existing query that you want to work with and then click the Change button.
2. Click the Basic List button on the Application toolbar to navigate to the Basic List Line Structure screen. On this screen, make sure that the check box at the top-left side of the screen, labeled Basic List with Box, is checked.
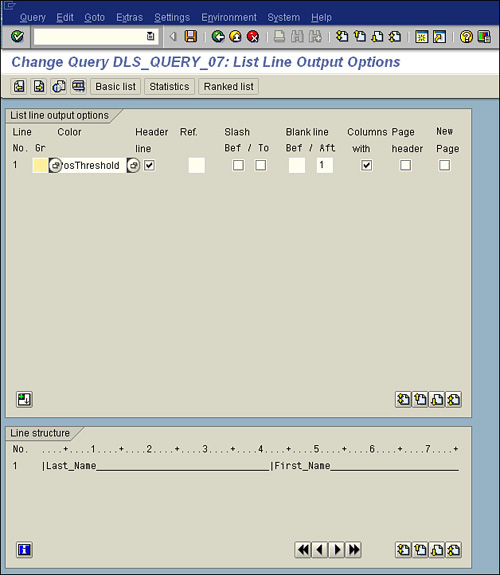
3. On the Basic List Line Structure screen, select Goto, Basic List, Line Output Options to navigate to the List Line Output Options screen (see Figure 7.12). Alternatively, you can use the Next screen arrows on the Application toolbar for navigation. The List Line Output Options screen applies to the actual line items; a list line appears on this screen for any list line number indicated on the Basic List Line Structure screen. Most reports contain all report output on only one line across the top of the page because the Line box next to each of the fields in the Basic List Line Structure screen contains 1. For any SAP query report where multiple lines are indicated on the Basic List Line Structure screen, multiple lines will also be present on the List Line Output Options screen.
Figure 7.12. The List Line Output Options screen applies to the actual line items—lines in the report that are not headers or control-level text.
4. Using Table 7.2 as a reference, vary the input on your screen.
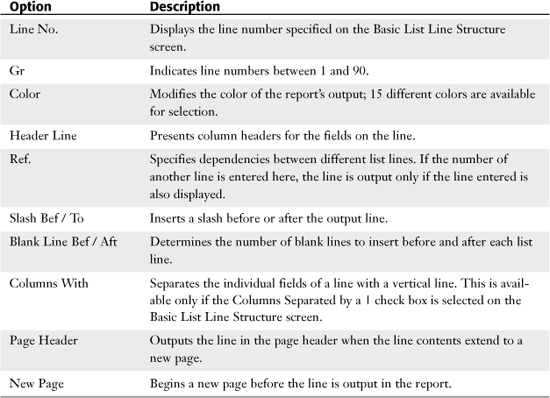
Table 7.2. Options on the List Line Output Options Screen
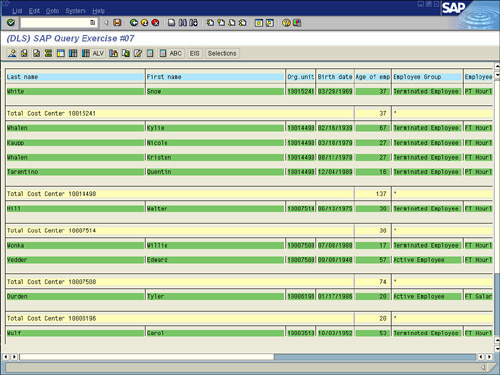
5. To execute the report and view the selection screen, press F8. To see the finished report, click the Execute button on the Application toolbar (or press F8). Figure 7.13 shows the impact of these changes to a sample report.
Figure 7.13. The report appears with a single space between lines, and the line color has been changed to deep green (PosThreshold).
The List Line Output Options screen has the ten options outlined in Table 7.2.
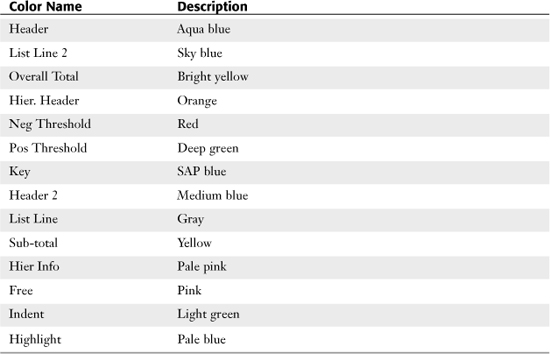
In my example, I indicated the color deep green for my report list, which has the technical name PosThreshold. Within SAP, each color is referred to by its standard placement within the system. For example, headers are usually displayed in aqua blue. So if you are looking to select a color in SAP for any reason, you need to select the color by using its technical name. Table 7.3 provides a reference of the technical names and the colors that they represent in SAP.
Table 7.3. Available Colors in the SAP Query Tool
The Field Output Options Screen
The Field Output Options screen provides options for varying the output of individual columns within a report. Unlike the List Line Output Options screen, which provides options for the entire list line, the Field Output Options screen provides options to vary each individual field in the report output. To use the Field Output Options screen, follow these steps:
1. Navigate to the Queries from User: Group Initial screen by using the transaction code /nSQ01. Identify an existing query that you want to work with and then click the Change button.
2. On the Basic List Line Structure screen, select Goto, Basic List, Line Output Options to navigate to the Field Output Options screen. (Alternatively, you can use the Next screen arrows on the Application toolbar for navigation.) The Field Line Output Options screen applies to the individual columns within the report. The screen should appear similar to the Basic List Line Structure screen.
3. Using Table 7.4 as a reference, vary the input on your screen. (See Figure 7.14.) Click the Save button on the toolbar.
Table 7.4. Options on the Field Output Options Screen
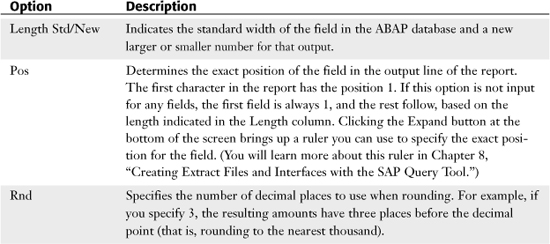
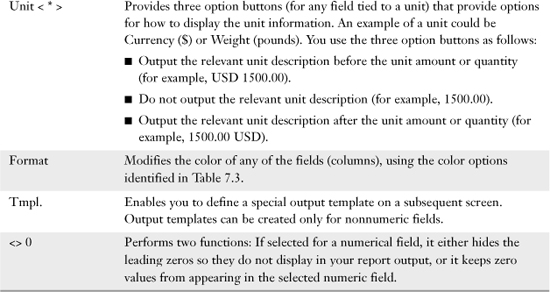
Figure 7.14. Unlike the List Line Output Options screen, which provides options for the entire list line, this screen provides options to vary each individual field in the report.
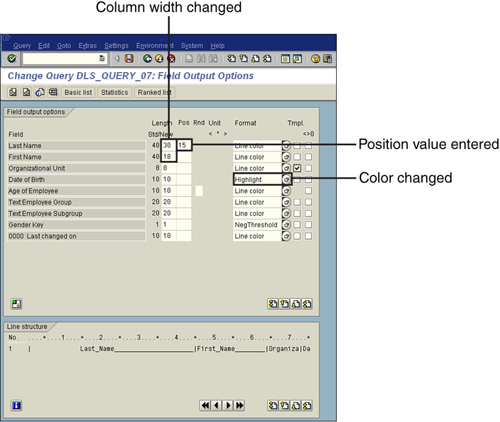
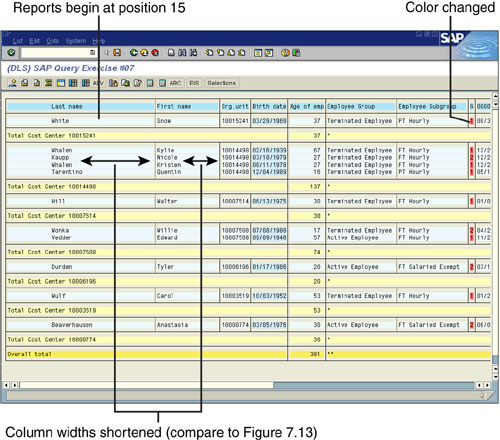
4. To execute the report and view the selection screen, press F8. To see the finished report, click the Execute button on the Application toolbar (or press F8). Figure 7.15 shows the impact of these changes to a sample report.
Figure 7.15. Varying the column widths by using the length function allows you to fit more information on a report.
The Field Output Options screen provides the seven options described in Table 7.4.
Keep in mind that the output of the selections on the executed report may vary based on the type of output selected on the report’s selection screen. For the example shown in Figure 7.15, Figure 7.12 shows the impact on the executed SAP query report output in ABAP List Output view. (It is also important to note that if you are cumulatively working on these advanced screens using the same SAP query report, changes from previous screens also appear.)
Helpful Hint
Setting a field as a template includes formatting characters in a field. (For example, you can insert the word UNIT before a unit description is output.) You set the template specifications on the Field Templates screen.
It is important to note that the length of the field (column) is automatically increased according to the number of formatted characters introduced. For example, specifying that the word UNIT should appear in the column with the unit description would increase the Length New column by 4. However, a best business practice is to also insert a space after such text, so the value increases by 5. Otherwise, the output appears as UNIT12345 Unitname instead of UNIT 12345 Unitname.
The Field Templates Screen
The Field Templates screen works similarly to the Control Level Texts screen in that you can insert data to appear before report output. To use the Field Templates screen, follow these steps:
1. Navigate to the Queries from User: Group Initial screen by using the transaction code /nSQ01. Identify an existing query that you want to work with and then click the Change button.
2. On the Basic List Line Structure screen, select Goto, Basic List, Line Output Options to navigate to the Field Output Options screen. (Alternatively, you can use the Next screen arrows on the Application toolbar for navigation.)
3. On the Field Output Options screen, you need to mark the Template check box for at least one field in order for the Field Templates screen to be available. In my example, I have indicated that the Organizational unit field will have a template (see Figure 7.14).
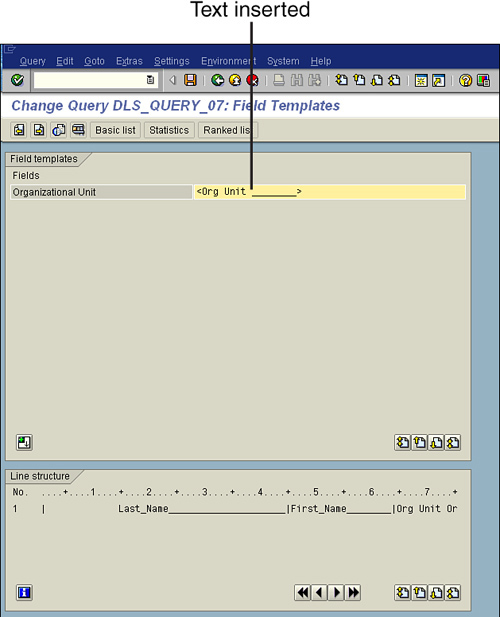
4. Use the forward arrow navigational button to proceed to the Field Templates screen. You can insert text to appear before or after the field indicated as a template. In my example, the Organizational Unit field is the template field, and I inserted the text Org Unit to appear before the output of each organizational unit number. I left the < placeholder in place, and I typed my template wording into the space between it and the > (see Figure 7.16).
Figure 7.16. The Field Templates screen works similarly to the Control Level Texts screen in that you can insert data to appear before report output.
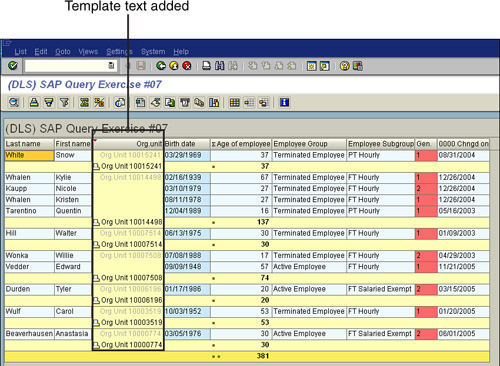
5. To execute the report and view the selection screen, press F8. To see the finished report, click the Execute button on the Application toolbar (or press F8). Figure 7.17 shows the impact of these changes to a sample report.
Figure 7.17. The text Org Unit appears before the output of each organizational unit number in the report.
The difference between the Field Templates screen and the Control Level Texts screen is that on the Field Templates screen, you can insert data to appear before any column in the report, and on the Control Level Texts screen, you can vary only the subtotal and grand total (control levels) texts.
It is important that you not type over the placeholders on the Field Templates screen. For example, note that Figure 7.16 shows text inserted only to the left of the placeholder, with no tying over the existing spaces (indicated as ___________________>). Overwriting those spaces would interfere with the report output.
The width of the placeholder is determined by the ABAP Data Dictionary and matches the Std Length column on the Field Output Options screen. For example, Figure 7.16 shows Org Unit so that this exact text appears in the report output.
The Basic List Header Screen
The Basic List Header screen allows you to insert custom headers and footers in a SAP query report. To use the Basic List Header screen, follow these steps:
1. Navigate to the Queries from User: Group Initial screen by using the transaction code /nSQ01. Identify an existing query that you want to work with and then click the Change button.
2. On the Basic List Line Structure screen, select Goto, Basic List, Line Output Options to navigate to the Field Output Options screen (see Figure 7.18). (Alternatively, you can use the Next screen arrows on the Application toolbar for navigation.)
Figure 7.18. Custom headers and footers often do not display in reports that are viewed onscreen in SAP List Viewer output format.
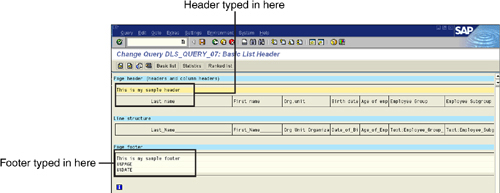
3. The Basic List Header screen allows you to insert custom headers and footers. Using Figure 7.18 as a reference, vary the input on your screen by simply typing text into the provided fields. To insert an additional line under the current line of the header or footer, double-click the line. In my example, I added both a custom header and footer.
4. To execute the report and view the selection screen, press F8. To see the finished report, click the Execute button on the Application toolbar (or press F8). Figure 7.19 shows the impact of these changes to a sample report.
Figure 7.19. Custom headers and footers appear on any hard copy printouts of the report as well as onscreen.
You can also use SAP ABAP code to indicate custom system fields so that the report automatically inserts the current date, time, page number, and so on. To do so, you simply input &%DATE, &%USER, and so on, and when the report is executed, it updates with the correct information (refer to Figure 7.19).
Again, it is important to note that the output of the selections on the executed or printed report may vary based on the type of output that is selected on the report’s selection screen.
The Graphics Screen
The Graphics screen gives you the opportunity to use SAP Business Graphics to display a SAP query report graphically. To use the Graphics screen, follow these steps:
1. Navigate to the Queries from User: Group Initial screen by using the transaction code /nSQ01. Identify an existing query that you want to work with and then click the Change button.
2. On the Basic List Line Structure screen, select Goto, Basic List, Line Output Options to navigate to the Field Output Options screen (see Figure 7.20). (Alternatively, you can use the Next screen arrows on the Application toolbar for navigation.)
Figure 7.20. You can use SAP Business Graphics to display appropriate numeric SAP queries in a graphical format.
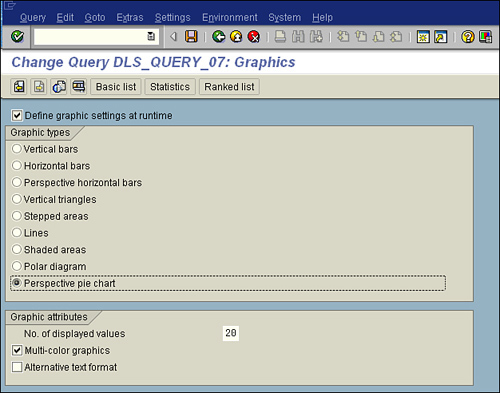
3. Select a graphic format (for example, perspective pie chart) and then click the Execute button.
4. On the report’s selection screen, change the report output format to Graphics at the bottom of the screen in order to display your report graphically. Then click the Execute button on the Application toolbar (or press F8).
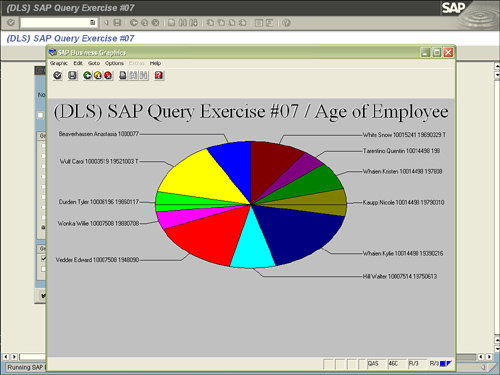
5. A Graphical Display dialog box appears. Click the green checkmark Enter key. Your finished graphical report appears onscreen, charting the figures interpreted by the SAP system (see Figure 7.21).
Figure 7.21. Pie charts, columnar graphs, and other graphical formats are available on the Graphics screen.
Things to Remember
• The look of the advanced screen report varies depending on the output format selected on the report’s selection screen.
• The Control Level screen allows you to do sorting and subtotaling, and it also lets you do special formatting in a SAP query report for any field that you indicate to sort on the Basic List Line Structure screen.
• By using the advanced screens, you can manipulate the colors and texts of list lines or individual fields in a report.
• You can use special symbols to insert the current date, time, username, and page number in custom headers and footers.
• Graphical reporting is possible via the advanced screen, but you need to be sure to indicate Graphics and the format output on the report’s selection screen.