
Chapter 12. Creating Simple Statistics Lists with the SAP Query Tool
In this chapter
Statistics Lists in the SAP Query Tool 158
Creating a Statistics List with the SAP Query Tool 159
Creating a Subtotaled Statistics List with the SAP Query Tool 165
Earlier chapters described how to maximize the use of the SAP Query tool to create basic lists (that is, simple column-based lists). This chapter discusses simple statistics lists.
You can create three types of reports by using the SAP Query tool: basic lists, statistics lists, and ranked lists. The most common type of SAP report is a basic list report. The data displayed in a basic list report has not been auto-summarized to display summary detail only. Generally speaking, the data is displayed as it appears in the R/3 database. In contrast to basic lists, the data in statistics and ranked lists is output in a compressed, summarized format.
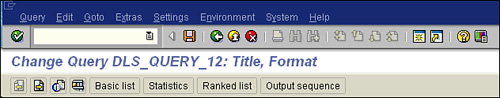
You can create basic list query-based reports by using the steps covered in earlier chapters. When creating statistics list or ranked list reports, the main difference is that instead of selecting the Basic List button to proceed to the Basic List Line Structure screen, you select either the Statistics button or the Ranked List button on the Application toolbar (see Figure 12.1).
Figure 12.1. You navigate to the appropriate query screen by clicking the correct button on the Application toolbar.
Statistics Lists in the SAP Query Tool
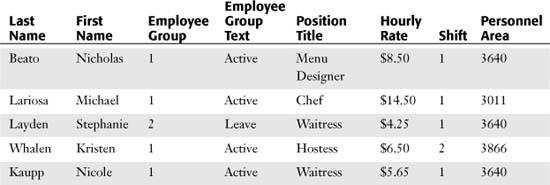
Statistics lists allow you to produce summary analyses of data, including totals and averages. Statistics lists are similar to pivot tables in Microsoft Excel. To give you a better understanding of what a statistics list is all about, Table 12.1 shows an example of a basic list report from the HCM module that contains a report of some of the associates in the Mama Tricarico’s company, used in earlier examples. This chapter compares this basic list to a statistics list to show the difference between the two.
Table 12.1. Day Shift Associates of Mama Tricarico’s in SAP HR Module in Basic Report List
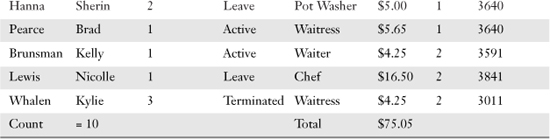
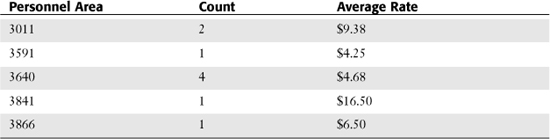
Using this report as an example, you can create a statistics list that summarizes the information. For example, you can create a statistics list that shows the average hourly rate for each personnel area (see Table 12.2).
Table 12.2. Statistics List Example
Creating a Statistics List with the SAP Query Tool
As discussed in Chapter 3, “Creating Basic Reports with the SAP Query Tool,” creating basic lists with the SAP Query tool involves five basic screens. To create a statistics list, you follow the same steps, except that instead of clicking the Basic List button on the Selections screen, you click the Statistics button instead to bring up the Statistics Structure screen instead of the Basic List Structure screen.
To create a statistics list report by using the SAP Query tool, follow these steps:
1. Navigate to the Maintain Queries Initial screen by using transaction code /nSQ01.
2. Ensure that you are in the standard query area by selecting Environment, Query Areas and then choosing Standard Area (Client-Specific).
3. In the Query field, enter a name for the query you are creating (for example, DLS_Exercise_12, where DLS is your initials) and then click the Create button.
4. When the InfoSets of User Group ZTEST window appears, listing all the available InfoSets (that is, data sources) for your query group, select the ZTEST InfoSet and then press Enter. The Create Query Title Format screen appears, allowing you to save the basic formatting specifications for your query, including the name (title) and any notes you want to store for the query. The only required field is Title. Click the Save button on the toolbar.
5. Click the Next Screen button on the Application toolbar to navigate to the Select Field Group screen.
6. When the Select Field Group screen appears, listing all the field groups available in your InfoSet, place a check mark next to each field group whose fields you want to include in your report. (In my example, I selected all of them.) Click the Next Screen button on the Application toolbar.
7. When the Select Fields screen appears, giving you a list of all the available fields within the selected field groups, place a check mark next to each field that you want to include in your report. You can use the Page Up and Page Down buttons to navigate between all the fields. For this example, include the following fields:
• Airline Carrier ID
• Arrival City
• Airfare
• Text: Flight Class
8. Click the Next Screen button on the Application toolbar to continue. The Selections screen appears, listing all the fields you selected on the Select Fields screen, giving you the opportunity to add fields to your report’s selection screen.
9. Add to your report’s selection screen any fields you want by placing a check mark next to each field.
10. Click the Statistics button on the Application toolbar to create a statistics list in the SAP Query tool. The Statistics Line Structure screen appears, giving you an opportunity to define your compressed list report (see Figure 12.2).
Figure 12.2. When creating statistics lists, you use the Statistics Line Structure screen to define the layout.
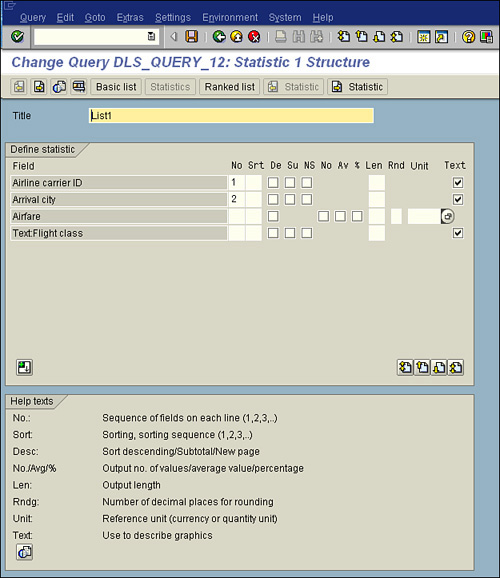
11. Use the Statistics Line Structure screen to dictate how you want your report to appear, including sequence and summing specifications. You determine the statistics in this series of screens. Each statistic must have its own unique title, because you might generate several statistics. The details of the options for this screen are listed in the following section.
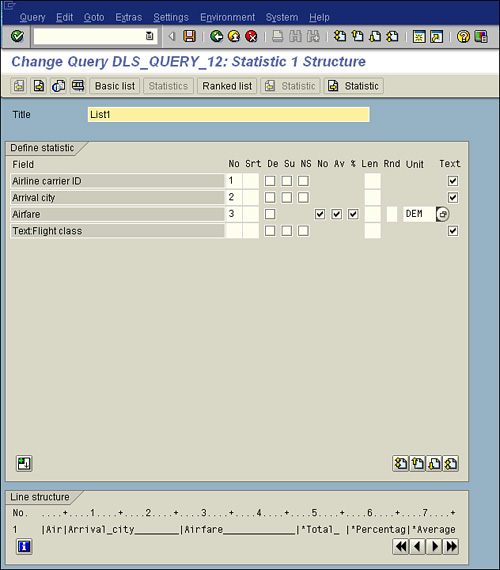
12. Specify the sequence in which you want to output the fields, and state whether you want them to be sorted in ascending or descending order, using Figure 12.3 as a reference. Totals are always calculated for numeric fields. You can therefore determine average values, the number of selected records, and the percentage share.
Figure 12.3. After you create a statistics list, the toolbar has a Next Statistic button that allows you to create multiple statistics.
13. Press F8 to execute the report. As with almost all other reports in SAP, upon execution, you see the report’s selection screen. The selection screen gives you an opportunity to specify any criteria for the output of your report. Notice that any fields indicated on the Selections screen are included on your selection screen, under the heading Program Selections.
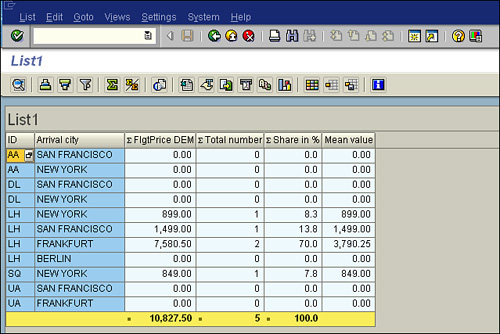
14. Click the F8 Execute button on the Application toolbar to display your finished report. Your report output should look similar to that in Figure 12.4, but keep in mind that the actual values vary by organization.
Figure 12.4. If you are using currency conversions, after the statistics, you see an overview that states which currency conversions were performed, as well as the date and exchange rate on which the conversions were based.
Helpful Hint
You can use the Next Statistic button to create an additional statistic for the same query. You can define up to nine statistics for each query.
Details of the Options Available on the Statistics Structure Screen
The following sections describe the options that are available on the Statistics Line Structure screen (refer to Figure 12.2) of the SAP Query tool.
Title
This entry field allows you to enter a name for your first list. This title is used as the list header.
Field
All fields selected during the report creation process are listed here.
No (Sequence Number)
This column defines the sequence of fields within a statistic. You can assign sequence numbers between 1 and 98. When you define a statistic, the data is usually summarized (that is, several data records are processed to determine one line). With numeric fields, only the total is output.
Note
Statistics that do not contain numeric fields do not make sense, because there is no data summarization.
No (Sequence)
This column defines the sort sequence in the statistic. You assign a sequence number for sorting to every field on which you want to sort. The highest sort criterion must have the lowest sequence number, the next sort criterion a higher sequence number, and so on. It makes sense to assign the sequence numbers starting with 1 and in ascending order, without breaks (that is, the highest sort criterion should receive number 1), but this is not required.
De (Descending)
You can select this check box to sort the field in descending order.
Su (Subtotal)
If you select this field, ABAP/4 Query generates subtotals for the sort criterion in the statistic. (That is, whenever the sort criterion changes, a line containing the relevant subtotals is output.) If you want to calculate subtotals for a field (sort criterion) in a statistic, you should be aware of three conditions:
• You can only use sort fields.
• You must already have defined a sort for fields in the statistic, and the sort sequence must be in ascending order.
• The sort numbers of any fields following a field defined for sorting cannot be smaller than the sort number of the field itself.
Thus, if you want to generate a subtotal for the third field (Sequence Number 3), you must sort by this field and by both preceding fields. Because the sort sequence must also be in ascending order, the first field must have the sort number 1, the second field the sort number 2, and the third field the sort number 3. For example, you cannot calculate subtotals if the first field (Sequence Number 1) of a statistic has the sort number 2 and one of the following fields has the sort number 1. In that case, no subtotals can be calculated for any of the fields—not even the first.
NS (Page Break)
When you select this field, page breaks are inserted in your statistic for each sort string; that is, each time the sort string changes, a new page is displayed. To use this page break function for a particular field, three conditions must be met:
• Page breaks can only be generated for sort fields.
• Page breaks can only be created for a field if its preceding fields in the statistic are also sort fields and the sort order of these fields is ascending.
• No sort fields with sort numbers smaller than the sort number of the field in question may follow a field for which page breaks have been set.
For example, if you want to insert page breaks for Field Number 3 (Position 3 in the sort sequence), this field and both of the fields preceding it must be sort fields (that is, the system must sort according to them). Because the sort order must be ascending, the first field must have sort number 1, the second field sort number 2, and the third field sort number 3. In the example described in this chapter, you may not display with page breaks. If the first field contained in the statistic (Sequence Number 1) has sort number 2 and one of its subsequent fields has been assigned sort number 1, page breaks may not be displayed for any of these fields—not even for the first one.
No (Display)
This field is for retrieval of information about processed data records. This field appears only for fields in the database that are tied to numbers (for example, Currency is tied to a currency code such as USD. 1).
Suppose you want to create a country sales statistic, and you choose the fields Country UD and Sales. If you want to see the total sales for each country, you simply select the column Display for the field Sales.
Av (Average)
If you select this field, an average value is calculated for the field entered on the left for the individual summands.
% (Percentage)
If you select this field, the percentage of the field of the sum total is output.
Len (Length)
When you select this check box, the field is output in the list with its standard output length. You can alter the field width (length) in this field to improve the layout of a list.
Rnd (Rounding Factor)
You use this field to specify the number of decimal places to be used when rounding. For example, if you specify 3, the resulting amounts have three places before the decimal point (that is, round to the nearest thousand).
Init (Unit of Measurement)
This field appears for any field tied to a unit of measurement (for example, currency, weight).
Text
If you select this field, the values of the field specified on the left are used to generate the text for SAP Business Graphics. If you select several fields, their values are used in the sequence in which they occur. SAP Business Graphics processes up to 30 characters of text per value.
Creating a Subtotaled Statistics List with the SAP Query Tool
To create a subtotaled statistics list report with the SAP Query tool, follow these steps:
1. Navigate to the Maintain Queries Initial screen by using transaction code /nSQ01.
2. In the Query field, enter a name for the query you are creating (for example, DLS_Exercise_12B, where DLS is your initials) and then click the Create button.
3. When the InfoSets of User Group ZTEST window appears, listing all the available InfoSets (that is, data sources) for your query group, select the ZTEST InfoSet and then press Enter. The Create Query Title Format screen appears. Enter a title and then click the Save button on the toolbar.
4. To navigate to the next screen in the SAP query creation process, click the Next Screen (white navigational arrow) button on the Application toolbar. The Select Field Groups screen appears, listing all the field groups available within the InfoSet. Place a check mark next to each field group from which you want to include fields in your report (I selected them all). Click the Next Screen button on the Application toolbar.
5. When the Select Fields screen appears, listing all the available fields within the selected field groups, place a check mark next to each field that you want to include in your report. You can use the Page Up and Page Down arrows to navigate between all the fields. For this example, include the following fields:
• Airline Carrier ID
• Arrival City
• Airfare
• Text: Flight Class
6. Click the Next Screen button on the application toolbar to continue.
7. When the Selections screen appears, listing all the fields you selected on the Select Fields screen, add any of the fields to the selection screen that will be presented when you execute your report. You can add any fields you want to the selection screen by placing a check mark next to each field. For this example I have not added any.
8. Click the Statistics button on the application toolbar to create a statistics list in the SAP Query tool.
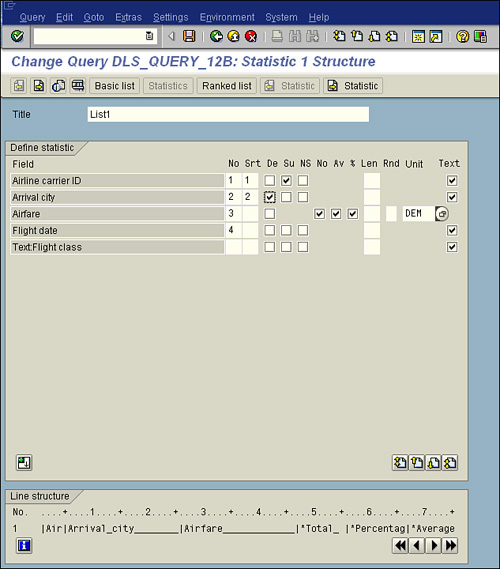
9. When the Statistics Line Structure screen appears, define your compressed list report, as shown in Figure 12.5. Specify the sequence in which you want to output the fields, and state whether you want them to be sorted in ascending or descending order. Indicate the Text option for each of the fields. Indicate a subtotal for the Airline Carrier ID field (refer to Figure 12.5).
Figure 12.5. By activating the Su checkbox on the Statistics Line Structure screen, you can display the subtotals row as well as displaying the total.
10. Press the F8 button on your keyboard to execute the report. As with almost all other reports in SAP, upon execution, you are presented with the report’s selection screen.
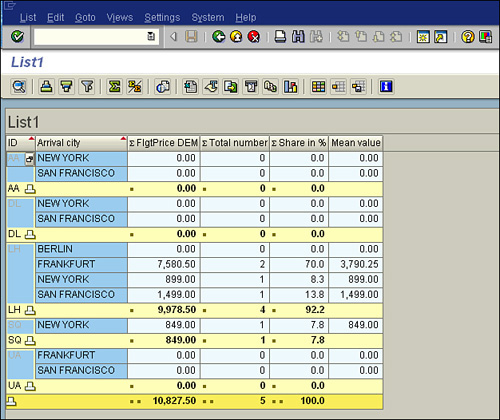
11. Click the F8 Execute button on the Application toolbar to display your finished report. Your report output should appear similar to that shown in Figure 12.6, but keep in mind that the actual values vary by organization.
Figure 12.6. If you are using currency conversions, after the statistics, you see an overview that states which currency conversions were performed, as well as the date and exchange rate on which the conversions were based.
Things to Remember
• You can use the SAP Query tool to create three types of reports: basic lists, statistics lists, and ranked lists.
• Statistics lists allow you to show summarized data in a format that is not possible with basic lists.
• Totals are always calculated for numeric fields. You can therefore determine average values, the number of selected records, and the percentage share.
• By activating the Su check box on the Statistics Line Structure screen, you can display the subtotals row as well as the total.
• If your report output includes currency conversions, after the statistics is an overview that states which currency conversions were performed, as well as the date and exchange rate on which the conversions were based.