Chapter 13. Creating Advanced Statistics Lists with the SAP Query Tool
In this chapter
Creating a Basic List for Reference by Using the SAP Query Tool 170
Creating an Advanced Statistics List by Using the SAP Query Tool 172
Chapter 12, “Creating Simple Statistics Lists with the SAP Query Tool,” covers how to create very basic statistical lists by using the SAP Query tool. This chapter takes that information to the next level, explaining how to create advanced statistical lists, which combine the functionality of calculated fields and statistical lists. If you are not comfortable with creating a basic list or a basic statistical list, you should practice the skills described in earlier chapters before proceeding.
Very often in report writing, it is most meaningful to view summarized data to make business decisions. This chapter uses the SAP IDES flight scheduling system as an example. Line item details, such as a basic list report displaying a list of scheduled flights for each day, are helpful for planning and being prepared for the day’s schedule. However, sometimes it is helpful to analyze the average number of flights by each day of the week or to look at how many flights one airline had in each month of the year compared to another airline. Advanced statistics are ideal for this type of summarized data.
The following sections show the syntax to use within calculated fields and also show how you can use calculated fields in conjunction with statistics to provide a summarized statistics report. You will begin by creating a basic list report (as discussed in Chapter 3, “Creating Basic Reports with the SAP Query Tool).” This report will serve as detail data and will be used for reference only. Next, you will create an advanced statistics report that summarizes the detail data in four quarterly views, using calculated fields plus statistics.
Creating a Basic List for Reference by Using the SAP Query Tool
To create a basic list report by using the SAP Query tool, you follow these steps:
1. Navigate to the Maintain Queries Initial screen by using transaction code /nSQ01.
2. Ensure that you are in the standard query area by selecting Environment, Query Areas and then choosing Standard Area (Client-Specific).
3. In the Query field, enter DLS_Exercise_13 (where DLS is your initials) as the name for the query you are creating, and then click the Create button.
4. When the InfoSets of User Group ZTEST window appears, listing all the available InfoSets (that is, data sources) for your Query Group, select the ZTEST InfoSet and then click Enter. The Create Query Title Format screen appears, allowing you to save the basic formatting specifications for your query, including the name (title) and any notes you want to store for the query. The only required field is Title (for example, Sample Advanced Statistics Report). Click the Save button on the toolbar.
5. To navigate to the Select Field Groups screen, click the Next Screen button on the Application toolbar.
6. When the Select Field Groups screen appears, listing all the field groups available in your InfoSet, place a check mark next to each field group whose fields you want to include in your report. (In my example, I selected all three.) Click the Next Screen button on the Application toolbar.
7. When the Select Fields screen appears, giving you a list of all the available fields within the selected field groups, place a check mark next to each field that you want to include in your report. You can use the Page Up and Page Down buttons to navigate between all the fields. For this example, include the following fields in the following order:
• Flight Date
• Airline Carrier ID
• Departure Time
• Arrival Time
• Airfare
• Text: Flight Class
• Airport of Departure
• Destination Airport
• Arrival City
8. Click the Next Screen button on the Application toolbar to continue. The Selections Screen appears, listing all the fields you selected on the Select Fields screen, giving you the opportunity to add fields to your report’s selection screen.
9. You can add to your report’s selection screen any fields you want by placing a check mark next to each field. (In my example, I did not add any.)
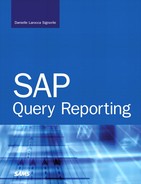
10. Click the Basic List button on the Application toolbar to create a basic list in the SAP Query tool. The Basic List Line Structure screen appears, showing a list of the fields you selected to include in your report.
11. For each field, specify the line and sequence number as you want them to appear on your report (see Figure 13.1). You can also use the Basic List Line Structure screen to indicate sort order, totals, and counts, if needed.
Figure 13.1. Unlike the Statistics screen, the Basic List Line Structure screen requires only line and sequence numbers.
12. Proceed directly to the report’s selection screen by pressing F8. The report’s selection screen gives you an opportunity to specify any criteria for the output of your report.
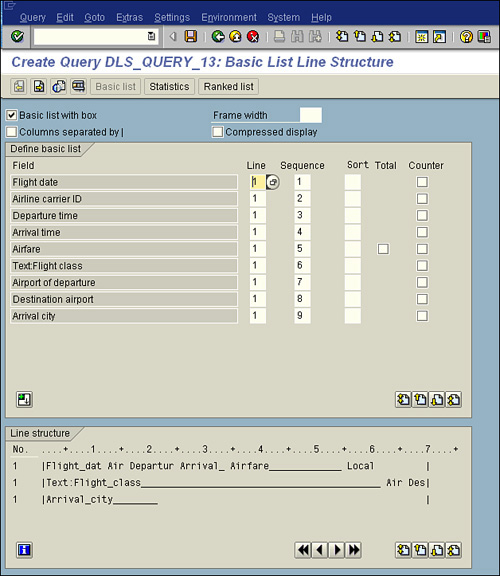
13. Press F8 to execute your finished report. Your report output should look similar to that in Figure 13.2, but keep in mind that the actual values vary by organization.
Figure 13.2. This report displays all the line item details of scheduled flights in your IDES test database.
Creating an Advanced Statistics List by Using the SAP Query Tool
To create an advanced statistics list that summarizes the data displayed in the basic list you created in the preceding section, you use calculated fields and advanced statistics by following these steps:
1. Navigate to the Maintain Queries Initial screen by using transaction code /nSQ01.
2. In the Query field, enter DLS_Exercise_13A (where DLS is your initials) as the name for the query you are creating, and then click the Create button.
3. When the InfoSets of User Group ZTEST window appears, listing all the available InfoSets (that is, data sources) for your Query Group, select the ZTEST InfoSet and then click Enter. The Create Query Title Format screen appears, allowing you to save the basic formatting specifications for your query, including the name (title) and any notes you want to store for the query. The only required field is Title.
4. Enter a title (for example, Sample Advanced Statistics Query A) and then click the Save button on the toolbar. To navigate to the Select Field Groups screen, click the Next Screen button on the Application toolbar.
5. When the Select Field Groups screen appears, listing all the Field groups available in your InfoSet, place a check mark next to each Field group whose fields you want to include in your report. (In my example, I selected all three.) Click the Next Screen button on the Application toolbar.
6. When the Select Fields screen appears, giving you a list of all the available fields within the selected field groups, select Edit, Short Names, Switch On/Off. Create short names for your existing query fields so that you can easily refer to them in calculations. Enter TOTAL as the short name for the Total of Current Bookings field and enter FDATE for the Flight Date field. The Flight Date field specifies the date of the flight, and the Total Current Bookings field tells the amount of money spent on the flight. By using a combination of calculated fields and statistics, you can calculate the total of current bookings by airline for each quarter of a year, as determined by a year input at report execution time.
7. To create a local field to store the date (which will be input on the report’s selection screen at runtime), place your cursor on the Flight Date field and then select Edit, Local Field, Create. The Define Field dialog box appears.
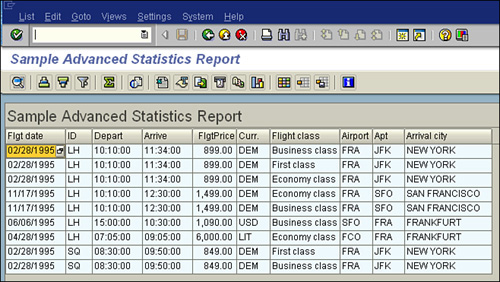
8. Input Year as the short name for your newly created local field Year, and input Year again as a field description (see Figure 13.3).
Figure 13.3. For this example, you input a short name and indicate that you want the field to be a text field with four characters (for example, 2007).
9. Define the attributes for the field by selecting the Text option button and indicating that you want it to be four characters wide (which is wide enough to accommodate the column heading and the output year, for example).
10. Select the option button labeled Input on Selection Screen to include the Year field on the report’s selection screen so that you can input a value at report runtime. Click the Continue button to close the Define Field dialog box and return to the Select Field Group screen.
11. Create calculated fields that read the Year field and deduce the appropriate quarter of the year (that is, Quarter 1, 2, 3, or 4) to determine where the summarized data should be output in the report. To do so, position your cursor in the Year field to base your calculated field on it, and then select Edit, Local Field, Create to create a new field. The Define Field dialog box appears.
12. Input Q1 as the short name for your newly created local field and input Quarter 1 as the field description.
13. Define the attributes for the field. Because this field will output a summarized version of the Total of Current Bookings field, you can select that the field have the same attributes as the Total field. (Both are currency fields.)
14. Click the Complex Calculation button. Enter the calculation formula with the condition FDATE [ YEAR ] = YEAR AND 1 <= FDATE [ MONTH ] AND FDATE [ MONTH ] <= 3 and the formula TOTAL (see Figure13.4).
Figure 13.4. With long formulas, you can use the Complex Calculation button so that your formula can extend beyond a single line.
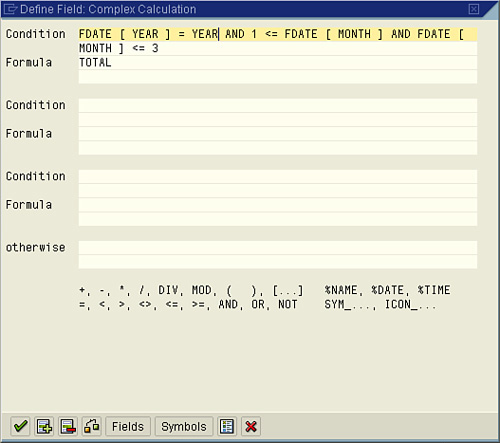
15. Click the Check button (highlighted in Figure 13.4) to ensure that you have typed the mathematical formula correctly. Click the Continue button to return to the Define Field dialog box, and then click the Continue button to return to the Select Field Group screen.
Helpful Hint
You can create a new column in your report called Quarter 1 to review the Flight Date field and determine what quarter it falls under. For example, January through March would be Quarter 1, and October through December would be Quarter 4. The complex formula used in this example and shown in Figure 13.4 is based on using the various operands and operators covered in Chapter 9, “Creating Basic Calculated Fields with the SAP Query Tool,” and Chapter 10, “Creating Advanced Calculated Fields with the SAP Query Tool.”
Now that the new Quarter 1 field has been created, you need to repeat those steps to create three more calculated fields to accommodate Quarters 2, 3, and 4, which will review the Flight Date field and extrapolate what quarter each total booking falls into. The formula you input translates to output in the appropriate quarter column (1, 2, 3, or 4) to display the total of the Total of Current Bookings field for any flight that is within each quarter.
16. Position your cursor in the Q1 field to base your calculated field on it, and then select Edit, Local Field, Create. The Define Field dialog box appears.
17. Input the short name Q2 for your newly created local field, and then input Quarter 2 as the field description.
18. Define the attributes for the field. Because this field will output a summarized version of the Total of Current Bookings field, you can select that the field have the same attributes as the Total field. (Both are currency fields.)
19. Click the Complex Calculation button. Enter the calculation formula with the condition FDATE [ YEAR ] = YEAR AND 4 <= FDATE [ MONTH ] AND FDATE [ MONTH ] <= 6 and the formula TOTAL. This translates to output in the Quarter 2 column the total of the Total of Current Bookings field for any flight that is within Quarter 2 (Months 4, 5, and 6).
20. Click the Check button (highlighted in Figure 13.4) to ensure that you have typed the mathematical formula correctly. Click the Continue button to return to the Define Field dialog box, and then click the Continue button to return to the Select Field Group screen.
21. Position your cursor in the Q1 field to base your next calculated field on it, and then select Edit, Local Field, Create. The Field Definition dialog box appears.
22. Input the short name Q3 for your newly created local field, and then input Quarter 3 as the field description.
23. Define the attributes for the field. Because this field will output a summarized version of the Total of Current Bookings field, you can select that the field have the same attributes as the Total field. (Both are currency fields.)
24. Click the Complex Calculation button. Enter the calculation formula with the condition FDATE [ YEAR ] = YEAR AND 7 <= FDATE [ MONTH ] AND FDATE [ MONTH ] <= 9 and the formula TOTAL. This translates to output in the Quarter 3 column the total of the Total of Current Bookings field for any flight that is within Quarter 3 (Months 7, 8, and 9).
25. Click the Check button (highlighted in Figure 13.4) to ensure that you have typed the mathematical formula correctly. Click the Continue button to return to the Define Field dialog box, and then click the Continue button to return to the Select Field Group screen.
26. Position your cursor in the Q1 field to base your next calculated field on it, and then select Edit, Local Field, Create. The Define Field dialog box appears.
27. Input the short name Q4 for your newly created local field, and then input Quarter 4 as the field description.
28. Define the attributes for the field. Because this field will output a summarized version of the Total of Current Bookings field, you can select that the field have the same attributes as the Total field. (Both are currency fields.)
29. Click the Complex Calculation button. Enter the calculation formula with the condition FDATE [ YEAR ] = YEAR AND 10 <= FDATE [ MONTH ] AND FDATE [ MONTH ] <= 12 and the formula TOTAL. This translates to output in the Quarter 4 column the total of the Total of Current Bookings field for any flight that is within Quarter 4 (Months 10, 11, and 12).
30. Click the Check button (highlighted in Figure 13.4) to ensure that you have typed the mathematical formula correctly. Click the Continue button to return to the Define Field dialog box, and then click the Continue button to return to the Select Field Group screen.
31. To proceed with the statistics, click the Statistics button on the Application toolbar to create a statistics list in the SAP Query tool. The Statistics Line Structure screen appears.
32. Name your compressed list report LIST_1 (see Figure 13.5).
Figure 13.5. Unless currency conversions are used, you need to select the unit of measurement. For demonstration purposes, this figure shows DEM selected instead of USD because most entries in the SAP test database use German currency DEM.
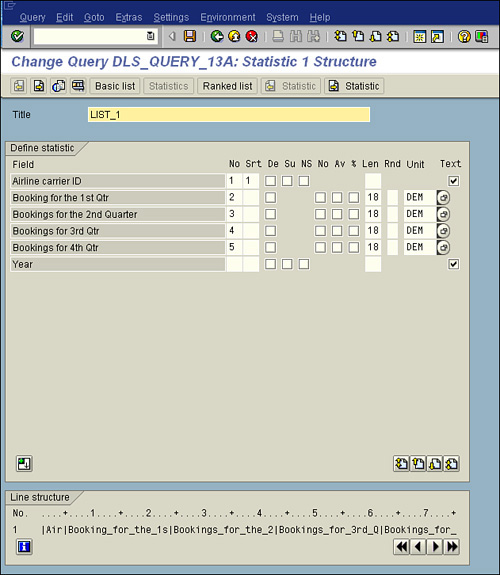
33. Specify the sequence in which you want to output the fields, and state whether you want them to be sorted in ascending or descending order. Totals are always calculated for numeric fields. You can therefore determine average values, the number of selected records, and the percentage share. Indicate lengths and unit numbers for the calculated fields, as shown in Figure 13.5.
34. Press F8 to execute the report. As with almost all other reports in SAP, when you execute this report, you are presented with the report’s selection screen.
35. Because in step 8 you created a calculated field to be input on the report’s selection screen for the year, called Year, you need to enter a four-character year, such as 1995, before continuing.
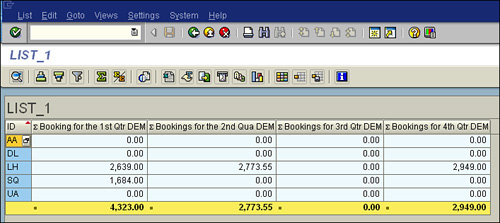
36. Press F8 to display the finished report. Your report output should appear similar to that in Figure 13.6, but keep in mind that the actual values vary by organization.
Figure 13.6. If you are using currency conversions, after the statistics, you see an overview that states which currency conversions were performed, as well as the date and exchange rate on which the conversions were based.
Helpful Hint
Creating the detail report at the beginning of this chapter allows you to not only reconcile your calculated report output but also to see which year you should input on your report’s selection screen to produce output. This example has flight data only for 1995, so that is the year indicated on the selection screen upon execution.
Having the ability to create your own reports with summarized, averaged, and calculated SAP report data is empowering, because it means you no longer need to extract data and report from it by using a third-party tool such as Microsoft Access or Excel. It also saves you from having to rely on a technical ABAP programmer to create detailed, advanced statistical reports in SAP Query.
Things to Remember
• You use statistics lists to produce summarized information.
• You can be creative with the use of operands and operators in determining quarters within a year.
• If you are using a multi-currency client, your currency conversions are displayed after your report output.
• Creating advanced statistics is easy when you have mastered the skills taught in this chapter.