
Chapter 3. Ensuring that your code is doing things right
- Knowing how much of your code is doing things right
- Explaining metrics on a file level
- Configuring your favorite code-coverage tool
- Integration testing (IT)
These days, unit testing is a standard practice for many teams. But if you’re among the holdouts, the first part of this chapter should convince you that it’s the right time to get started with unit testing.
Whether you’re just getting started with unit testing or you’re already an experienced test writer, SonarQube can help you track how much of your code is covered by unit tests. And more important, it will help you pinpoint the gaps in your testing, so you can close them. Two types of things can go wrong with unit tests: runtime issues (such as failing or erroring-out) and rule issues. We’ll talk about both in this chapter.
SonarQube’s great for everyone, not just coders. If you’re on the QA side of the house, you’ll find that SonarQube helps you do a better job, too, by showing you what the developers have already covered with unit tests and what they’ve left undone. Now you can focus your efforts where they’ll do the most good, on the features that are poorly covered by unit tests.
Management and the rest of the project stakeholders all have something to gain from SonarQube as well. We know you care about software quality, and test coverage is an important element of quality control. We’ll show you how easy it is to track and improve your coverage with SonarQube.
We’ll start from the project dashboard and look at the high-level testing metrics. Then we’ll drill in to the source code and show you how to spot files with problematic tests and low coverage. When we’re done, you’ll never think of testing the same way again.
The topics we’ll cover here don’t require you to be an expert in unit and integration testing, but you may want to check out some of the following Manning titles if you’d like more information:
- Effective Unit Testing, by Lasse Koskela (2013), www.manning.com/koskela2
- JUnit in Action, 2nd edition, by Petar Tahchiev, Felipe Leme, Vincent Massol, and Gary Gregory (2010), www.manning.com/tahchiev
- The Art of Unit Testing, 2nd edition, by Roy Osherove (2012; 3rd edition forthcoming), www.manning.com/osherove2/
The examples shown in this chapter are based on JUnit. But we’ve tried to keep them as simple as possible so that TestNG fans or non-Java readers won’t find the chapter hard to follow. TestNG and JUnit are the most popular unit-testing frameworks with adequate online documentation (http://junit.org, http://testng.org). You can check them for useful resources and use cases.
3.1. Knowing how much of your code is doing things right
What’s the biggest reason for the eternal brawl between programmers and testers? Is it (from a coder’s perspective) because testers are exaggerating whiners who magnify tiny issues in otherwise bulletproof code? Or is it because (from a tester’s point of view) programmers are lazy slobs who would have tried to downplay the gash in the Titanic?
What about when customers find issues in a production environment? Someone always asks: whose fault is it that the bug made it to production? The developers who coded it? The testers who didn’t catch it? You won’t find an answer here—or even an argument either way. It’s just not worth it. What’s more important is figuring out how to keep it from happening again.
The reason bugs slip into production is that time is a limited resource for everyone on the team. You need to find a way to spend it wisely. Theoretically, developers write unit tests for every method they implement, to prove that their code works. But do they really? On the other hand, the QA team should re-test all the system functionality for each iteration or release. That’s almost impossible, though, so they usually pick some subset of features for re-testing. What are the criteria for picking those features? There probably are some, but it can seem as random as tossing darts at a feature list.
Now comes the “what if” scenario. What if you knew which source files were already covered by unit tests? Then the QA folks could focus their limited testing time on the functionality that was only partially covered by unit tests or not covered at all—making far, far better use of their time than the feature testing lottery you may have had in the past. If you agree, then you’re reading the right chapter. Start SonarQube’s engines, and get the testing coverage metrics you need.
3.1.1. Understanding unit-test metrics
We’ll start from the default dashboard, with the widget that displays SonarQube’s unit-test metrics. After your first analysis, you’ll see something like figure 3.1, which shows Code Coverage on the left and Unit Test Success on the right.
Figure 3.1. SonarQube’s testing widget on the default dashboard
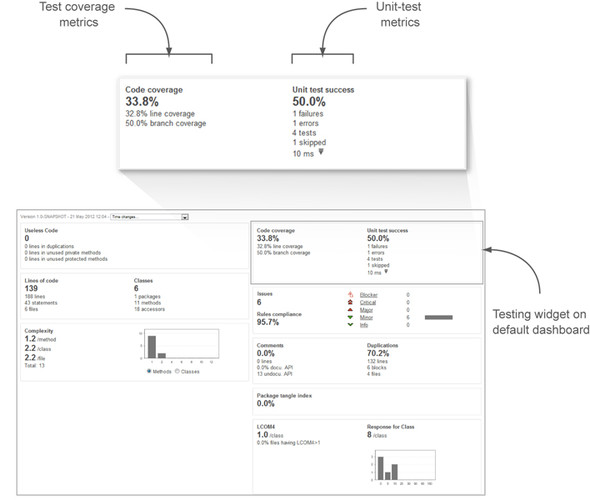
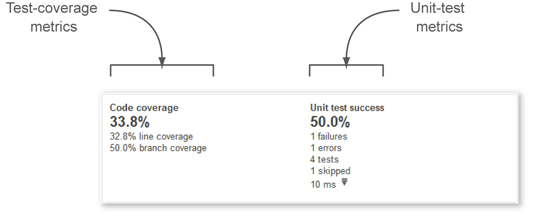
Many readers will be familiar with the code-coverage numbers, but unit-test success may need some explanation. For the time being, keep in mind that test-coverage metrics report on how much of your code is tested, whereas unit-test success provides quantitative information about your unit tests.
Let’s group these metrics into a category and call them unit-test metrics (see figure 3.2). Starting from the right side of the widget, the first and most important metric is the unit-test success density. Any number below 100% is unacceptable and should trigger a red alert. Below the unit-test success density are some of the numbers that feed the density calculation. Table 3.1 gives a detailed explanation of each metric. We decided not to list them in the order they appear in the widget, but in a way that will help you better to understand success density, which is computed based on the other metrics.
Figure 3.2. Unit-test metrics
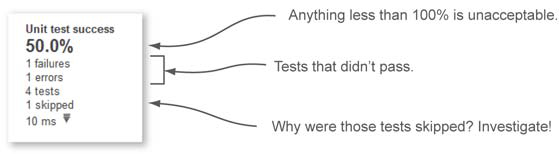
Table 3.1. Unit-test metrics
|
Metric |
Description |
|---|---|
| Failures | Absolute number of assertions that failed. If a test includes more than one assertion (which is considered bad practice), then those found after the first failed assertion are never executed—which is one reason multiple assertions per test is bad practice. |
| Errors | Absolute number of tests with errors. A test with one or more errors is a test that hasn’t completed its assertion. For instance, an unexpected exception has occurred during its execution. |
| Tests | Absolute number of tests executed by SonarQube during the latest project analysis. |
| Skipped | Absolute number of tests that weren’t executed. For example, in JUnit 4.x, these tests are annotated with @Ignore; and in TestNG, they’re annotated with @Test(enabled=false). Similar attributes exist in most xUnit frameworks. |
| Ms | Time (in milliseconds) needed to execute all tests by SonarQube during the latest project analysis. |
| Unit-test success density | A roll-up calculation of your unit-test suite’s overall success in the last run. It’s calculated based on the following formula: Tests – (Failures + Errors) / Tests |
When you’re looking over your unit-test metrics, keep in mind that test failures and errors are as important as success density. If you see any value other than zero (0) for failures or errors, then it’s time to start worrying and take immediate action. Nonzeros for either metric indicate either potential bugs in your code (worst-case scenario) or outdated unit tests (best-case scenario).
Skipped tests aren’t as critical as failed tests, but any positive number means you need to do some investigation. Why are there tests that aren’t executed? Are they useless? Are they failed tests disguised as skipped tests? Did someone notice they were failing (maybe due to the latest code modification) and, instead of address the problem, flag the tests to be ignored?
Unfortunately, developers sometimes skip tests instead of trying to fix them or clean them out. The tests that get skipped are usually the ones that are hard to maintain, provide no real testing, or, worst-case, are failing and nobody knows why. Unless you have serious reasons for skipping tests, you should examine each one carefully and decide what has to be done so you can stop ignoring them.
The last two metrics are the number of tests in your source code and the time needed to run them during SonarQube’s analysis. Knowing how many unit tests you have in your project is of little use: 10 tests means one thing for 100 lines of code and something completely different for 10,000 lines of code. Also, how many assertions does each test include? Ideally, you have a single assertion per test, but it’s possible that one single test asserts more conditions than 10 optimally written tests. Based on our experience, this metric is rarely used for quality conclusions, but it can still provide some valuable insight if combined with other metrics.
On the other hand, the time elapsed to complete all unit tests could be useful. Although you should write your unit tests in such a way that they fail if they take longer than you expect, the total time spent for unit-test execution is helpful to know in a Continuous Integration environment because it can help you recognize when it’s time to refactor your tests.
“Continuous Integration (CI) is a software development practice where members of a team integrate their work frequently. Usually, each person integrates at least daily— leading to multiple integrations per day. Each integration is verified by an automated build (including test) to detect integration errors as quickly as possible” (Martin Fowler, http://martinfowler.com/articles/continuousIntegration.html).
One of the key concepts of CI is that the development team gets instant feedback (within a couple of minutes) on the build results so that they can take immediate actions to fix a broken build. If tests take too long to execute, then the feedback is delayed as well, and the team loses the immediate feedback advantage of the CI practice.
Continuous inspection using SonarQube (a step beyond CI) is covered in depth in chapter 9. You’ll learn how to integrate your favorite CI tool with SonarQube and automate your quality-inspection process.
For the topic of this chapter, keep in mind that one of the key points of a successful CI environment is to send feedback to every team member as soon as possible after each commit. If unit tests, which are executed by every automated build, take too long to complete, then feedback is delayed, and your CI process is less effective. So if SonarQube reports a high value for unit-test execution time, you may need to optimize your tests.
3.1.2. Getting reports on unit-test coverage metrics
Let’s go back now to the dashboard widget and look at the code-coverage numbers on the left. As figure 3.3 shows, there are three different coverage metrics: code coverage, line coverage, and branch coverage.
Figure 3.3. Unit-test coverage metrics
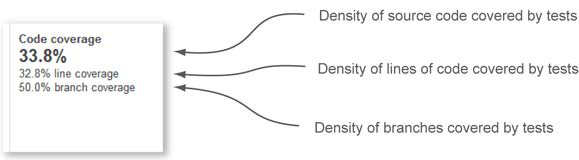
We prefer to group the coverage metrics in a category called unit-test coverage metrics. All of them are based on testing execution and provide an overview of how well your source code is covered by unit tests. Once again, remember that numbers are everything, and at the same time, they don’t mean anything if you try to interpret them in isolation. Table 3.2 explains how these metrics are calculated and what they mean.
Table 3.2. Unit-test coverage metrics explanations
|
Metric |
Description |
|---|---|
| Line coverage | The density of lines that are executed at least once during unit-test execution. It’s calculated by the following formula: Lines to Cover – Lines with No Unit Tests / Lines to Cover where Lines to Cover is considered to be all lines that need to be covered by unit testing. |
| Branch coverage | The density of possible paths (branches) in flow-control structures that have been covered by unit tests during SonarQube analysis. It’s calculated by the following formula: ((2 * Number of Paths) – Covered Paths by Unit Testing) / (2 * Number of Paths) |
| Code coverage | A combination of line and branch coverage. It helps assign a single value for test coverage. It’s calculated by the following formula: ((2 * Number of Paths) – Covered Paths) + Lines of Code – Covered Lines / (2 * Number of Paths) + Lines of Code |
A branch is a source code block that is conditionally executed at runtime—that is, only when a condition at the branching point is satisfied. In our experience, branch coverage is always the metric with the lowest value. This means most projects are at risk, because only a fraction of the logical paths through the code are tested. Imagine that during an online checkout process the customer has to select a payment method (credit card, PayPal, or bank transfer) and then enter the account details (card number or bank account, and so on). For simplicity, we’ll say that the selected payment method and its details are handled in a single source code file. So at runtime, there are three different paths to follow (one for each payment method), depending on user interaction.
If there are only unit tests for credit-card processing, then only a third of the actual code is covered, and the branch coverage value for the file is 33.33%. Unfortunately, developers tend to write unit tests only for the branch that’s most likely to be executed at runtime: the happy path. We believe this happens for two reasons. First, they usually don’t understand branching from a unit-testing perspective. Second, even if they do, they feel that writing tests for all possible paths is a waste of time. But in our experience, leaving branches uncovered by unit tests means a lot of bugs not caught. Perhaps it won’t be an issue immediately, but certainly it can be down the road as the code evolves. For clarity, here’s an example of two branches:

Each branch displays a different message based on the result of the branch point (age < 18). If you write only one unit test that checks this code, let’s say by passing in a value of 10 for the age parameter, then you’ve covered only branch 1. Branch 2 is still untested, and you can’t be 100% sure that your code is working as expected. The following listing shows a JUnit test class that gives you 100% coverage for the isAdult method.
Listing 3.1. JUnit Test class that gives 100% coverage on the isAdult method
public class AgeValidationTest {
  @Test
  public void validateAdult() {
    int age = 18;
    Employee instance = new Employee();
    assertTrue(instance.isAdult(age));
  }
  @Test
  public void validateNotAdult() {
    int age = 17;
    Employee instance = new Employee();
    assertFalse(instance.isAdult(age));
  }
}
There’s something else important here that SonarQube can’t tell you. You could use the extreme ages of 0 and 500 in your test cases and get 100% branch or line coverage and still miss a defect if the code checks for 180 instead of 18. That’s why you write two tests that check the maximum age (17) at which people are still considered non-adults and the first age (18) at which people are considered adults.
Remember that you should carefully select the inputs of your unit tests. As we said in the chapter introduction, a couple of great books explain in detail all unit test best practices.
Let’s go back for a moment to why it’s not a good idea to focus on only one metric for test coverage. A couple of years ago, we analyzed an open source project with SonarQube and noticed that whereas line coverage was over 90%, branch coverage was below 30%. If that were your project (or one you were using), would you think there was enough coverage? We didn’t; 30% is too low for branch coverage.
Let’s take a closer look at those numbers. It looks like unit tests execute 9 out of every 10 lines of code at least once. And that’s great. On the other hand, only a third of the paths in flow-control structures are exercised by unit tests. The conclusion? This code base needs more unit tests for these branches.
You might be wondering by now which number is acceptable for test coverage (line, branch, and code). Well, there is no “right” answer to this question. Ideally you’d expect to achieve 100% for all three metrics. But this isn’t feasible, especially in large projects. Moreover, 100% coverage of a class doesn’t verify that the code is doing what’s expected. For instance, if you have 70% coverage, the only safe information is that the other 30% of your code isn’t executed by unit tests. The “covered” 70% requires manual verification to ensure that everything is really and properly tested.
Take a look at the next listing. It again gives you 100% coverage for the isAdult method, but there is no real testing.
Listing 3.2. JUnit test class with no real testing
public class AgeValidationTestDummy {
  @Test
  public void validateIsAdult() {
    int age = 18;
    Employee instance = new Employee();
    instance.isAdult(age);
    age = 17;
    instance.isAdult(age);
  }
}
In the listing, both method branches are covered at least once during test execution. But do you see any assertions of the returned values? Although you have a 100% value on code coverage, you haven’t tested the method’s expected behavior. Furthermore, you can configure SonarQube to notify you about a test without an assertion. To do so, you need to enable the appropriate rules under the repository PMD Unit tests. You’ll find more on administering rules and quality profiles in chapter 13.
We advise you to use test metrics solely to identify poorly tested code blocks. If you get high values on code coverage, feel free to celebrate, but only if you’re sure that all developers correctly apply the unit-testing practice.
Let’s go back to the numbers. If you had to pick just one testing metric to track over time, we’d recommend code coverage, the first number in SonarQube’s widget. But all the coverage numbers deserve attention. With a little scrutiny, they reveal valuable information, such as the fact that you have untested paths or critical program features with low coverage.
Now that you’ve had a taste of testing metrics, it’s time for real action. The discussion in the next few sections will be about technical details at a low level; so if you’re a manager (technical or not), you might be tempted to skip ahead to section 3.4, which covers integration testing. But even if you’re not a hands-on coder or tester, we think an understanding of the technical details can be helpful. So take a deep breath and dive in to your source code again. This time it’s all about testing.
3.2. Explaining metrics on a file level
Remember that dashboard widgets provide information on a project level, but tracking unit-testing metrics and coverage is nearly meaningless if you don’t drill down to each source file and get reports for individual lines of code. After all, if you’re a developer, you’re responsible for testing your code on the unit level to ensure that it’s working as expected. And if you’re a tester, you need to know which parts of the code (which program features) are poorly unit-tested (have low code coverage) so you can spend more time testing them at a higher level.
Next, we’ll look at how to spot which lines of code in a file aren’t covered and which branches aren’t followed during test executions. When we’re done, you should be able to get reports at a file level on the values of the three density metrics described in table 3.2 (line coverage, branch coverage, and code coverage). You’ll also learn how to read the Coverage tab in the file detail view, and the Tests tab, which appears in the file detail view for the unit tests themselves and offers details on the tests executed for a single file. More important, when we’re finished, you’ll know how to find where to start fixing or testing what’s not already covered.
3.2.1. Hunting source code lines with low coverage
Starting again from SonarQube’s default dashboard, click-through on the first code-coverage metric, and you’ll be redirected to the code-coverage drilldown view. You’d get basically the same screen if you clicked Line Coverage or Branch Coverage; we’ll cover the minor differences in a minute.
At the top of the page, you see the drilldown view’s normal presentation of modules, packages, and files (if there is only one module in the project, then the first pane is omitted). Click a module to filter the package and file sections to only those in the selected module. The same applies when you click a package name. Figure 3.4 is a screenshot taken from SonarQube’s public instance, http://nemo.sonarsource.org. It shows coverage of SonarQube’s own modules; because we clicked the CPD plugin module, lists in the second and third panes are filtered accordingly.
Figure 3.4. Drilldown view of code coverage
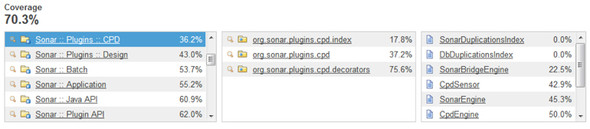
Next to each module, package, and file is its corresponding code-coverage metric. What’s cool is that the drilldown view is always sorted to show the worst first, so components with low coverage are displayed at the top. When you’re looking at your own code coverage, keep in mind that components with perfect scores are omitted from the drilldown (after all, the point is to help you find what you need to work on). In other words, if a file or package has a code-coverage score of 100%, then it’s not displayed in these lists. If you don’t see some of your classes or packages, don’t worry. It’s a feature, not a bug, and it’s telling you that you’ve done your job right!
Before we move to the file’s Coverage tab, let’s see how the drilldown view looks when you click Line Coverage or Branch Coverage from the dashboard. There are two major differences between figure 3.5 and the list on the left in figure 3.4.
Figure 3.5. Drilldown view of line and branch coverage

As you’ll probably notice, additional header information reports the absolute number of uncovered lines/branches on a project level. By the term uncovered lines/branches, we mean those source code lines or branches that aren’t tested at all. The other big difference in the drilldown is that the numbers to the right of each component show how many lines/branches need testing, rather than the density of coverage. Bigger numbers are sorted upward, but the organization is still worst first, so less-tested components are again shown at the top of the list.
By now you can tell which modules, packages, and files are poorly covered by tests just by browsing to the drilldown view. We’re sure the QA folks are already jumping up and down at the prospect of knowing which parts of the system aren’t adequately unit-tested. Developers, on the other hand, have both a low-level and a high-level insight specifically into testing. What is missing is the file-level information that will allow you to locate the individual code lines with little or no unit-testing coverage.
Click a filename, and a brand-new world appears. It’s the Coverage tab for your file, and as figure 3.6 shows, it contains everything you need to start improving your unit tests.
Figure 3.6. The Coverage tab of a source code file

At the top is the fully qualified filename (including package) and the module it belongs to, if any. In the tab’s header, you see all the code-coverage metrics we discussed in section 3.1: line coverage, branch coverage, and code coverage, this time on a file level.
Just below the header is the source code of the file you’re looking at. By default, SonarQube hides useless lines such as package declarations, library imports, and header information. You can limit the number of lines shown by choosing a different view from the corresponding list (see figure 3.7), or you can browse the full source code by clicking the check box provided for that purpose. For now, ignore the first drop-down list box. We’ll cover it in depth in chapter 9, which discusses continuous inspection in detail.
Figure 3.7. Coverage tab view selection
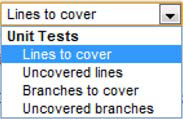
As figure 3.7 shows, SonarQube provides four options for identifying uncovered source code. Table 3.3 lists these options and discusses how they affect the file view.
Table 3.3. Unit-test metric explanations
|
Selection |
Explanation |
|---|---|
| Lines to Cover | The default selection. Displays all lines of code that need to be covered. Lines that don’t need test coverage (header comments, the package declaration, and library imports) aren’t displayed. Includes both uncovered and already-covered lines. |
| Uncovered Lines | Displays lines of code that aren’t covered by unit tests. |
| Branches to Cover | Displays all possible branches that need to be covered, including the ones that are already covered. |
| Uncovered Branches | Displays uncovered or partially covered branches. |
Reading the Source Code Viewer
Before you start playing with these options, you need to know one more thing: how to read the source code viewer. To the left of the code are three columns with numbers in them (ignore the leftmost column for now; we’ll talk about it in chapter 10 when we cover SonarQube’s review functionality). The first column with a number shows the line number within the file, the second reports on how many times the line was accessed during unit-test execution, and the third reports on the number of covered branches out of the total count of branches. As you can see in figure 3.8, because the second column is about branches, it’s empty for lines that don’t include flow-control structures.
Figure 3.8. Source code viewer with coverage indicators
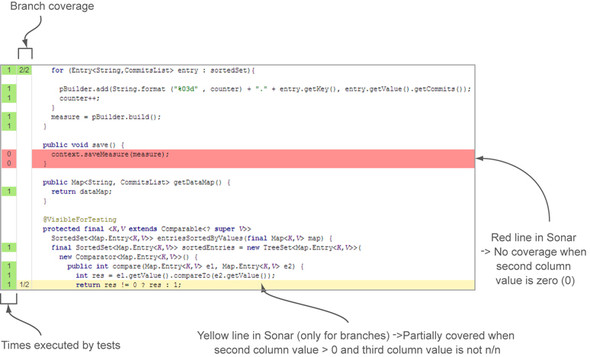
When the first column is green and the line doesn’t contain any branch points, you can check it off as “done” because it means the line is fully covered by tests. On the other hand, if you see a zero on a red background in this column, it means the line wasn’t exercised at all during unit testing and you definitely need to write one or more tests for it. The third column is a bit more sophisticated. In addition to red and green, you’ll also see yellow, which lets you know that some of the possible paths through the code aren’t covered. When there’s red or yellow in either of the last two columns, that color extends across the code so that even with a quick skim, your eye is pulled to the problem areas.
If you’re feeling lost with all these numbers, don’t worry. All you really need to do is pay attention to the lines where you see red or yellow. If a line is colored, it’s not a good thing, and you should consider taking action to address it.
At this point, you understand how SonarQube “grades” your unit-test coverage, and you’ve seen how test-coverage metrics are presented at the project, module, package, and file levels. Next we’ll look at the unit tests themselves, because SonarQube has something to say about them, too.
3.2.2. Finding problems in your unit tests
Until now, we’ve concentrated on the metrics for your program’s source code. But SonarQube offers insight into your unit tests as well, which, although not usually included under the source code umbrella, are extremely important. This feedback ensures that a software system does what it’s expected to do on a unit level. In this section, you’ll learn how to identify problem areas in your unit-test files.
First, you’ll have to go back to SonarQube’s default dashboard. Until now we’ve looked at the left side of the code-coverage widget. Now it’s time to see what’s hiding behind the Unit Test Success metrics on the right. Start by clicking any number under Unit Test Success (shown in figure 3.9), and you’ll land at the drilldown view.
Figure 3.9. SonarQube’s testing widget on the default dashboard
We need to mention a couple of things here. Once you click-through, the packages and files you see aren’t source code components, but testing components. For Maven folks, all files under src/test are displayed here. If you’re an Ant-oriented software house, then you’ll see all files placed in your project’s test directory here.
If you click from the dashboard on a metric that has the best possible value (for instance, 100% success, or 0 failures), then the drilldown view will be empty because there is nothing you need to improve. If so, keep up the good work! And keep in mind that the beauty of the drilldown view is that it displays only components that need your attention.
We hope you don’t have any failing or skipped tests in your projects, and the drilldown view is empty for every metric except test count and execution time (ms). If you’d like to see what skipped or failing tests look like in SonarQube, you can analyze the source code of this book, which was intentionally written to demonstrate all sorts of possible issues.
To start exploring the quality of your unit tests, click-through from the dashboard on the number of tests (you should have some), and navigate to any file you want in the drilldown. You’ll find yourself on the Tests tab, which looks something like figure 3.10.
Figure 3.10. List of test methods in a test file
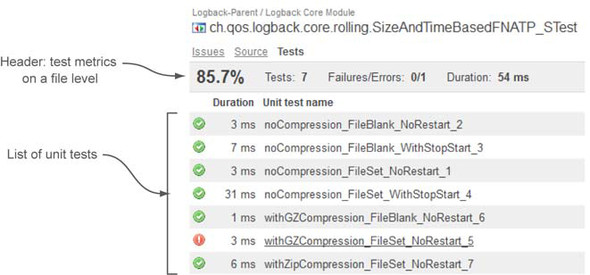
The unit-test presentation may remind you of the Coverage tab we discussed in section 3.2.1. The truth is, they have a lot in common. First, a similar header shows all the unit-test metrics for the current test file. Just below the header is a list of unit-test names, with the most recent execution duration and status of each. For those familiar with JUnit 4.x, this list shows all the methods in the test class that are annotated with @Test.
As you’ve probably guessed, the icon to the left of the duration represents the status of each unit test. It will match one of the images shown in table 3.4.
Table 3.4. Unit-test statuses
|
Status Image |
Description |
|---|---|
| Successful unit test | |
| Skipped unit test | |
| Errored unit test | |
| Failed unit test |
For tests in the list that failed or errored-out, you’ll see a link in the far-left Expand column. Click this, and you’ll get details about what went wrong. If the test failed, then you’ll see the assertion that caused the failure. If there was an error, then you’ll probably see an exception and the full stack trace, as shown in figure 3.11.
Figure 3.11. The Expand link reveals the root cause of a test error.
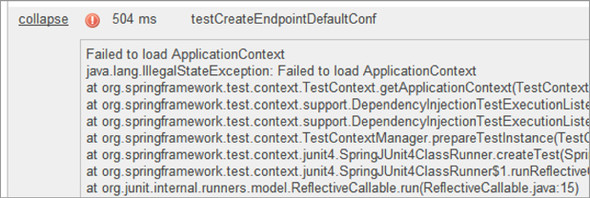
One last thing about this list: execution time is always displayed, no matter what the unit-test status is. For skipped tests or tests with errors—in other words, tests that didn’t complete—the value of this metric is always 0 ms. For completed tests (successful or failed), you’ll see the actual execution time of the test and its assertion(s).
At this point, you’ve seen all of SonarQube’s core unit-test and coverage features. Without any extra configuration, it takes only minutes to obtain detailed reports and metrics on the testing health of your source code. The rest of this chapter focuses on more advanced topics, such as selecting and configuring your favorite code-coverage tool and displaying integration test metrics. At the end of the chapter, we’ll present a couple of testing-related plugins that we think you might find useful.
There’s one last thing to know about discovering issues in unit tests. We told you earlier in this chapter that you can use rules and experience issues in unit-test files just as you do with your source code files. In fact, these rules support only JUnit tests. But if you’re an experienced user, you can create your own rules by modifying existing ones to cover other frameworks.
In the previous chapter, we discussed issues and where they come from. In chapter 13, we’ll cover rule-set administration in detail. Meanwhile, keep this in mind regarding unit-test rules: by default, all rules aren’t enabled, and they fall under the rules repository named PMD Unit Tests. Activate those that make sense to you, and launch a new project analysis. Issues (if any) will appear in the Source tab. You won’t have any trouble spotting the issues, because they look like those found in source code files.
3.3. Configuring your favorite code-coverage tool
SonarQube’s default code-coverage tool for Java projects is JaCoCo; but Cobertura is also embedded (which means the two most popular Java coverage tools are available by default), and there are plugins to support EMMA and Clover as well. For other languages, coverage tools are provided in the corresponding plugin.
Table 3.5 summarizes the coverage tools supported by SonarQube. For more details about installing and updating SonarQube plugins, please refer to chapter 14. To check for the most up-to-date version of the tools, consult the update center in your installation.
Table 3.5. Code-coverage tools supported by SonarQube
| JaCoCo | Embedded/Default | www.eclemma.org/jacoco |
| Cobertura | Embedded | http://cobertura.sourceforge.net |
| Clover (Commercial) | Plugin | www.atlassian.com/software/clover/overview |
| EMMA | Plugin | http://emma.sourceforge.net |
As we’ve told you, SonarQube isn’t only for Java gurus. It supports more than 20 languages that include their own code-coverage mechanism or integrate with popular external tools.
For instance, when analyzing a JavaScript project, the JSTest unit-testing framework is used by default to provide coverage reports. The PHP plugin uses PHPUnit, the Python plugin uses the Coverage.py toolkit, and so on. For a complete (and updated) list of the coverage tools included in a language’s plugin, we advise you to visit SonarQube’s online documentation.
In the following subsections, you’ll learn how to choose your favorite coverage tool (sorry, non-Java folks, but this feature isn’t yet available for other languages) and how you can adjust its settings to fit your needs.
3.3.1. Changing the default selection
You can change the default code-coverage tool on a project or global basis, but we strongly advise you to keep the default selection. If, and only if, you have very good reasons to change it, then do it for all your projects. There are some differences that aren’t terribly important among code-coverage tools regarding how coverage is calculated. See “Code Coverage Tools (JaCoCo, Cobertura, Emma) Comparison in SonarQube”[1] for a comparison of the supported code-coverage engines supported by SonarQube. Using different tools for different projects would not only be disorienting as you browsed from project to project, but would also make comparisons of project health across your portfolio difficult, if not meaningless.
1 Papapetrou, Patroklos, “Code Coverage Tools (JaCoCo, Cobertura, Emma) Comparison in Sonar,” Only software matters, December 19, 2012, http://mng.bz/hjgg.
To make a global change, navigate to the global configuration page and select the Java category from the General Settings options. Then set the sonar.java.coveragePlugin property to one of the accepted inputs: jacoco (default), cobertura, clover, or emma. Note that although the tool names themselves are proper, the recognized values for this setting are in all lowercase. Once you’ve entered your choice, click Save Java Settings, and run a new analysis for each project. That’s it! You’ve made the switch, and the coverage metrics you now see are coming from your new tool of choice.
The code-coverage tool property is under the Java category settings. That means changing its value affects only Java projects. Other languages supported by SonarQube may provide similar configuration for code-coverage engines, so you’re advised to look at the corresponding category under the global or project settings.
The same attribute is also available under project configuration settings, so you won’t find it hard to change the code-coverage tool for a single project—even though it’s not a good idea to do so.
Each supported code-coverage tool, whether it’s embedded in SonarQube or not, provides some advanced settings. The majority of these properties are available only at the project level, but some can be applied globally, and a few can be set on a peranalysis basis (see appendix B). For a complete list of available settings and their meanings, you can browse SonarQube’s online documentation about each code-coverage plugin.
3.4. Integration testing
Integration testing (IT) is today what unit testing was a decade ago. Unit testing is not enough for complex systems, and no software is considered well-tested if there aren’t adequate integration tests to cover program features.
IT focuses on testing source code not in isolation (like unit testing), but in a production-like environment with all the external resources that implies. For instance, a JavaEE application runs on an application server, stores and retrieves data in a database, and takes advantage of services provided by frameworks such as EJB and JSF. Unit testing must fake these interactions by using mocking tools such as Mockito, jMock, EasyMock, and others. But IT validates the system directly against all these resources.
Originally this was a manual process, typically involving (for a web app) a web server, a browser, and a human, with the same process over and over: compile the code, build the artifact, and deploy the project. Then access it with a browser, and start manually testing each feature and interaction. At the beginning of a project, this process was quick and easy because the functionality was still limited.
After weeks of coding and adding new features, the process would become more and more time-consuming—and boring. How do you stay engaged when you have to check and recheck the same functionality over and over again, especially when it hasn’t changed? After a few weeks or months, this practice can drop in importance from “necessary” to “necessary evil,” and it’s often abandoned sooner or later.
Fortunately, this has changed in the last couple of years, and integration testing—automated integration testing—is considered as valuable today as unit testing. No matter what programming language is used, plenty of tools allow the automation of integration tests. Once you’ve got your tests set up, SonarQube lets you track integration test metrics separately from unit tests, so you can retain clarity on each.
3.4.1. Displaying integration testing coverage on the dashboard
SonarQube provides a separate widget for integration-test metrics. It’s not on the dashboard by default, but it’s easy to add; you’ll find it in the dashboard configuration in the Tests group. We’ll look at it in a minute, but before we do, we need to point out some things:
- At the time this book was printed, integration-test metrics were supported in Java, C#, and Python projects. It’s likely that this has changed, so you’re advised to browse SonarQube’s online documentation for the most updated information (http://docs.codehaus.org/x/opS7DQ). Both authors have a Java background, so the material taught in this section is Java-centric; but similar concepts apply to other languages, too.
- You should use JaCoCo to create the IT report. It can be used to calculate IT metrics no matter which tool or application was used to run these tests (Maven Surefire Plugin, Maven Failsafe Plugin, Ant scripts, Selenium, Arquillian, Html-Unit, and so on).
- Instruct SonarQube to reuse JaCoCo reports by setting the property sonar.jacoco.itReportpath to the report file produced by JaCoCo.
- You can still use your favorite coverage engine to compute unit-testing metrics.
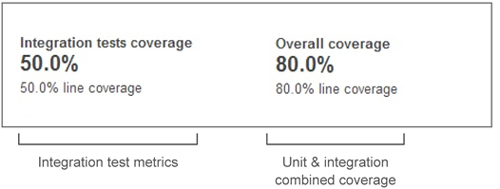
Figure 3.12 shows the integration test coverage widget, which is similar to the one for unit-test metrics. But unlike the unit-test widget, the integration-test widget doesn’t give any information about the tests themselves; it only shows how well they cover your code. Furthermore, the Overall coverage section describes the combined coverage of both unit and integration tests. We find this information useful, because there are cases where unit tests are meaningless but we still want to aggregate both metrics in one result.
Figure 3.12. Integration-test widget
The metrics for IT coverage are the same ones we looked at for unit tests in section 3.1.2. Getting reports on unit-test coverage metrics. We gave you the formulas then, but it’s been a while, so here’s a brief reminder:
- Line coverage % is the density of lines that are executed at least once during integration-test execution.
- Branch coverage % is the density of branches that are covered at least once during integration-test execution.
- Test coverage % is a combination of line and branch coverage.
At the file level, the integration-test data is ... well, integrated with the unit-test coverage information, so getting to it is the same as what we looked at earlier. Click-through on a test-coverage metric, and choose a file in the drilldown. Once you’re there, you’ll see a familiar presentation enriched with new metrics and features.
3.4.2. Getting IT information in the source code Coverage tab
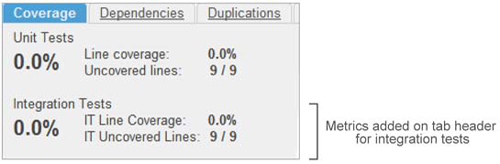
Enable reporting on integration test coverage, and after the next analysis, you’ll see a couple of changes in the file detail Coverage tab. First, the header now has an additional row for integration-test metrics. They’re calculated with the same formulas we looked at for unit testing, but they’re named slightly differently to reflect their meanings, as shown in figure 3.13.
Figure 3.13. Source code Coverage tab with IT metrics
Now look at the dropdown that lets you pick your source code view. Again, you see changes, as shown in figure 3.14 and explained in table 3.6.
Figure 3.14. Coverage tab view selection—enriched with IT choices
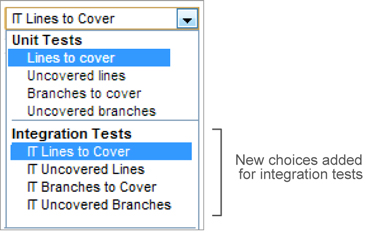
Table 3.6. Integration-test metrics
|
Description |
|
|---|---|
| IT Lines to Cover | Displays all lines of code that need to be covered by integration tests. Header information, package declaration, and library imports aren’t displayed. This number includes both uncovered lines and lines already covered by integration tests. |
| IT Uncovered Lines | Displays lines of code that aren’t covered by integration tests. |
| IT Branches to Cover | Displays all possible branches that need to be covered by integration tests. This number includes both uncovered branches and already-covered branches. |
| IT Uncovered Branches | Displays branches that are uncovered or only partially covered by integration tests. |
3.5. Related plugins
We’ve mentioned the EMMA and Clover plugins, which offer integration with those two coverage engines. But a complete testing strategy should probably include more than just unit testing, or even unit and integration testing combined. Ideally, it would also include functional and/or acceptance testing.
In this section, we’ll discuss a testing-related plugin that adds functional/acceptance testing metrics by integrating SonarQube with Thucydides’ open source library. We think it’s worth your attention, and we suggest you give the plugin a try because it’s particularly useful if you already use Thucydides or plan to do so.
There are a couple of plugins we decided not to cover in this book (JMeter and Green-Pepper) because they’ve been inactive for more than two years. If you’re interested in them, visit SonarQube’s online documentation to find installation and configuration instructions.
Thucydides is one of the most promising acceptance-testing frameworks. With Thucydides, you can model your requirements and define acceptance criteria in a simple way by using Java and JUnit or a business-driven development (BDD) tool such as easyb (http://code.google.com/p/easyb).
Business-driven development (BDD) is a software development practice that focuses on modeling business needs and user requirements so that all team members (developers, analysts, customers, and so on) acquire the same knowledge about the system under development. The modeled specifications are transformed into an IT solution. The most important thing about BDD is that requirements are reevaluated constantly to improve the business process during the development process.
The Thucydides plugin feeds SonarQube with metrics gathered during acceptance-test execution and presents them in a relevant widget. Before installing the plugin, we suggest you look at the online documentation (www.thucydides.info/documentation) or visit the official web site (www.wakaleo.com/resources/thucydides), where you can also find other interesting resources.
To add Thucydides metrics to your dashboard, click the Tests category filter and add the widget named Thucydides Acceptance Tests. Then run a new analysis of your project that contains Thucydides tests. What you’ll get is shown in figure 3.15.
Figure 3.15. Thucydides plugin widget
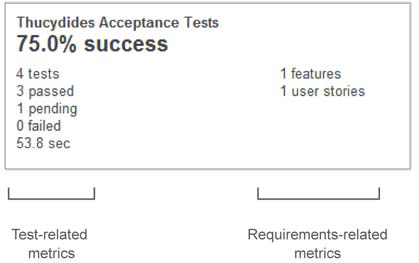
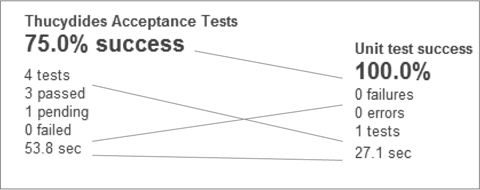
On the left is a list of metrics reminiscent of the default SonarQube test-coverage widget. Figure 3.16 illustrates the major similarities between the two widgets. First you see a report about the density of successful tests, and then the total number of executed tests. After that, you get information about how many tests have passed, how many are pending (not executed), and the number of failures. Finally, the widget displays the total execution time.
Figure 3.16. Thucydides acceptance-test metrics mapped to unit-test metrics
On the right side of the widget are two numbers indicating the total features and user stories tested by Thucydides. If you feel lost regarding these terms, keep in mind that one feature is composed of one or more user stories. For instance, imagine the feature Search Customers. A user story might be Search by Surname, and another one could be named Search by Social Security Number. For every user story, you can write as many tests as you need.
The current version of the plugin supports only Maven projects and doesn’t execute the Thucydides tests. But it expects to find them in the predefined location of a Maven project structure, so you don’t have to worry about additional configuration.
If you’re in the mood to evaluate SonarQube testing plugins, be sure to try both Thucydides and its related plugin. Acceptance testing is an evolving field in the IT industry and is currently taking its first baby steps. The fact that more and more companies are in the process of including acceptance tests as part of their development lifecycle makes us believe that there is more to come on this topic.
3.6. Summary
Do you use unit testing today? Are your numbers where they should be? In this chapter we discussed the importance of unit testing, how it helps you know that your methods are doing the right things, and why it’s important to have full coverage (both line and branch). We looked at SonarQube tools that help you find the chinks in your testing armor, and we delved into how to use SonarQube for integration testing.
We gave you a detailed overview of the features in SonarQube, including these important points:
- Testing metrics are organized in two categories: code coverage and tests.
- Click the value of any code-coverage metric on the dashboard, and you can get down to the file level to quickly see which lines aren’t covered by tests or are only partially covered.
- Click the value of any test metric, and you can obtain a list of tests in a given file with status indicators for the last run of each.
- Integration-testing code coverage is easier than ever thanks to SonarQube’s embedded JaCoCo plugin.
- Open source plugins provide integration with third-party tools and calculate metrics for load and performance testing, and acceptance and functional testing.
We hope we’ve so thoroughly inspired you that you’re ready to start analyzing every one of your company’s projects and spread the word to your co-workers and your manager. At this point, you’re beginning to feel the power of SonarQube, but you have much more to learn. Get ready for more metrics and more quality. The code-duplication quality axis comes next, and it reveals the darkest aspects of your code base.