
Chapter 10. Letting SonarQube drive code reviews
- Reviewing code in SonarQube
- Creating manual issues: when the rules aren’t enough
- Tracking issues
- Planning your work with SonarQube’s action plans
In this chapter, we’ll talk about how to use SonarQube in a code review, one of the most loved/hated, revered/maligned duties of a coding team that (almost) never gets done. There are a lot of reasons for skipping code reviews, among them that there’s no starting place or that people will feel picked on. But centering your code review around SonarQube can alleviate or eliminate many of the classic excuses. It will also help you organize and manage your code-quality efforts through issue confirmation, commenting, assignment, and severity adjustment. When you find the occasional dud issue (it happens once in a while), we’ll show you how to handle it without tossing the baby out with the bathwater.
Once your issues are commented and assigned, you’ll want to keep track of them. SonarQube provides three mechanisms: email, search, and a dashboard. Beyond that, there’s also the ability to group issues and schedule them into action plans. After we’ve shown you everything SonarQube has to offer on the subject, we’ll finish with a discussion of the fundamental reasons to have code reviews. Reasons that address the growth and development of your team members. Reasons that existed before SonarQube came along and that will remain long after you’ve paid down all your technical debt (yes, it will happen eventually!).
We’ll talk about those reasons, and we’ll tell you how we’ve seen effective code reviews structured to achieve the goals of giving developers a safe place to talk about code—whether it’s what they did yesterday that they’re proud of, what they did yesterday that maybe they shouldn’t be proud of, or what they would like to get the team on board for doing tomorrow.
The excuses for skipping code reviews are as varied and colorful as the people making them, but like taking the time to buckle your seatbelt, you don’t have time not to have code reviews. With SonarQube on board, you’ll find them both painless and productive.
10.1. Reviewing code in SonarQube
Let’s say a coworker installed SonarQube on the spare box under her desk before the last sprint. She’s been feeding it code ever since, and now that you’re between sprints again, she’s showing you the project’s SonarQube dashboard. If your team is typical, you’re staggered by the number of issues alone, not to mention the number of duplicated blocks. And you don’t even want to think about the complexity scores.
You may be tempted to shoot the messenger, but you’d be better off scheduling a code review. Not the kind where two developers sit down one-on-one to go over what one of them has just done, but the other kind, where everyone is in a room together (literally or virtually). It’s a semiformal meeting with a public agenda, and it’s what we’ll focus on here. It can be held with or without SonarQube; but with SonarQube will be a lot better than without, because as good as it is at finding problems, SonarQube is about more than just showing you what you’ve done wrong. It also provides a platform for managing solutions.
There are many ways to run code reviews and many ways you can use the solution-management tools SonarQube provides. Using the two together (SonarQube’s tools in the context of a code review) makes a particularly effective combination, so that’s the context we’ll use to explore what SonarQube offers.
10.1.1. Issues: a starting point
One of the common reasons people give for avoiding code reviews is that there’s no good starting point. Navigate to the SonarQube issues drilldown, and you’re likely to find that this is no longer the case, as figure 10.1 shows.
Figure 10.1. Arriving at the issues drilldown from the left-hand menu (not visible here) shows you all issues in all classes and all packages.
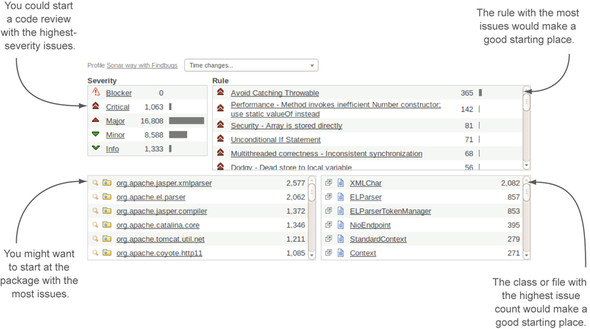
In the issues drilldown, most teams are presented with a wealth of options for picking a starting point. The obvious choice is the highest issue severity with a non-zero count (Critical, for the project shown in figure 10.1), but some might want to start in the worst package, or in the single class with the most issues.
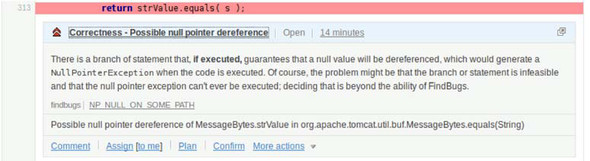
Whatever you choose, drill down until you’re looking at issues. In each issue block, you see the issue title, a little extra detail on the issue, and, if you’re logged in, a row of links, as shown in figure 10.2.
Figure 10.2. SonarQube does more than show you what the problem is. If you’re logged in, it also gives you links to workflow functions at the bottom of each issue block that let you actively manage the problem.

Sometimes it’s not obvious to every member of the team why an issue was flagged, or why it’s considered an issue. Even when the problem is obvious, it’s not always clear how to fix it. Clicking the issue title here adds a little more information in line: the rule description. Sometimes it’s detailed and helpful, as with the one shown in figure 10.3. Other times, it’s only a slightly longer restatement of the issue title (for those cases, chapter 14 will show you how to augment the description to make it more helpful).
Figure 10.3. Clicking the title of an issue adds more detail in line. Sometimes the information it offers is helpful. Other times it’s just a longer version of the issue title.
Once everyone on the team understands an issue, you’ll probably want to do something about it. At the very least, you’d probably like to mark it as reviewed, and maybe annotate it with the outcome of your team discussions. This is where the last line of the issue block comes into play. Each link there is a workflow option. For each issue, you can use SonarQube’s workflow to track the notes and decisions the team makes about an issue.
10.1.2. Confirm, comment, and assign: the simplest workflow options
The first three workflow options are simple, both to understand and to use: confirmation, commenting, and assignment. The simplest option is confirmation. You use this once an issue has been evaluated and you’re sure it actually is a problem. (For the cases where you can’t confirm an issue, you may want to use the false-positive option, which we’ll cover later.) The ability to confirm issues is particularly useful when you’re dealing with a legacy application with a large backlog of technical debt. You can’t address every issue right away, but at least you can keep track of your progress as you work through evaluating your technical debt. Using it couldn’t be simpler: click the Confirm link. There will be a blink, and when you look again, the text will have changed to Unconfirm.
Of course, once you’ve taken the time to understand an issue in its context, you may want to do more than simply confirm it. You may want to annotate it with your findings. That’s where the comment function comes in. It’s almost as easy to use as Confirm. To start, click an issue’s Comment link, and you’ll see a text box added to the interface. When you submit the comment dialog, your comments will appear at the bottom of the issue block in a running log. Figure 10.4 shows both the before and after, with the comment dialog on top and the result at the bottom.
Figure 10.4. You can make as many comments as you like on an issue. They’re shown in a running log.
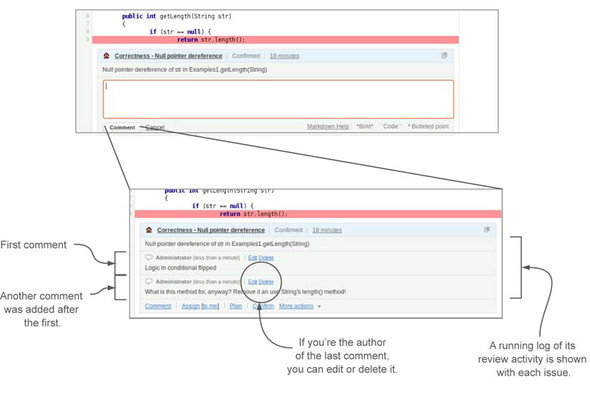
You can comment on an issue as many times as you like, and each comment is added to the bottom of the log. If you’re the author of a comment, you can edit or delete it.
If you’re browsing through SonarQube by yourself, you might use a comment to start a discussion. In a group setting, comments are often used in a “this needs further investigation” kind of scenario. What you don’t want to do is make comments in SonarQube that have lasting value to the code base; those belong in the code. When it’s time to move beyond simple confirmation and commenting, you can assign an issue to any SonarQube user (we’ll talk about setting up user accounts in chapter 12). To do so, click Assign in the issue block. Figure 10.5 shows the assignment form and results.
Figure 10.5. The assignment form lets you assign the cleanup of an issue to any user SonarQube recognizes or auto-assign it to yourself.
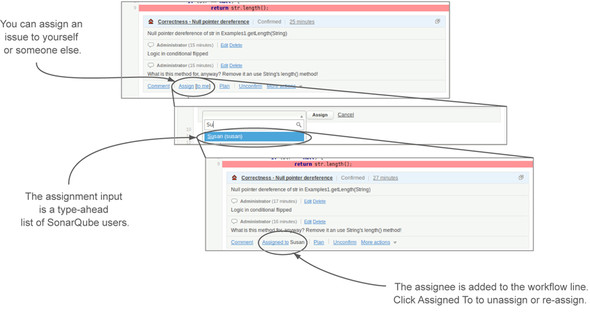
Once an issue is assigned, the name of the assignee is shown in the workflow line, and the workflow option changes from Assign to Assigned To, followed by the name of the assignee. Issue assignments appear not just on the issue itself but also in the Issues dashboard and listings covered later in this chapter. They’re also viewable to the assignee through the Eclipse integration discussed in chapter 11, where you can not only see the issue in context but also do something about it!
Don’t think an assignment is a permanent sentence. If priorities or workloads change, it’s easy to reassign or un-assign issues. To do either, reopen the Assign dialog by clicking Assigned To and submit it using the Assign button with either a new name or no name at all in the Name field.
10.1.3. False positives: sometimes SonarQube gets it wrong
As you and your team work through the issues in your project, you may find some cases where SonarQube (or the rules engines it runs) just plain gets it wrong. Before you start to lose confidence in the system, know that this kind of thing doesn’t happen often. There are certain situations that the rules engines aren’t yet sophisticated enough to evaluate properly. But in the vast majority of cases, the things that are flagged in SonarQube as potential problems actually are problems.
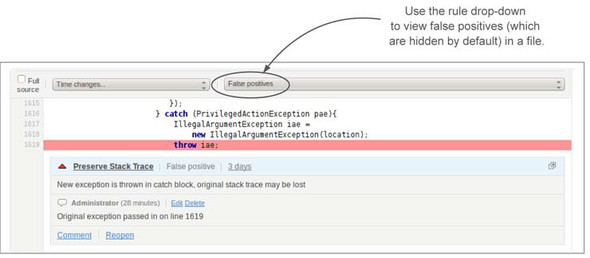
The code shown in figure 10.6 is flagged as violating the Preserve Stack Trace rule because it catches one issue and throws a new one. What the rule engine missed is that the stack track of the original issue is explicitly preserved in line 1619.
Figure 10.6. SonarQube sometimes flags code that complies with the rules.

That means the issue in figure 10.6 is a false positive. When you find one of these, SonarQube gives you a handy way to take care of it, but it’s a mechanism you’ll want to use sparingly. The False-Positive link tucked under the More Actions menu at the bottom of the issue block flips the issue status to False Positive. The issue marker stays on the page until you browse to another file, but the next time you come back to this file, the issue will be gone. (It’s still in the database; you just won’t see it by default anymore.)
There’s no automatic opportunity to comment when you mark an issue false positive, but we highly recommend that you follow (or precede) any use of the false-positive function with a comment. A brief note about why you think it’s a false positive will go a long way toward making your thinking clear to anyone who comes after you. Don’t be afraid to be wordy. The more detail you give, the more your colleagues can see your reasoning and trust your judgment, and the less likely it is that you’ll be tracked down to explain in person.
Commenting on false positives is particularly important when the line of code that saves an issue—the one that makes it a false positive—is different from the line of code flagged with the issue. In the example in figure 10.6, line 1619 saves the issue. But figure 10.7 shows what happens after an edit and subsequent reanalysis.
Figure 10.7. Once an issue is flagged as a false positive, SonarQube won’t re-report that issue as long as the flagged line hasn’t changed.
Note
Marking an issue as a false positive makes SonarQube blind to that particular rule on that particular line until the line changes.
Originally, the issue in figure 10.6 was saved by setting the root cause from the original exception into the new exception. Remember, the code originally looked like this:
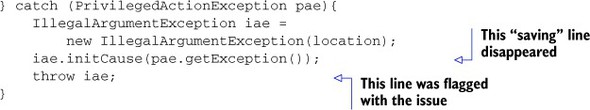
But by the time you reach the state shown in figure 10.7, edits to the file have removed that call. This is no longer a false positive.
Unfortunately, the line flagged with the false-positive issue hasn’t changed, so SonarQube won’t re-raise the issue. This implies two things:
- You should use the false-positive mechanism sparingly.
- You should review your false positives occasionally to make sure they haven’t reverted.
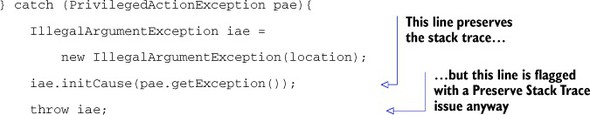
Fortunately, there are a few saving graces in this situation. Because SonarQube always records the “who” and the “when” of any action performed on an issue (more on this soon), you know whom to ask about this particular false positive. And because the reviewer commented, there is some record of what she was thinking at the time.
Unfortunately, her comments didn’t contain quite enough detail, because what’s now on line 1619 certainly isn’t the preservation of the stack trace. On the face of it, it looks as though the reviewer was either fogged by cold medicine or temporarily insane when she marked this as a false positive. Based on the issue’s time stamp and the source control logs, she should be able to prove her sanity. But if her comments had been just a little more detailed, she wouldn’t have to.
The final thing to consider in this situation is how the whole mess could have been avoided. Often SonarQube presents you with things you may see as no big deal. The situation shown here in its original state is obviously one of them. In this case, the easy way out was taken. The issue was marked as a false positive. But there was another way to address the question.
Recall that the flagged code originally looked like this:
A tidier way to handle the problem would have been to use the IllegalArgument-Constructor that accepts both a Throwable and a String. Here’s the new version of the problem code:
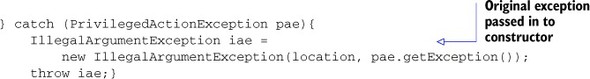
Because in the new version the original exception is passed in to the constructor, the rules engine is satisfied that the stack trace will be preserved, and the issue goes away entirely.
It’s slightly more work but far closer to bulletproof.
10.1.4. Changing severity: not every issue is that bad
After full-out false positives, the next point of wiggle room is issues that aren’t as bad as SonarQube makes out. For instance, the Boolean Expression Complexity rule checks the number of clauses in conditionals and flags anything with more than three. By default, it’s a Major.
Imagine that your teammate, Joe, has checked in some changes that got flagged with (among other things) Boolean Expression Complexity. The rule’s threshold is set to three. Joe’s code has four.
Susan thinks you should just mark it false positive and move on, but after team discussion, you all agree that it could (and should) be simplified. You also agree that it’s not of Major importance. This is where Change Severity comes in. You’ll find it under the More Actions menu. Choose it, and a Severity drop-down will be added to the workflow area as shown in figure 10.8.
Figure 10.8. Look for the Change Severity option under More Actions. The dialog that’s added presents a severity drop-down and a comment input. Once you submit the form, SonarQube confirms your severity change by immediately showing the new severity in the issue block.
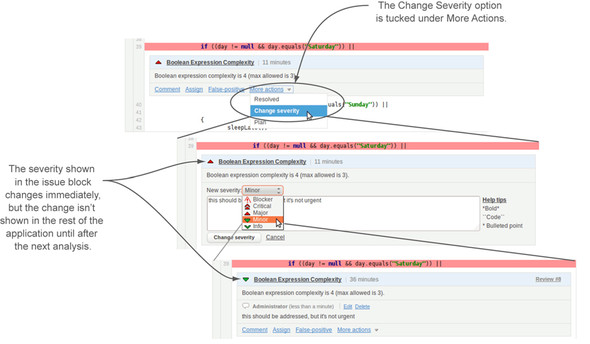
After you submit the dialog, the severity in the issue block is updated immediately, but the change won’t appear anywhere else in the interface until after the next analysis.
10.1.5. Altering the code to make SonarQube turn a blind eye
In dealing with issues, SonarQube gives you one final tool: the //NOSONAR comment. SonarQube will almost completely ignore issues on any line that ends with //NOSONAR. Why would you want that? If you deal with multiple code branches, it may be easier to hide a false positive from SonarQube with //NOSONAR, rather than having to mark the false positive in every branch you’ve got under analysis. Another reason is that sometimes there are cases where you must violate a rule. For instance, there are (poorly written?) libraries whose methods throw Exception itself, the raw, generic type, rather than some subtype. To use those libraries you must either catch Exception, which SonarQube flags as an issue, or rethrow it, also an issue.
When you find yourself in this situation, you could mark the issue as a false positive. That would certainly clear it out of your dashboard. The only problem is that it’s not a false positive. You actually are catching or rethrowing Exception.
You could try ignoring it, but experience shows that that doesn’t work well. So the next best option is to end the line that SonarQube marks with the issue with the //NOSONAR comment. Best practices here say that after //NOSONAR, you’ll end the line with the reason you’re having SonarQube ignore issues.
If you’re coding in Java or C#, the languages that are analyzed partly with SonarQube-native code and partly with other rules engines, you may also have the option of using engine-specific markup to hide some issues from SonarQube. For instance, the PMD rule engine for Java recognizes a //NOPMD comment, which has an effect similar to the //NOSONAR comment, but it’s limited in scope to just PMD. Because SonarQube uses PMD for some of its rule checking, if PMD can’t see an issue, SonarQube won’t see it either. Similarly, Findbugs and FxCop offer method-level annotations and attributes to turn off specific rules for that method. Again, if the rule engine can’t see an issue, it won’t be reported to SonarQube.
One more tool is available for Java: the @SuppressWarnings annotation, used at either the method or class level. You specify either "all" or specific rule keys, for usages like this:
@SuppressWarnings("all")
@SuppressWarnings("rule_key")
@SuppressWarnings({"rule_key","another_rule_key","and_so_on"})
Note that these aren’t changes you can make from the SonarQube interface. You must return to your IDE to add this markup, then rerun analysis to see it take effect. If you’re using the //NOSONAR comment, be aware that SonarQube will henceforth ignore all issues on that line, not just the one it’s currently flagging. So this is another powerful tool that should be used with a light hand.
Note
Use //NOSONAR sparingly because it makes SonarQube ignore all issues on a line.
Earlier we said that the //NOSONAR comment makes SonarQube almost completely ignore issues on the commented line. There is one rule available, although it isn’t included in any of the provided profiles, which counts instances of //NOSONAR. Its default severity is Info, and it gives you a way to track these uses. See chapter 13 for a discussion of rule profile management. All the methods in this section will suppress issue detection, but the //NOSONAR comment is the only one that’s easily trackable, so it’s the one we prefer.
10.1.6. Viewing the audit trail
We mentioned earlier that SonarQube records every action performed on an issue. Now it’s time to show you how to find that audit trail. You may have noticed that SonarQube displays each issue’s approximate age in the top line of the issue block. Click the age, and you’ll see everything that has happened to the issue since it first appeared in SonarQube, as shown in figure 10.9.
Figure 10.9. Tucked under the issue age, so it doesn’t clutter the interface by default, is the issue’s audit trail. Here you can see what actions have been performed on an issue, when, and by whom.

10.2. Creating manual issues: when the rules aren’t enough
SonarQube gives you a number of mechanisms to manage the code issues it finds. As good as they are, the tools that SonarQube uses to find anti-patterns in your code will never cover all the bases. Even if they did, you’d probably still find that you wanted to use SonarQube’s issue mechanism to track things that don’t break coding rules, like duplications you’ve decided to target for immediate elimination, or parts of the API that need commenting, or just everyday refactoring.
Because the SonarQube issue mechanism allows you to track work on your code base almost directly in your code base, it has a compelling immediacy—the kind that makes you want more. That’s why SonarQube lets you create manual issues.
10.2.1. Why you would want extra issues
Returning to our imaginary code review, it’s progressing nicely. You’ve worked through a good number of your top-severity issues, and the team is starting to settle into it when you stumble across a method signature that looks like this:
public String removeFromInventory(String userId, Date requestDate,
    String departmentId, String organizationId, String itemId, int qty,
    String reason, float price, int discountPercentage);
Once the team finishes discussing the benefits of request objects versus long tangles of arguments, you all agree that this should be addressed. You’ve gotten into the swing of assigning issues and would like to do that here. But...it doesn’t break a rule. There is no issue to assign.
Fortunately, SonarQube allows you to mark your own issues on the fly. These home-grown issues will appear in all the same places and act in all the same ways as the automatically generated ones. Beyond that, they also give you the ability to manage something else: your test code. You won’t see SonarQube automatically flag issues on your unit tests, but you can create manual issues on them. So with manual issues, you have the flexibility to manage all your quality concerns through the same mechanisms.
10.2.2. Making manual issues
To begin marking manual issues, you’ll first need manual rules. SonarQube administrators can create them through the Manual Rules management screen (Settings > Configuration > Manual Rules), which is shown in figure 10.10.
Figure 10.10. Manual rules consist of a name, and a description, which is used in the pop-up you get when you click the rule title in an issue block.
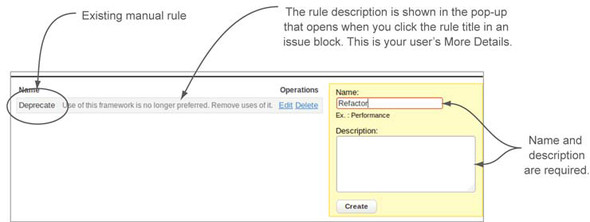
Enter the name of your new rule and its description, and click Create. Once the rules are in place, anyone who can use the issue workflow functions can create a manual issue. The way to start is by clicking the plus sign that pops into the left column as you mouse over code. Figure 10.11 points it out. When you do, a familiar-looking form is added to the interface, as shown in figure 10.12.
Figure 10.11. To get started with a manual issue, click the plus sign that seems to follow your mouse in the left column of views that show code.

Figure 10.12. The manual issue form lets you choose the rule to use and requires you to fill in a comment. Once entered, manual issues looks just like their “automatic” siblings.
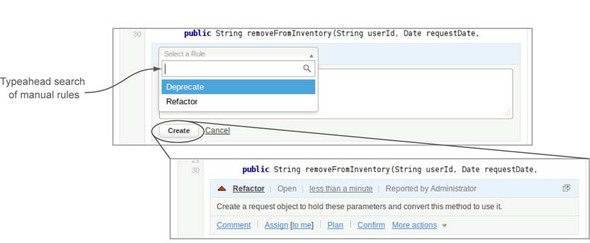
In the manual issue form, the rule and comment are required. Once this form is submitted, you’ve got a new issue that looks and acts just like any other; you can perform all the additional workflow functions you’d like on a manual issue.
10.3. Tracking issues
Now that you’ve confirmed, commented, severity-adjusted, and assigned out all those issues, you might be wondering how you’re going to keep track of them all without having to re-find each one in the issues drilldown every time you have a question about it. Fortunately, SonarQube provides three mechanisms for keeping an eye on issues.
The first mechanism is your inbox. Individual users can choose to be notified by email of changes to issues they created or which are assigned to them. It’s off by default, but turning it on is pretty simple. Choose Configuration from the top bar, then My Profile in the left rail, and turn this option on under Notifications.
The other two tracking mechanisms are the public interfaces that this section covers. At the global level, there’s a cross-project issue search; and at the project level, there’s a dashboard that’s dedicated to issues.
10.3.1. Life cycle of an issue
Before we go any further, it’s useful to understand the life cycle of an issue. There are five possible statuses in the life of an issue: open, confirmed, resolved, reopened, and closed. Issues that are open, confirmed, or reopened are considered active. Issues that are resolved or closed are inactive. Figure 10.13 shows the status transition diagram for issues.
Figure 10.13. The status-transition diagram for most issues

Basically, once opened, an issue can only be closed by SonarQube. That happens when a subsequent analysis shows that the underlying cause has been eliminated. In the meantime, a developer might mark an issue as resolved (using the Resolve workflow option in the More Actions menu or via the IDE integration we’ll discuss in chapter 11), indicating a belief that he has fixed the problem. If he’s right, the next analysis will close the issue. If not, it’s reopened. If you notice before the next analysis that your resolve-happy developer is wrong about his fix, you have the option of manually reopening the issue.
Inactive issues have one of three resolutions: false positive, fixed, or removed. Fixed issues are ones that have either been marked resolved, or ones that have been closed by SonarQube. Removed issues are ones associated with a rule that’s no longer in the profile the project was last analyzed with. There is one exception to the issue life cycle you’ve just seen: manual issues.
Manual issues
Manual issues are never closed. SonarQube relies on its underlying rules engines to tell it when an issue has gone away: when to close an issue. But because a manual issue wasn’t raised by a rules engine, no rules engine can put it to rest, as shown in figure 10.14.
Figure 10.14. Manual issues are never closed because there’s no rules engine that can “rule” on them.
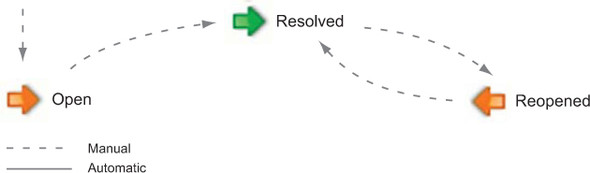
The best that can happen is that you (or the assigned developer) manually resolve the issue, just as you manually created it. Like other issues, it can also be manually reopened. The upshot is that if you decide to use manual issues, you may need to do a little extra policing to keep your projects tidy.
Issues dashboard
We mentioned earlier that SonarQube provides two levels of visibility into issues in aggregate: the project level and globally, across projects. At the project level, you can use the Issues link in the left rail to reach the Issues dashboard. Whereas the main dashboard is dedicated to helping you track your project’s quality metrics, this dashboard is devoted to tracking your work on improving those metrics.
Unresolved issues by status widget
The first is the unresolved issues by status widget, which is shown in figure 10.15. This widget gives an overview of active issues: basically, the work left to be done. You can click-through on any of the numbers to be taken to a list of the relevant issues.
Figure 10.15. The unresolved issues by status widget gives an overview of all active issues.
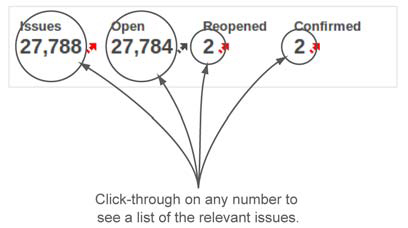
Some of the widgets on this dashboard update as you make changes to issues, but this particular one doesn’t. The numbers in this widget are considered metrics, and metrics are updated only during an analysis. So don’t be alarmed if you work through reviewing a big batch of issues only to see these numbers unchanged when you check the Issues dashboard. SonarQube hasn’t lost your changes; it just hasn’t updated yet.
Unresolved issues per assignee
The unresolved issues per assignee widget gives issue assignment counts per developer. Click-through on a developer’s name to see a list of the particular issues assigned to her. These numbers are updated on a live basis, not during analysis.
My unresolved issues
The my unresolved issues widget shows a live list of issues. This time you get issue severity, title, and age. Figure 10.16 shows the widget.
Figure 10.16. The my unresolved issues widget shows issue severity, title, last modified date, and most recent comment on the first five issues assigned to the logged-in user.

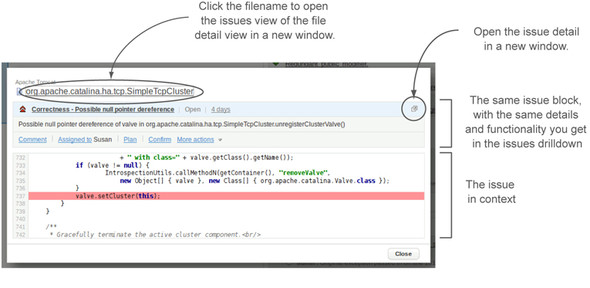
This paginated widget is limited by default to five issues per page, but that number is configurable. See chapter 14 for more detail. You can click-through on the issue title to see an issue summary much like what you get in-line in the issues drilldown, as shown in figure 10.17.
Figure 10.17. Clicking the title of an issue displays an issue summary presentation very like what you see in the issues drilldown. It doesn’t pop up in a new window, but rather as an overlay in the current page. You can close it using either the Escape key or the close button at lower-right on the screen.
Almost universally throughout the SonarQube interface, you can click the title of an issue to get this pop-up. The one exception is in the issues drilldown, where you’re basically already looking at this presentation. There the “issue title” is actually the title of the rule the issue breaks. In that context, clicking the title adds detail about the rule to the issue block, as you saw earlier.
10.3.2. Tracking squashed issues
Earlier in this chapter, we looked at three different ways to hide or moderate an issue other than fixing it: marking it as false positive, changing the severity, or hiding it altogether with the //NOSONAR comment. Each of these methods is powerful and potentially dangerous, and ought to be monitored. Fortunately, the tools exist to do that.
False-positives widget
The false-positives widget, which is already on your Issues dashboard, is nearly identical to the my unresolved issues widget. It tracks what you would expect—false positives—and gives you a quick way to drill down to the details.
For the other two methods, you have to install plugins and add their widgets to your dashboard. Neither of those operations is hard, and the results are worth the effort.
Taglist widget
The taglist widget allows you to track instances of the //NOSONAR and //TODO comments.
The //NOSONAR comment you’ve seen. The //TODO comment reminds the developer that more needs to be done in some area of the code. Some IDEs automatically insert //TODOs into auto-generated methods; and because most Java IDEs offer TODO-list tracking, some coders use it manually to set reminders.
You have to add a rule to your profile for each of these tags. Once you do that and add the widget to your dashboard, your next analysis should show you something similar to figure 10.18.
Figure 10.18. The taglist widget tracks //NOSONAR and //TODO comments, offering click-throughs to the files involved.
The taglist widget offers click-throughs to the files that hold the flagged comments. Drill down here, and you land at the file’s source view, where you can use your browser’s find functionality to jump to the comment of interest. Or, because you had to turn on issues to be able to make these counts, you could click over to the file’s Issues view and use the issues drop-down menu to zip right to the comments you’d like to see, as shown in figure 10.19.
Figure 10.19. The taglist widget’s underlying mechanism is a pair of issues, so you can either search the Source view for the relevant comment or flip over to the Issues view and use the drop-down menu to see the flagged comments.

Manual severity widget
The manual severity widget is one of the widgets offered in the Widget Lab plugin. To use it, install the plugin and add the widget to your dashboard. It immediately begins showing any issues where the issue severity was adjusted.
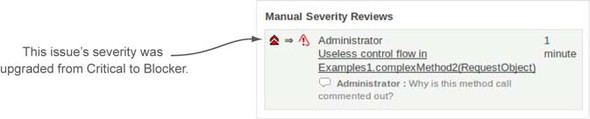
It looks much like the other issues widgets you’ve seen, with one exception. Instead of showing just the issue’s current severity, it shows both the original and current severities, as shown in figure 10.20. At no other place in the SonarQube interface can you see the original severity of an adjusted issue, or even get an indication that the severity was adjusted.
Figure 10.20. The manual severity widget shows both current and original severities.
10.3.3. Searching issues
From the Issues dashboard, you can easily track the active issues in a project and keep an eye on the squashed issues. But if you want to see issues across projects, or non-active issues, you’ll need to use the issue search.
To run a search, start from the Issues link in SonarQube’s top menu bar. The search interface lets you choose which project to search in, which severities to show, and which statuses and resolutions to search against. You can also choose to search by creator and assignee.
The Project, Assignee, and Reporter fields work as type-ahead user lists, just like in the assign interface. Once your results are shown, you can again click an issue title to get to the issue detail pop-up. Now you can find all your issues, but how do you manage them? We’ll look at that next, with action plans.
10.4. Planning your work with SonarQube’s action plans
Most teams are faced with hundreds, if not thousands, of issues after an initial SonarQube analysis. Obviously, you’d like to fix them all. And ideally it would be done yesterday, but that’s not practical. SonarQube’s action plans help you structure the work.
10.4.1. Why bother with action plans?
Let’s return briefly to our code review scenario. You walked out of your first code review feeling pretty good about what the group accomplished. You worked through reviewing and assigning quite a few issues, and as a bonus, you caught some things that SonarQube didn’t flag but that need work anyway.
Now, as you start week two’s code review, there’s grumbling. Most people didn’t have time to work on all the issues they were assigned last week, and you’re going to assign more? Plus, the commits over the past week introduced new issues, and some folks are saying that eradicating them should be top priority, while others say you should concentrate on the legacy Blockers first. To head off a full-scale war, you decide to take a different tack and create some SonarQube action plans. Then you can decide as a team which new issues to fix immediately and which you’ll need to live with for a while.
SonarQube’s action plans allow you to group your issues and segment the work into phases, with the option of a due date per phase. Once the issues are grouped, action plans also help you track progress.
You can link assigned or unassigned issues to an action plan, so this week the team agrees to skip the assignments and use the code review meeting to pick which issues to link to the Phase 1 action plan. Then anyone who has free time next week can use the action plan like a job jar and grab something out of it to work on. When they do, they’ll have permissions to assign the issues to themselves, so there shouldn’t be any frustration about two people working on the same issue at one time.
10.4.2. Managing action plans
Before you can assign issues to an action plan, you need to create it. This requires project administration rights and isn’t something that can be done on the fly.
Start from the Action Plans link in the Configuration menu. Figure 10.21 shows SonarQube’s action-plan management interface.
Figure 10.21. The management interface for action plans presents a list of existing action plans on the left and an action-plan creation form on the right.
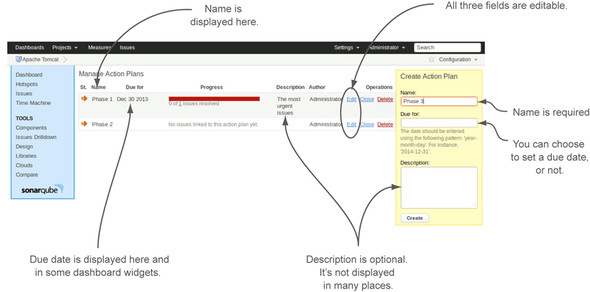
The action-plan metadata is simple: a name and, optionally, a description and due date. Each of those three elements is editable, and the edit mechanism is startlingly simple. Click the Edit link for an action plan, and the Create form becomes an Edit form with the plan in question prefilled. This is worth mentioning because it happens without a page reload. So if you’re not watching, you could sit around for a while waiting for your edit form to render, like we did the first few times.
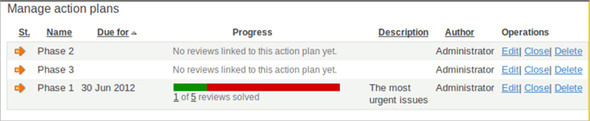
Once you have issues linked to a plan, which we’ll cover in a minute, issue totals and a colored progress bar appear in the Progress column, as shown in figure 10.22. Both the issue totals and the progress bar are linked to lists of relevant issues.
Figure 10.22. When you link issues to an action plan, a colored progress bar is added to the interface. The progress bar and accompanying issue totals are linked to lists of the relevant issues.
10.4.3. Using action plans
Now that you’ve created your action plans, you can begin assigning issues to them. You’ve probably already noticed the Plan option in the workflow section of the issues block. Choose it, and you’re given the ability to pick the action plan to assign. After you’ve linked the issue to a plan, the plan name is added to the issue block, as shown in figure 10.23.
Figure 10.23. Once your action plans are created, you can assign issues from the More Actions menu in the issues block. Choose the plan to use, and optionally add a comment.
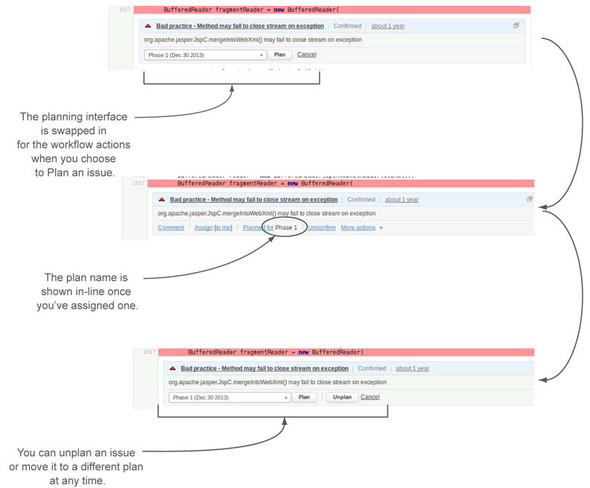
Plan assignments aren’t irrevocable: you can choose a different plan at any time. Alternately, if you want to un-plan an issue, go back to the Plan interface and click the Unplan button that’s added to the form when the issue has already been planned.
10.4.4. Tracking action plans
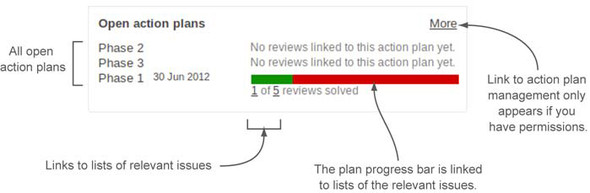
Once you’ve assigned a few issues to action plans, go back to the Issues dashboard, and you’ll see that SonarQube helps you track plan progress with the open action plans widget. The widget, shown in figure 10.24, displays a progress bar for each action plan. The More link goes to action-plan administration and appears only if you have plan administration rights.
Figure 10.24. The open action plans widget gives you an at-a-glance status of all your open action plans, with links to lists of the relevant issues.
10.5. Structuring a code review
We’ve spent quite a bit of time on how to make the most of SonarQube in the context of a group code review. But if you’re not already holding regular code reviews, it may feel like we’ve put the cart before the horse. If your team doesn’t make a habit of sitting down together to discuss code as a group, then you may be wondering how to bootstrap the process. Good code reviews can result in better cohesiveness both among team members and within the code base, but they require a little planning. Next we’ll give you the optimal answers to the basics: why, who, when, where, and how.
10.5.1. Why: talking about code
First and foremost, code reviews are important because they may be the only time your team has to sit down together and talk about the code. If your team is geographically diverse, then you may already be aware that more group time is needed on the code. On the other hand, if your team sits together, you may think there’s plenty of time to talk—folks sure seem to talk about weekends and spouses and sports over the cube wall. But while folks are talking about those things—and that chatter is more important than you may think for team relationships—they’re not talking about the code.
Even when they’re talking about code, it’s probably only in pairs or small subsets of the team as a whole. And in those conversations, information is being conveyed, or decisions are being made, that the rest of the team may not be privy to—even when they should be.
Setting time aside to talk about the code lets your team come together on things like these:
- How to tackle thorny problems in the code
- How the code is structured and where to find things
- Whether and how the structure should change
- The best ways to address major new requirements
- How to address technical debt
There are good reasons to do code reviews, but you’ll also hear a number of reasons not to do them:
- We don’t have time.
- They’re boring.
- We just end up arguing about style.
- There’s no need—we don’t have anything to talk about.
- There’s no starting point but to open a file at random and see if we find problems.
- People will feel picked on.
- People will feel left out.
The list could go on, but you get the point. As you’re probably aware by now, many of these things can be addressed directly by SonarQube. The rest can be handled with a little planning and structure.
10.5.2. Who
For a code review to be truly effective, every coder on the team should be included and involved. If no one works remotely, this should be fairly easy to arrange. But if your team is geographically diverse, you’ll want to pull in the remote workers via phone and web conferencing.
You want all the programmers in the room, but the folks you don’t necessarily need there are the managers. This may not go over well—especially when the code-review concept is still new. In that case, let the managers in, but ask them to remain inconspicuous. Remember, code reviews are a place for the coders to talk about code, and not everyone is comfortable speaking up in front of management.
Not only that, but it won’t take many iterations of having to explain low-level technical details to managers who haven’t coded since punchcards to sap all the energy from the room. Make them justify every technical decision, and many coders will go so quiet that the Moon would seem noisy.
But that brings up another point. If the managers are locked out, who’s running the meeting? Code review should be run by one of the team’s senior developers. If there’s a choice, the optimal pick is the one who’s both even-tempered and experienced at running meetings. If you can only have one of those things, go for even-tempered.
10.5.3. When
Code reviews should be held regularly. An hour once a week is a good interval, but depending on how your team works, you may find that once or twice per sprint is best for you. The main thing is to develop the habit and stick to it—even after you’ve cleaned up all your issues in SonarQube, eliminated your duplications, and simplified your complexity.
10.5.4. Where
It’s important to emphasize that a code review meeting is just that—a meeting. And like a formal meeting, it should be held in a conference room or some other place that’s separate from the normal routine. Unless your team is only two or three people, just having everyone pause at their desks and join the conversation guarantees that you’ll lose someone to a phone call or IM or the piece of code she was interrupted on that’s frankly more interesting than one more boring meeting.
Ideally your conference room is equipped with a door and a speaker phone (if you have folks who work remotely). Another key piece of equipment is a projector. Rather than having each person follow along on his or her laptop, you should project what you’re talking about onto the wall to help keep attention focused on the group’s topic and minimize distractions like email.
10.5.5. How
Code reviews should be run with enough formality that people respect the process, but not so much that interesting discussion is squashed. What that seems to boil down to is that you publish a minimal agenda beforehand and keep minutes as you go along. You may wonder why we’re advising you to keep minutes when SonarQube offers such great mechanisms for making notes on code. There are definitely some decisions you’ll want to use the SonarQube issue workflow to record, but others belong in higher-level documents. Not every decision the team makes can or should tie to an issue. For instance, sometimes you’ll discuss sweeping questions that shouldn’t be tacked to a single file.
Your agenda and minutes should be posted publicly and available to everyone on the team. In this case, “everyone” does include management—they’ll feel better once they see from the minutes that you’re being productive and talking about code rather than gaming or plotting against them. A wiki is a great place to handle these formalities. You can easily set up templates, and everyone can make contributions or corrections, with changes tracked automatically.
In general, a good code-review agenda consists of a few fixed items, such as reviewing the action items from the last meeting and the changes in SonarQube since then, plus time for the discussion topic queue.
The discussion topic queue is a rolling list of code-review topics that anyone on the team can add to. When the poster’s topic rolls around, he has the stage. The kinds of things that end up on a queue like this vary widely, from “Cancel button on the left or right?” to “Demo & Proposal—JSR 303 Bean validation.” Neither end of the spectrum is more important than the other, and each item deserves serious consideration for several reasons:
- It’s important—at some level—to someone on the team.
- Open discussion gets all views aired.
- Agreement here leads to consistency across the team and the code base.
The last point to consider in structuring how your meetings will run is the occasional need to call on the one in the corner. You know, the coder who does great work but who would be just as happy never to open her mouth. Be sure to call on her occasionally during the discussion. Nothing too formal, just “Sam, what do you think?”
Once she sees that no one’s going to bite her head off or laugh in her face, she may be more inclined to speak up on her own. And then, when you schedule her onto the agenda to show what she’s been working on (you know she’ll never schedule herself), speaking to the group is that tiny bit easier because she’s done it before.
By the way, just because you need to provide both an agenda and meeting minutes, that doesn’t mean you can’t satisfy both requirements with one document. Start with a rudimentary agenda with the fixed items and the discussion topics you think you’ll get to, and then edit it during the meeting to show who attended, which topics were covered, and any decisions that came out of the discussion. File it by date afterward, and when the meeting’s over, you’re done except for carrying out your action items.
As the team (and management) gets more comfortable with the process, you might decide to boil some of the formality away, dropping the agenda and minutes. If you decide to do that, we urge you to retain the discussion topic queue so everyone on the team has the opportunity to contribute and to know what’s coming from the rest of the team.
10.6. Related plugins
Usually, at this point in the chapter, we tell you about the available plugins that relate to the chapter’s topic. In this case, we’ve already discussed two of the three relevant plugins in the chapter itself, so we’ll keep the treatment of them brief. We’ll start with the one you haven’t seen yet, the JIRA plugin.
10.6.1. JIRA
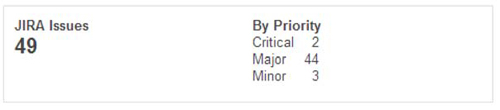
If you use the JIRA issue-tracking system, then you’ll be excited to know that this plugin offers two significant points of integration between SonarQube and JIRA. The first is the ability to track your issue counts as project metrics. With each analysis, this plugin logs in to your JIRA instance to retrieve issue counts by priority. They’re shown in the widget provided by the plugin (shown in figure 10.25).
Figure 10.25. The JIRA widget shows your project’s issue counts, both in aggregate and by priority.
The other integration point, and the reason it’s included in this chapter, is the ability to create a JIRA issue ticket for an issue from the More Actions workflow menu, as figure 10.26 shows.
Figure 10.26. Once you’ve installed and configured the JIRA plugin, look under More Actions to find the option to add a JIRA ticket from SonarQube. When you submit, you’ll see a link to the ticket in the issue comment.

The comments you enter are used both as issue comments and in the text of the JIRA issue. The SonarQube issue and the JIRA issue contain references to each other for easy cross navigation, but that’s where the relationship ends. Resolving the issue won’t have any effect on the issue or vice versa.
10.6.2. Taglist
We’ve already mentioned the taglist plugin. It gives you a way to track and count comments. Here we’ll go into the details that we omitted earlier. Typically, the comments you want to track are //NOSONAR and perhaps //TODO comments, although you’re not limited to those two.
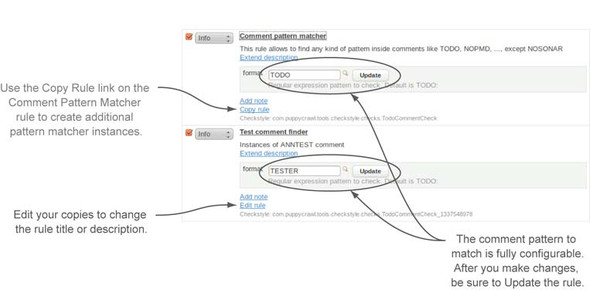
Once you’ve installed the plugin and added the taglist widget to your dashboard, you also need to turn on two rules: the “Avoid use of //NOSONAR marker” rule, which comes from SonarQube; and the Checkstyle rule engine’s “Comment pattern matcher.” You can have as many instances as you like of this particular rule, each one looking for a different comment; chapter 13 will show you how to make those copies. Figure 10.27 shows two variations: the expected TODO matcher and one that looks for TESTER comments.
Figure 10.27. You can have as many copies of the “Comment pattern matcher” rule as you like. The taglist widget displays them all.
Keep in mind that by setting up rules, you use the issue mechanism to track the comments of interest. The examples in figure 10.27 are set up to flag comments at the lowest possible issue level, Info, but you could flag them at any severity.
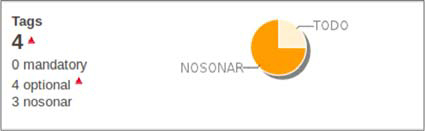
With your rules set up, all that’s left is to run a new analysis. When it’s done, you’ll see something like figure 10.28 in the dashboard.
Figure 10.28. The pie in the taglist widget has a section for each relevant rule you’ve activated: one for the NOSONAR rule, and one for each instance of the Comment pattern matcher rule.
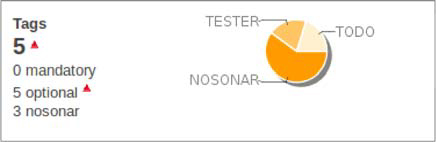
The last thing to know is that the taglist widget makes a distinction between mandatory and optional tags; the difference is the severity the rule was set to. In figure 10.32, all the TESTER and TODO comments appear as optional tags because we set them to create Info-level issues. But issues of a rule that’s set to Blocker or Critical would be registered as mandatory tags.
10.6.3. Widget Lab
The Widget Lab plugin offers a small suite of additional widgets, including a widget to show instances where an issue’s severity has been manually adjusted. SonarQube keeps track of manual severity adjustments internally, but it doesn’t offer any built-in way to find those issues or to see what the severity was originally. Widget Lab’s manual severity widget gives dashboard-level visibility into downgraded or upgraded issues, showing both an adjusted issue’s original severity and its current severity.
10.7. Summary
Regular code reviews can enhance your team’s effectiveness and cohesion. Using SonarQube’s workflow and action-plan mechanisms in a code review can make code reviews an even more effective tool for managing and paying down technical debt. SonarQube’s workflows allow you to attach a running comment log to an issue. They also provide a mechanism to confirm an issue, and assign it to a SonarQube user. There are three ways to moderate an existing issue: flag it as a false positive, change the severity, or add a //NOSONAR comment to the end of the flagged line.
The manual issue mechanism lets you flag code problems that SonarQube doesn’t (such as the need to restructure a method). Once a manual issue has been created, it can be managed and tracked in the same way as any other issue. SonarQube’s action plans allow you to group issues and monitor progress. And SonarQube provides a project-level Issues dashboard, for quick oversight of issues and action plans. The global issues search allows you to search issues across projects.
Now that we’ve given code reviews thorough coverage, we’ll turn next to what happens after a code review. In chapter 11, we’ll examine what happens when you sit back down to work on what you were assigned in code review: that is, we’ll look at SonarQube’s IDE integration.