
Chapter 15. Managing your projects
This chapter covers
- Differences between project and global dashboards
- Manual metrics
- Multiple quality profiles
- Understanding the history of a project
- Exploring the rest of project configuration
Welcome to the last chapter of the administration part of the book. Although it may be the last, it’s not the least, because it will teach you how to tune your projects and customize them to fit in the Continuous Inspection process you started adopting after reading chapter 9 (right?).
We’ll start by explaining the differences between global and project dashboards. What you saw in the previous chapter about managing global dashboards works almost the same for project dashboards. We’ll focus only on the details that vary.
Have you ever wondered how SonarQube handles projects with source files from multiple programming languages? If every module contains code from a different language, then you can take advantage of a powerful SonarQube feature that lets you run a single project analysis for all languages. Without that, you would have to instead run several analyses (one for each language), and you could end up with multiple SonarQube projects. In this chapter, we’ll show you how to assign various quality profiles (one for each language) in the same project.
SonarQube also offers a plethora of quality metrics. In addition, you’ve seen throughout the book that plugins extend SonarQube by feeding it new metrics. But plenty of measures (budget, team size, and so on) are outside pure code quality, so SonarQube can’t compute them based on the source code. In such cases you can use the manual measures feature: embedded reporting functionality that displays information in a unified dashboard.
Next we’ll explore how to manage your project history. We’ll explain basic terms such as snapshots, versions, and events, and we’ll present some cases when you need to manage them in SonarQube.
The last part of this chapter covers the rest of the available project configuration. We’ll discuss the various settings, similar to what we covered for global settings; and you’ll learn how to define links, delete project(s), and modify a project’s key.
You’ll notice that the order of the topics we’ll discuss doesn’t follow the order of the links that appear in SonarQube’s menu. The reason for that inconsistency is that we decided to present first the features that are most used or most significant, and leave the less important stuff for the end.
Enough with the introduction. It’s time to see what’s different in project dashboards.
15.1. Working with project dashboards
In chapter 14, we covered a lot about managing global dashboards. You’ve learned about customizing the look and feel of your dashboards, sharing them, and configuring widgets. Project dashboards are more or less the same.
Because most of the material in this chapter is about projects, navigate to SonarQube’s start page and click your favorite project. You’re redirected to the project dashboard, where you see various widgets we’ve covered in previous chapters.
Let’s start by exploring the page where you can manage your project dashboards. It’s identical to what you saw in our discussion of global dashboards. The only difference is that you can access this page only when viewing an existing dashboard. Don’t worry if you haven’t created any yet. Remember that SonarQube comes with four default dashboards that appear in the upper-left menu (see figure 15.1). That means every new SonarQube user automatically follows all default dashboards—unless you edit them as you saw in chapter 14. Don’t get confused by the fact the first project dashboard is called...Dashboard. All of them are dashboards, and table 15.1 summarizes them.
Figure 15.1. SonarQube ships with five default project dashboards. They’re available in the upper-left menu when you’re viewing a project.
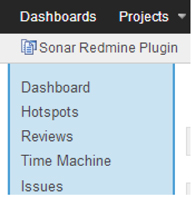
Table 15.1. Default global dashboards shipped with SonarQube
|
Widgets included |
|
|---|---|
| Dashboard | Rules compliance, test coverage, comments and duplications, size metrics, complexity, and package design. This is the dashboard you land on by default when you click-through from the global level to the project level. |
| Hotspots | Most violated resource, most violated rules, and several instances of the metric hotspot widget (highest untested lines, highest complexity, highest duplications, and so on). |
| Reviews | All widgets related to reviews and action plans (review activity, unplanned reviews, reviews by developers, my active reviews, and so on). |
| Time Machine | A timeline widget about coverage, rules, and complexity, and several instances of the history table widget for the most important metrics. |
| Issues | Unresolved issues by status, unresolved issues by assignee, action plans, false positive issues, and unresolved issues. |
Now that you’re viewing a (default) project dashboard, you can see in the upper-right corner the links—the same ones you see for global dashboards—for managing dashboards and configuring widgets. We won’t discuss that further because what you already know from the previous chapter applies here as well. Don’t forget that you can share project dashboards only when you’re granted global system administration rights.
But keep in mind a small difference about widgets in project dashboards. You don’t need to specify the project (as you do in global dashboards), because it’s assumed that the widget will display data from the current project.
Even though it might be considered weird, you can use global widgets in project dashboards exactly as you do with global dashboards.
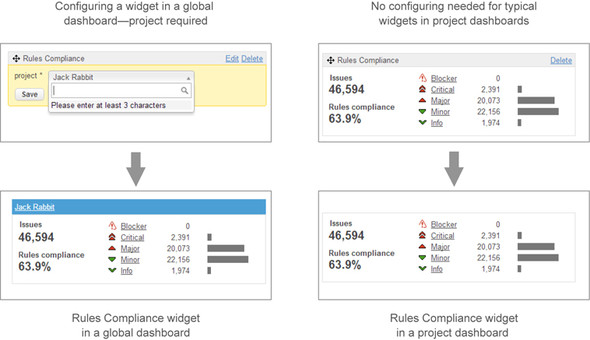
Figure 15.2 shows the same widget (rules compliance) in a global dashboard and a project dashboard. You can see the extra widget header in the global dashboard for the project description.
Figure 15.2. Adding a widget in a project dashboard is simple because you don’t need to specify the project, as you probably expect from chapter 14.
As a last reminder, you don’t have to create every dashboard your users want to see. They can create their own private global and/or project-level dashboards and follow/unfollow default dashboards created by global administrators.
Now we’re leaving dashboards behind and moving on to a more sophisticated topic. In the next section, we’ll discuss the available project settings that assist you in applying Continuous Inspection practices in your development process.
15.2. Adopting Continuous Inspection more quickly
In chapter 9, we explained in detail the idea of Continuous Inspection and covered the steps to achieve it. We even dedicated a whole chapter (10) to code reviews and how SonarQube makes them a piece of cake, to underline the importance of this practice when adopting Continuous Inspection.
This section elaborates on this topic and discusses some project-dependent features and configuration that will help smooth the adoption of the Continuous Inspection practice. We’ll start by showing how you can assign multiple quality profiles in a project and the reasoning behind doing so. Then we’ll explain manual metrics, and finally you’ll learn when and how you might want to exclude part of your source code from analysis.
15.2.1. Assigning quality profiles
In modern layered systems, a common and best practice is to separate source code in different libraries (called modules) based on the programming language used. For instance, imagine a project with two modules. The first module contains Java source code files, and the other one contains files related to the web interface (JSP/JSF/XHTML pages). SonarQube can analyze this language-based multi-module project during one analysis, which is convenient.
In chapter 1, we talked about running multiple analyses for multiple languages in the same project, which is different from what we’re discussing here (multi-module language-based project organization). Both approaches are possible, both are common, and they’re supported by all available analyzers (clients). If you don’t know/remember how to trigger such an analysis, refer to appendix B.
As you learned in chapter 13, SonarQube ships with several default quality profiles. Accordingly, every language plugin adds at least one default quality profile. But as we explained, it’s a good idea to create your own profiles and associate them with projects. This can be done two ways. On the quality profiles administration page, you can associate a project with the selected profile, but this requires that the logged-in user have system administration rights.
You also learned in chapter 12 that it’s a good practice to create an admin group for each project and assign them administrator rights only for that project.
By following this practice, you can have project admins manage the selected quality profiles. They can’t create new profiles, but they can assign for each language which profile SonarQube should use to analyze the source code.
Figure 15.3 shows the project Quality Profiles page. Yours might be different, because this page is dynamically created. A separated option is displayed for each programming language supported by the current SonarQube installation. Your project might contain only Java and JavaScript source files, but SonarQube doesn’t know that, so it displays all available languages. You can navigate to this page (when viewing a project) by clicking the Configuration link at upper right on your screen. In the drop-down menu that appears, select Quality Profiles. If you don’t see such an option, it means you haven’t yet created a quality profile, as you saw in chapter 13.
Figure 15.3. Assigning project quality profiles for supported languages
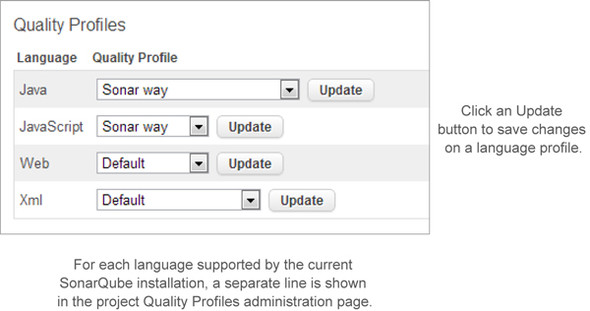
After that, all you have to do is select your favorite profile for your project languages and click the Update button for each selection. For instance, clicking Update for the Java language doesn’t save a selection made for XML. Run a new analysis, and you’ll see language-specific metrics calculated by SonarQube for each module.
Speaking of metrics, have you ever wondered if SonarQube supports measures that can’t be computed from source code analysis but that are important to track? The next section answers that question.
15.2.2. Defining your own metrics
We’ve seen many posts in the SonarQube user mailing list from users asking how to group projects with attributes that don’t exist in computed SonarQube metrics or in project properties. Assume that you work in a large organization, and SonarQube hosts hundreds of projects assigned to different development teams. Team members would prefer to see in their global dashboard only the projects they’re responsible for, but there’s no common characteristic across the project set on which to base a filter. SonarQube doesn’t have any built-in feature to distinguish projects based on a condition that isn’t related to computed metrics. So what now? If only you could add a property (such as team ID or name) to your project and set its value! Then you could create a filter based on this property and show only the correct projects.
Adding a new manual metric
The answer is simple: it’s called manual measures. SonarQube allows you to create as many manual metrics as you want and specify their measures for each project. In this section, we’ll show you how to manage manual metrics at a global level and how to set their values and include them in dashboards and filters.
Note
Metrics and measures are two different concepts in SonarQube. A metric is a definition/specification, and a measure is the result of a metric computation by an analysis.
To add a new manual metric, click the Settings link at upper right on your screen and then select Configuration from the drop-down menu. This takes you to the global administration page we covered in chapter 14. Click Manual Metrics, and you see the page shown in figure 15.4. Keep in mind that although project-level rights are sufficient for most of the configuration discussed in this chapter, to add manual metrics you must have global administration permissions. See chapter 12 to refresh your memory about permission levels.
Figure 15.4. SonarQube ships with three manual metrics. The administration page is simple: it lists all available metrics and provides a form to add new or edit existing ones.

The Manual Metrics page is similar to the one we discussed for global dashboards. It lists all the manual metrics and, at right, provides a form you can use to create a new one. SonarQube comes with three preconfigured manual metrics you can use in your projects.
- Burned Budget— The budget used so far by the project
- Business Value— How important the project is to the business
- Team Size— Project team size
Let’s create a new metric to indicate the project’s development team. Enter the name of the metric (Team Name/ID) and a description that reminds you of its purpose, and select or enter a domain. Finally, choose the metric type. The available options are as follows:
- Integer
- Float
- Percent
- Level
- Text
- Yes/No
In the example, you only want to record the name of the in-charge team, so the Text type is what you’re looking for. Click the Create button, and the metric is automatically added to the table. In addition, the Operations links are activated so you can edit or delete the metric, as shown in figure 15.5. (Preconfigured metrics can’t be modified or removed.)
Figure 15.5. The Edit and Delete links are shown only in custom manual metrics.

Now you can use the metric to create a new filter that lists all team projects, as discussed in chapter 14. Of course, you aren’t finished. You need to set each project’s metric values, as we’ll discuss next.
Setting Measures of Manual Metrics
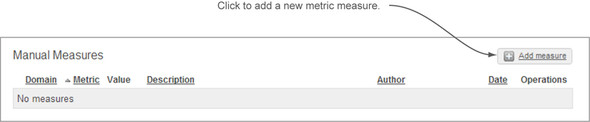
Select a project to view, and click the Configuration drop-down option Manual Measures. Figure 15.6 shows the page for managing measures of manual metrics. Because you haven’t set any values yet, your page probably looks identical to the figure. To add a new measure, click the Add Measure link at upper right.
Figure 15.6. Manual measures (empty) administration page
As you can see in figure 15.7, the Add Manual Measure page is pretty simple. Just choose a manual metric from the corresponding list, and two new attributes (Value and Description) appear below it. Fill in the information, and save your settings. Your new manual measure is (almost) ready for use like a typical measure (filters, widgets, and so on), as we’ll show you in a minute. There’s one last step.
Figure 15.7. Adding a new manual measure
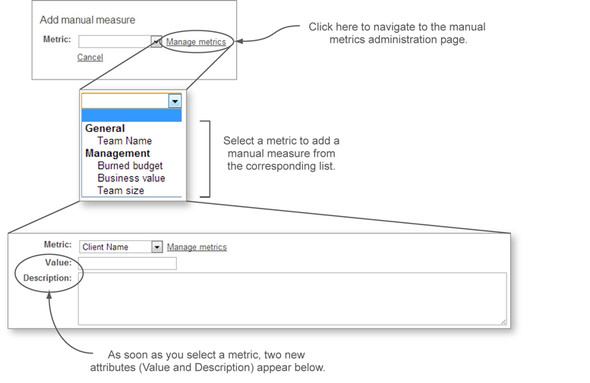
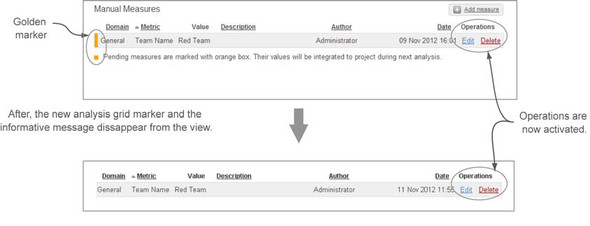
As the upper part of figure 15.8 shows, in the custom measures list view, a golden marker appears to the left of the measure. This indicates that the measure is still pending, meaning you need to run a new project analysis so its value will be integrated with the other SonarQube metrics. The lower part of the figure shows that after the analysis, the golden marker and the corresponding message disappear.
Figure 15.8. A golden marker points out which measures have not yet been integrated with the rest of the SonarQube metrics. Running a new project analysis removes these markers.
Displaying Custom Measures in Dashboards
Showing custom measures in a dashboard is easy. If you don’t remember how to add widgets to a global or project dashboard, go back to chapter 14 to refresh your memory.
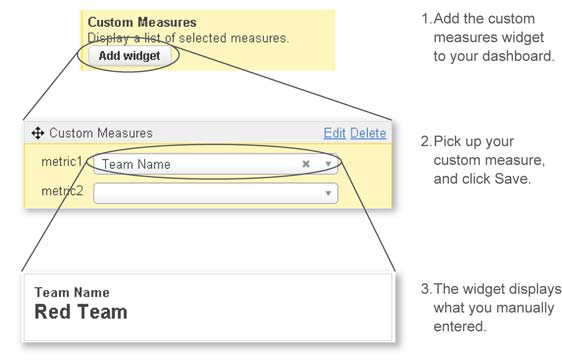
First, as step 1 in figures 15.9 shows, locate the custom measures widget and add it to your favorite dashboard. (Don’t forget that you can add a widget in both project and global dashboards.) Then select the custom measure(s) you want the widget to display. When you’re done, click the Save button at the bottom of the widget. That’s it. The widget now shows your custom metric(s).
Figure 15.9. Displaying custom measures in a dashboard takes two steps: add the custom measures widget, and select the measures you want to show.
Tip
The custom measures widget shows only the newest metric values integrated with the rest of the SonarQube metrics during the last project analysis. That means you may enter multiple values for the same measure, but only the last one entered is displayed in the corresponding widget. Custom measures behave just like other metrics calculated by SonarQube: you can add them to a timeline widget and see their historical evolution.
Well done! Now that you’ve mastered SonarQube’s custom metrics, it’s time to change the subject. The next section will introduce the concept of omitting some files from SonarQube analysis.
15.2.3. Excluding source code from analysis
Assume that you recently integrated your system with a promising open source framework. After a while, you discovered some bugs that seriously affect your system but that aren’t scheduled for resolution in any future release of the framework. So you decide to fix them locally.
You download the source files, make copies of the five classes involved, fix the issues, and place the corrected files with the rest of your project. So far, so good. The next morning, you open SonarQube’s web page, and—what a mess! Most of the metrics (coverage, issue compliance, documentation, and so on) have decreased. You quickly drill down to see what happened, and you realize that the classes you copied from the open source framework appear at the top of the drilldown lists. No tests, no documentation, and many broken rules for your favorite quality profile. These files destroy the quality of your project.
Don’t panic! Remember that you’re in the world of SonarQube, where (almost) everything is possible one way or another. Once again, in this case, there’s an easy-to-implement solution. Click the Settings option in the Configuration drop-down menu, and then select the Exclusions category.
(We’ll explore most of the available settings in the next section. We’re mentioning exclusions here because of the importance of this feature and the flexibility it adds to SonarQube analysis.)
Figure 15.10 shows the exclusions settings page. You can add several values both for sources and tests based on a pattern. The instructions and examples provided by SonarQube on this page are awesome, and it’s redundant to repeat them here.
Figure 15.10. By modifying exclusions settings, you can make SonarQube exclude source files based on patterns.

We prefer to give you a comparison of all available exclusions discussed in this book. You saw the Switch Off Violations plugin in chapter 13 and the Cutoff plugin in chapter 9. Both of them exclude files from SonarQube analysis. Table 15.2 summarizes their basic features along with what we explored in this section.
Table 15.2. SonarQube’s exclusion options
|
Name |
Description |
Plugin |
Metrics affected |
Project / Global |
|---|---|---|---|---|
| SonarQube’s exclusions settings | Exclude files from being analyzed by SonarQube based on patterns | No | All | Project |
| Switch off Violations plugin | Exclude issues in a fine-grained way by rule, name/path, line or range of lines, and file content | Yes | Only issues. Complexity, duplications, and so on are still calculated. | Both |
| Cutoff plugin | Exclude files from being analyzed by SonarQube based on a predefined date or period threshold | Yes | All | Both |
Which one you should use? It depends on what you want to achieve. You can even combine them. In general, SonarQube’s core exclusions feature is used when you want to ignore source files during analysis. Switch Off Violations fits when you want to bypass issue creation without modifying the quality profile. And finally, keep in mind that the Cutoff plugin is convenient to exclude legacy parts of the code.
The last part of this section is dedicated to the project’s history. You’ll learn how to manage it and how it interacts with the differential views we explored in chapter 10.
15.2.4. Understanding versions, snapshots, and events
Before we start explaining some terms, let’s browse the project’s history. To do so, click the History link, found in the project’s Configuration drop-down menu. SonarQube has a clever, flexible mechanism to maintain historical information for a project. This information isn’t limited to previous analyses but is expanded to include versions and events.
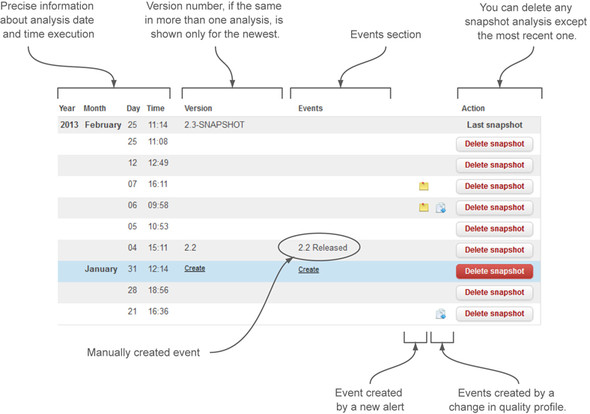
In figure 15.11, notice that all the details you could want about your project’s history are consolidated on just one page. Starting from the left column, you get precise information about the date and time of analysis execution. Year and Month column data are omitted if they’re the same as the previous analysis; this makes the table even more readable. Next, the Version column shows the sonar.projectVersion property provided in SonarQube Runner or in an Ant task. In Maven projects, it can be automatically retrieved by the pom.xml file (that is, the <project><version> property). Next is the Events section, which is composed of three columns: the first displays manually created events, and the other two indicate events created by alerts or quality profile changes. The last column provides a button to delete a snapshot analysis. Note also that SonarQube doesn’t let you delete the most recent snapshot analysis.
Figure 15.11. Every detail of your project’s history on one page
Before we move on, let’s elaborate on three terms we used in the previous paragraph: snapshot, event, and version. Table 15.3 explains them in detail.
Table 15.3. History terms
|
Term |
Description |
Comments |
|---|---|---|
| Snapshot | Every time SonarQube runs a new project analysis, its results are stored in the database, and a new snapshot of the project is created. | Snapshots aren’t forever. Recall what we discussed in chapter 14 about the database cleaning mechanism and how you can modify the default settings. |
| Version | The project’s version number is passed as parameter in SonarQube analysis. | The latest snapshot of a version is always kept in the database, even if it breaks the database cleaner rules. |
| Event | Events either are noteworthy facts that occurred during project analysis or can be manually added. | A snapshot may be associated with more than one event. Snapshots with events are never deleted automatically from the database, although someone with project administration rights can do that manually. |
Now that we’ve clarified the basic terms, let’s go back to figure 15.11. You might be thinking right now that this is a static page, and the only interaction is through the Delete Snapshot button. Well, move your mouse over a row.
As figure 15.12 shows, the row is highlighted; and depending on its content, various actions appear. For instance, if there’s no information about the version or custom event, you see a Create link in the corresponding places. On the other hand, if the row (that is, a snapshot analysis) holds data about the version, you see links to rename or remove it. For the Events column, in addition to the Rename/Remove links, you always see a Create link, because you can have more than one custom event associated with a snapshot analysis.
Figure 15.12. Moving your mouse over a row displays various actions depending on the row’s content. You can create a new version, add multiple custom events, rename them, or remove them from the selected snapshot.

As you might expect, you can rename an event or a version. To do so, click the Rename link and enter the new description in the resulting input. Removing data is just as easy: click the Remove link.
Tip
You’re probably wondering why you need a Delete Snapshot button, because SonarQube takes care of older snapshots. In some cases, you need to delete a snapshot such as wrong rules in a quality profile or any other wrong parameter passed to the analysis. Instead of waiting for the database cleaner, it’s much better to do it yourself.
We’ve now covered the most significant project administration topics that you need to know. The rest of the chapter discusses subjects that are less important but still useful to know.
15.3. Exploring the rest of the project configuration
This section explores in more depth some low-level project administration options and features covered in previous chapters. Although you might never use them, it’s good to know they exist, in case some day you need them. We’ll discuss assigning project roles, setting various project links, modifying the project’s key, and deleting project(s). Finally, we’ll show you some useful miscellaneous project settings.
15.3.1. Changing permissions
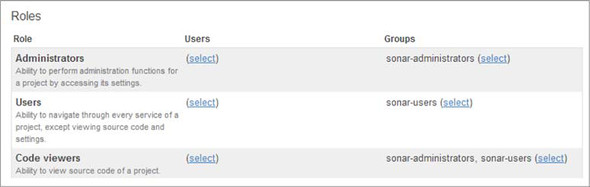
In chapter 12 we talked about user, group, and role management. You learned that it’s a good idea to add users with administrator privileges for each project and let them manage project security without bothering the SonarQube administrator.
For that purpose, there’s a Roles link in the project’s configuration drop-down menu. The page shown in figure 15.13 looks very similar to the Roles pages you saw in chapter 12. The only difference is that here, you can manage only the permissions of the current project you’re viewing. You can use the Select links to add/remove individual users or groups.
Figure 15.13. Project Roles page, which is similar to the global roles administration page
15.3.2. Setting project links
SonarQube lets you define up to 10 external project links by clicking the Links link on the project configuration menu (see figure 15.14). These links can be categorized as follows:
Figure 15.14. You can define up 10 ten links for every project, but only half of them can be generic and managed though SonarQube’s UI.

- Standard links— Can be passed as SonarQube execution parameters or discovered automatically in Maven projects. These links can’t be modified using SonarQube’s UI.
- Custom links (up to five)—Can be added/edited only by using SonarQube’s UI.
Table 15.4 lists the available standard links and compares them with a generic custom link.
Table 15.4. Standard links
|
Description |
Property Name |
Maven attribute |
Usage in SonarQube |
|
|---|---|---|---|---|
| Home | Links to the project’s home page | sonar.links.homepage | <url> | Dashboards (description widget) Filters |
| Continuous Integration | Links to the job page of a CI engine (Jenkins/Hudson, Bamboo) | sonar.links.ci |
<ciManagement> <url> |
Dashboards (description widget) Filters |
| Issue Management System | Links to the issue management system (JIRA, Mantis, Redmine, Trac, and so on) | sonar.links.issue |
<issueManagement> <url> |
Dashboards (description widget) Filters |
| Sources | Links to the project sources | sonar.links.scm |
<scm> <url> |
Dashboards (description widget) Filters |
| Developer Connection | URL for developers to get a copy of the source code | sonar.links.scm_dev | <scm> <developerConnection> | Dashboards (description widget) Filters |
| Custom | Anything useful (Javadocs, other documentation, and so on) | N/A | N/A | Dashboards (description widget) |
Tip
In Maven projects, you can override the pom.xml attributes by setting the corresponding sonar.links.* property during SonarQube analysis.
15.3.3. Modifying the project key
If you think modifying a project’s key in SonarQube might be a useless feature, imagine the following (real-world) scenario. You’ve been using SonarQube for the last year for your project. That means you have a lot of historical data. For some reason (policies, wrong key, and so on), you need to modify the project’s key, which is a trivial activity. Next, you run a new SonarQube analysis, and BOOM!
Why does SonarQube now display two projects with the same name (one with the previous key and one with the new)? Where is the historical information in the project with the new key? It’s a complete mess.
If you’re wondering why these evil things happened, the answer is simple. SonarQube identifies projects by their keys. If a key isn’t found in the database, it’s considered new, and the project is created from scratch. That’s why you see a replica (in terms of description) of the initial project.
To solve this issue, SonarQube allows you to modify the project’s key by choosing Update Key in the Configuration drop-down menu. The resulting page is simple (see figure 15.15): all you have to do is enter the new project key and click the Rename button. Keep in mind that you need to modify the project key in SonarQube’s UI before triggering a new analysis of the project with the new key.
Figure 15.15. SonarQube lets you edit a project’s key, but you should do this before triggering a new analysis of the project with the new key.

In other words, before you run a new analysis, make sure both keys (project key in source files/analysis properties and project key in SonarQube) are identical. Otherwise you end up with two different projects in SonarQube.
15.3.4. Deleting projects
SonarQube offers two ways to delete a project:
- Single-project deletion
- Bulk deletion
Although the second option is more like a global administration feature, we decided to list both of them in this section to make it easier for you to use this book as a reference and not a one-time read.
If you want, for any reason, to delete a project from SonarQube’s database, choose Project Deletion in the project’s Configuration drop-down menu, and then confirm the action. Keep in mind that there’s no way to undo this operation: double-check that you really want to delete the project and its history, and/or back up your database first!
Bulk deletion is available by choosing Bulk Deletion from the global configuration menu. You see a list of all available projects with pagination (see figure 15.16). At the top of the screen is an input where you can type some text and filter the projects. Select all the projects you want to delete, or choose the Select All check box to quickly select all projects on the current page.
Figure 15.16. You can delete several projects at the same time by using the Bulk Deletion feature.

Tip
When you navigate between pages, previous selections aren’t remembered. For instance, if you select project X from page 1, navigate to page 2, select project Y, and click Delete, only project Y will be deleted.
Be aware that if your projects span several pages and you want to select all of them, you must use the link that appears to the right of Select All, as shown in figure 15.17. Finally, SonarQube, before executing the deletion, requests for a final confirmation. As with single-project deletion, there’s no way to undo this action unless you have a database backup in place.
Figure 15.17. Checking the Select

15.3.5. Miscellaneous settings
The last option in the project configuration menu that we haven’t discussed yet is the Settings link. The settings page is similar to the global settings feature you saw in chapter 14. We’ve already covered all the available categories in chapter 14 or elsewhere; for instance, the Code Coverage category was discussed in chapter 3, and the Differential Views category in chapter 9.
Keep in mind that many plugins provide not only global settings but also settings at a project level. Every time you install a new plugin, it’s a good idea to visit this page to explore the available project settings.
15.4. Summary
Well done, SonarQube Master! You can be proud that you know everything you need to work with SonarQube in action. This chapter covered the topics of project administration.
You’ve learned what’s different in project dashboards and how you can improve your Continuous Inspection process by doing the following:
- Assigning multiple quality profiles for multi-module, multi-language projects.
- Creating manual metrics, setting their measures, and using them in filter criteria and widgets as you do the rest of the metrics calculated by SonarQube.
- Excluding parts of your source code from analysis. We also presented a comparison of the three ways you can do this (core SonarQube, the Switch Off Violations, and the Cutoff plugins).
- Managing your project’s history by creating custom events or new versions, or deleting useless snapshots.
Finally, we covered some low-level administration features such as assigning project roles, changing the project key, and deleting one or many projects at the same time. We also discussed setting standard or custom links (project-related) and where you can use them.
The final chapter of this book is dedicated to developers and will give you a step-by-step guide to create your own plugin using the SonarQube API. To make this fun and useful at the same time, we’ve chosen to implement a plugin for Redmine (www.redmine.org), an alternative to the JIRA issue-tracking system.