
Chapter 13. Rule profile administration
- Making your own profile: copy and modify
- Profile inheritance
- Rule editing
- Alerts: knowing when your metrics have crossed the line
- Tracking profile changes
- Administrative miscellany
A lot of things happen during an analysis. Your code is examined for duplications, complexity, and a host of other things. Most important (to this chapter, anyway), it’s measured against a set of rules: a rule profile. Out of the box, you get at least one rule profile for each language SonarQube can analyze. Those default rule sets make great starting points; but as you’ve probably realized by now, they’re not perfect for every situation. In fact, almost every coder has a bone to pick with at least one rule in any given rule set, whether it’s that the severity is wrong, or the rule threshold is too low, or it shouldn’t be in the profile at all.
In this chapter, we’ll show you how to go about fixing that. You can edit the default rule sets, but we’ll explain how to peel off a copy and start customizing it to meet your needs. But it’s not just rule sets that are customizable. You can augment the global description of any rule and make profile-specific notes on rules. You can also edit some rules, and we’ll show you how. We’ll also cover how to check a profile’s change log and how to compare one profile to another.
Profile inheritance is another useful feature. It allows you to set up a base rule set and then augment child profiles with the additional rules needed for a specific project or team.
Although profiles are primarily about rules, you can also use them to set alerts: simple Boolean thresholds that help you raise the alarm if any of your metrics (even the ones that have nothing to do with rules or issues) cross the warning or error thresholds you set.
13.1. Making your own profile: copy and modify
As Russell deleted yet another demanding email, he mused that being the SonarQube admin wasn’t always a life of wine and roses. Not one team was satisfied with the rule profile he had set as the default, and the natives were getting decidedly restless. But although all the teams disliked the rule set, that was the only thing they agreed on. Red Team wanted it stripped down to just the most important rules so they could focus on the worst offenders. Green Team wanted to add rules, and Blue Team wanted to pick and choose—add some and delete others—and twiddle severities to boot! Meanwhile, management was adamant that everyone needed to adhere to the same minimums.
He’d been putting it off, but Russell realized it was time to dig in to rule profile administration. Because everyone’s basing their requests on the current default profile, working from a copy or copies of that profile is a great strategy. A more sophisticated approach, which we’ll look at in the next section, might have Russell create a base profile, perhaps based on the minimum rule set that Red Team and management wants, and set up team-specific child profiles that inherit the basics from the core rule set. Whatever strategy Russell uses, his first step should be to create a new profile.
13.1.1. Copy or start from scratch?
There are two ways to make a new profile. You can create one from scratch or copy an existing one, which is supremely easy (as shown in figure 13.1).
Figure 13.1. Clicking the Configuration link at the top of the page takes you to a list of rule profiles. Logged-in administrators can easily copy any profile with the click of a mouse. The only hard part is coming up with a good name for the new profile.
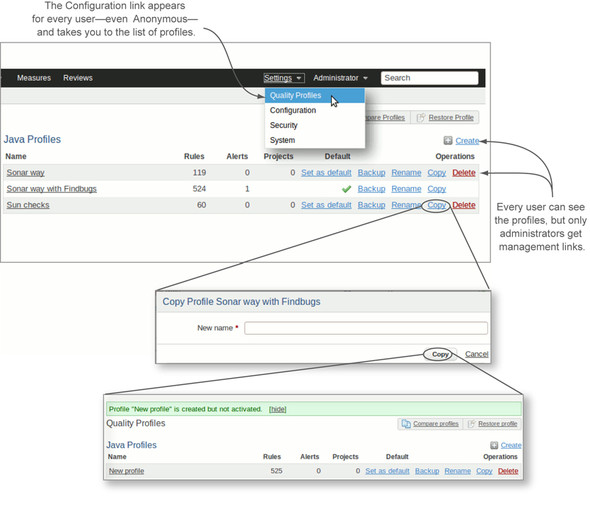
Each profile is displayed with a Copy button. Provide a unique profile name in the resulting pop-up, and you’re in business. If you’d rather start from scratch, that’s easy too. Just click the Create link to the right of the language in question. A creation form pops up, as shown in figure 13.2.
Figure 13.2. You create a profile from scratch via a form that’s added inline on the page. Depending on the language, you may get the opportunity to seed your new profile with rules from some of the language’s available rules engines, uploaded in an engine-specific format.

Depending on the language, the Create Java Profile form may include upload inputs for selected rules engines. The formats of the files you need to feed into these engines are rule-engine-specific. We’ll look later at how you can export the rules from an engine from one profile for import into a new one. When you submit the form, your new profile is added to the list.
Once you have your new profile, it’s time to begin editing. Click-through on the profile name to land at the Coding Rules tab of the profile editing interface; this is its list of rules. If you started from scratch, you’re looking at a blank list (remember, by default this page shows the profile’s active rules, and you haven’t added any yet) with the search form at the top. If you copied another rule set, then there are plenty of rules to look at here.
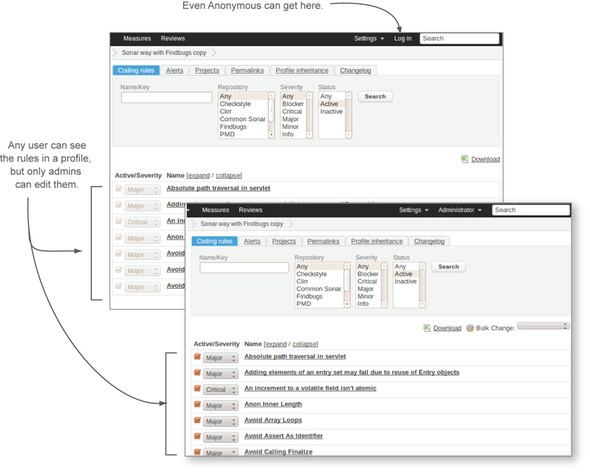
As we’ve said before, any user, even Anonymous, can get to the list of rules in a profile. But for administrators looking at a modifiable profile, the rules are presented in an editable search results format, as shown in figure 13.3.
Figure 13.3. The rules that make up a profile are presented in a search/search result interface. The default presentation is all rules in the profile.
13.1.2. Your first profile edits and their quality implications
By default, the Coding Rules tab shows all the rules currently active in your profile. Each rule is displayed with two controls: a check box and a drop-down menu. Scroll up and down the page, and you see that the check box to the left of every rule is checked, indicating that it’s part of the current profile.
To drop a rule from your profile—one of the two things most people are itching to do at this stage—uncheck it. There’s no submit button on this interface; your changes take effect immediately, but the search results aren’t refreshed interactively. If you remove rules from your profile by unchecking them, they stay on the page until you refresh it—giving you the chance to turn them back on if you mis-clicked.
The other thing most folks are eager to do is adjust rule severities. Nearly everyone thinks the default severity on some rule is a bit of an overreaction. Rule severities are set per profile, so if you want a rule’s severity changed everywhere, you have to do that manually. But it’s a simple enough change to make, as figure 13.4 shows.
Figure 13.4. Use the drop-down menu to the left of any rule to adjust its severity in that profile. Note that no other profile is affected by this change.
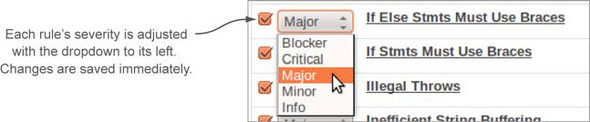
The drop-down menu to the left of each rule lists all possible severities, with the rule’s current severity in the current profile highlighted. To change a rule’s severity, pick a different option in the drop-down list. Again, your changes are recorded immediately.
Don’t think that dropped rules or changed severities will be immediately reflected in your projects’ issues drilldowns or metrics, though. You’ll need to re-analyze each affected project to see those changes in action. Depending on your issue counts, these edits can produce what look like wild swings in quality, as, say, 50 Criticals are “fixed” while 50 Majors are “added” because of a severity adjustment, and another 20 Minors are “fixed” because of a dropped rule. In reality, the code hasn’t changed a keystroke—only the way you look at it has.
For the next couple of weeks, maybe the next few months, you’ll remember what caused that wild quality swing. Next year? Maybe not. Fortunately, analysis with a new profile version (yes, rule profiles are versioned; more on that soon) is marked as an event in SonarQube. We talked about events in chapter 8; they’re special flags that mark analyses where something memorable happened. So your next analysis, with your newly edited profile applied, will be flagged with a profile-change event, noting the profile name and version. Because analyses with events are exempt from automated database cleanup, you’ll have a long-term record of both when and why that quality swing occurred.
13.1.3. Adding rules: how to find them and why you’d want to
The third kind of change you might want to make is adding rules, but first you have to find them. As you scroll up and down the page, you’ll see that there are no unchecked (addable) rules available. Remember, that’s because by default, this page shows all the rules in the current profile, and only those rules. Finding the others is easy, though.
Scroll back up to the search interface at the top of the page, as shown in figure 13.5. To find the rules that aren’t currently in your profile, search by Status Inactive, and you should have plenty to choose from. Enabling rules in your profile is intuitive; just check the check box. But you may be wondering why, with over 500 rules currently in your profile (assuming you copied from the SonarQube way with FindBugs profile), you would want more.
Figure 13.5. The rule search interface is straightforward. You can search by any combination of rule name, rule engine, severity, and status. It defaults to showing all active rules in the current profile.

Believe it or not, there are a number of reasons to turn on more rules. For instance, various plugins operate through additional rules, such as the Tag List plugin we discussed in chapter 10. It tracks instances of the //TODO comment for you, but only if you’ve enabled the relevant rule in your profile.
You may also want to investigate the rules that aren’t on by default, such as those available for many languages to let you track some of the non-issue metrics: duplications (the Duplicated Block rule), test coverage (Insufficient Line Coverage by Unit Tests), complexity (Avoid Too Complex Method, Avoid Too Complex Class), and so on. Even beyond the Seven Axes of Quality, the non-default rules offer useful options, such as the Avoid Deprecated Method rule, which can help you hunt for and destroy these incompatibilities waiting to happen. There are also a lot of potentially valuable rules that don’t fit neatly into a single category, such as Avoid Multiple Unary Operators, For Loop Should Be While Loop, and the rules available for most languages to record parsing failures so you don’t have to pore over your analysis log every time to make sure SonarQube was able to read all your files. Even if you don’t think you’re in the market for extra rules, they’re well worth at least a browse.
Now that you’ve seen how easy it is to get started with your own profile and make changes to it, you may be ready to go to town. But before you go too far down the road, you should look at profile inheritance if you have multiple profiles to manage for a given language.
13.2. Profile inheritance
Remember, Russell was facing three different teams wanting three different rule sets: Red Team wanted a stripped-down set of just the “most important” rules; Green Team wanted to add rules; and Blue Team wanted to remove some rules, add others, and change some severities.
Of course, one option might be to have each team manage its own profile. But as you saw in chapter 12, only SonarQube administrators can edit rule profiles, and global admin permissions probably aren’t something you want to hand out like candy.
Fortunately, you don’t have to. Because Red Team and management concur on the minimum rule set (the Blockers and Criticals from the Sonar way with FindBugs profile), the Red Team profile is a good candidate to be the parent profile. In this section, we’ll show you how to set up and manage inheritance and how to track the state of the relationship.
13.2.1. Establishing inheritance
If Red Team only wanted a handful of rules, creating it from scratch might be the way to go, especially because there’s a Bulk Change feature that lets you toggle the status of every rule on the page at once. But the Sonar way with FindBugs profile includes hundreds of Blockers and Criticals: nearly every single one. Because a couple of Criticals don’t belong in the profile, the easiest first step is to copy the Sonar way with FindBugs profile, search for the rules to drop from the copy, and then do a bulk change to deactivate them all in one fell swoop, as shown in figure 13.6.
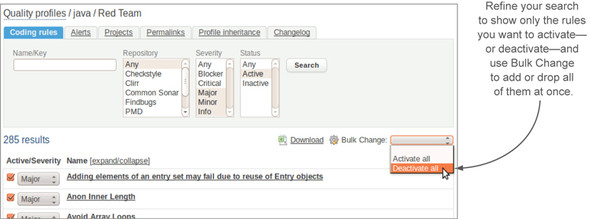
Figure 13.6. Each selection in the rule search accepts multiple options. Directly under the search form, a Bulk Change drop-down menu lets you activate or deactivate every rule on the page at once.
Now that a parent profile is in place, you can follow a similar copy/modify strategy to create Green Team’s profile. Start again with a copy of Sonar way with FindBugs, and then click-through to the list of rules and deactivate all the Blockers and Criticals: all those that will be inherited from the Red Team profile. Then click the Profile Inheritance tab. By default, this part of the interface is pretty spare, except for the yellow editing box at right where you can set a profile’s parent (as shown in figure 13.7).
Figure 13.7. The Profile Inheritance tab lets you set a parent profile. It also reports on a profile’s lineage, including the number of rules the current profile inherits.
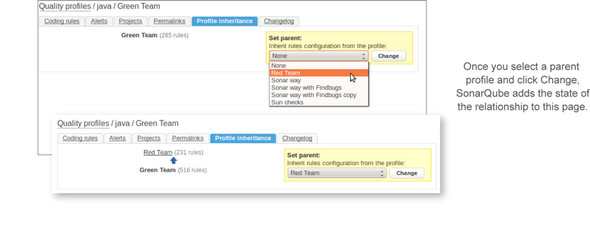
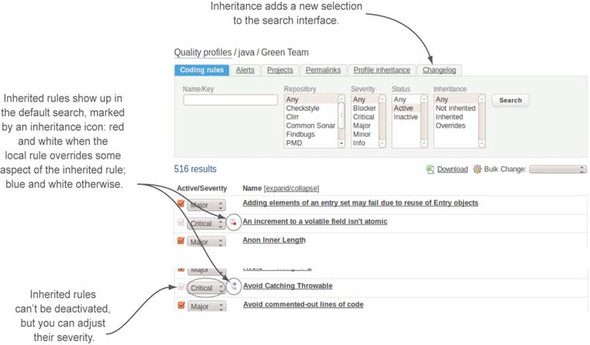
Once you’ve set a parent profile, the Inheritance tab shows how many rules the profile has in total and how many of those rules are inherited. From here, head back to the Coding Rules tab. The interface has changed a bit, as shown in figure 13.8.
Figure 13.8. Inherited rules appear in a profile’s rule search. You can’t deactivate them, but you can change their severity. If you do change an inherited rule’s severity, its inheritance icon changes to one that’s partially red.
13.2.2. Managing the relationship
Starting from the top, you now have an extra selection in the search interface: Inheritance. Among the rules, you now see not only the rules explicitly included in the profile, but also the ones inherited from the parent profile. Those inherited rules are denoted with a blue and white inheritance icon to the left of the rule name, and they can’t be removed from a child profile (the check box is greyed out), but you can still adjust their severities. If you do adjust the severity of an inherited rule, it’s reported inline with a different inheritance icon: this one is red and white to show that the rule is out of synch.
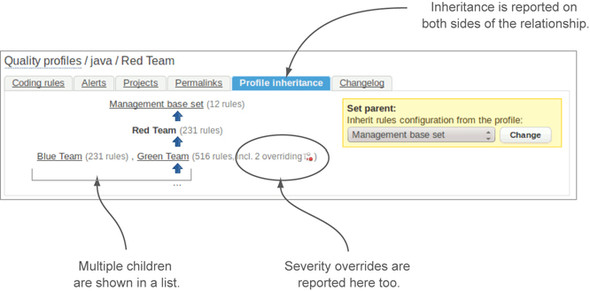
The total number of overridden rules also appears on the Profile Inheritance tab, which displays not only a profile’s parent but its children as well. Figure 13.9 demonstrates that with an updated shot of Red Team’s profile inheritance. We’ve added a stubbed-in profile for Blue Team and given Red Team a parent: a Management Base Set profile, into which we’ve moved all the Blockers.
Figure 13.9. The Profile Inheritance tab reports not only on the inheritance relationship, but also on the state of it, showing the total number of overridden rules.
If you decide you’d like to revert an overridden rule to the parent profile configuration, click the rule name to expand the rule details section. (When you click a rule name in the issues drilldown, you get a pop-up, but here it’s a different behavior.) We’ll cover most of what you see in the rule details section in a moment. The thing to focus on here is the grey block, which you can see in figure 13.10.
Figure 13.10. The rule details for an inherited rule contain a summary of that rule’s inheritance status in the current profile. If you’ve overridden some aspect of the rule, such as severity, you can realign the rule with the parent profile using the Revert to Parent Definition button, which only appears conditionally.

13.3. Rule editing
Now that your profiles are set up, there are a couple other ways you may want to tweak their rules. In addition to adjusting a rule’s severity, you can make up to three other types of edits: you can add a global extension to the rule description; add a profile-specific note; and, in some cases, adjust the rule’s parameters.
To make those edits, start again from your profile’s Coding Rules tab and click the rule name to expand the rule details section. At the top of the section, you see the same rule description that’s in the pop-up you get when you click a rule name from the issues drilldown. Below that are a few links, and maybe some inputs.
The links are Extend Description and Add Note. The inputs are rule specific, and we’ll look at them first.
13.3.1. Customizing individual rules: editing rule parameters
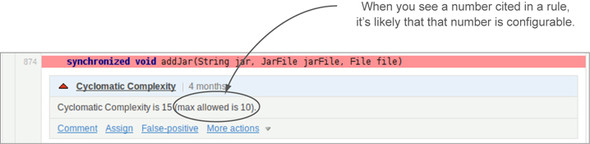
The rule sets for most languages offer a handful or so of rules that accept configurations. For Java, it’s perhaps a double handful. Unfortunately, no reliable rule of thumb lets you know ahead of time whether a rule is configurable, especially from the issues drilldown, which is where you’re likely to spend the most time looking at rules. If you see a rule that cites a number, such as the Cyclomatic Complexity rule shown in figure 13.11, it’s highly possible that the number is configurable.
Figure 13.11. Rules that cite specific numbers are often configurable, but they’re not the only configurable rules.
A rule doesn’t have to cite a number to be configurable. The only way to know for certain is to look at the rule details section in the Coding Rules tab. If the rule is configurable, its details section includes a form. There is one shortcut to finding all the configurable rules in your profile: use the expand/collapse link at the top of the rule list to show all the rules’ details at once and skim down the page, looking for form inputs. Figure 13.12 shows a couple of editable rules.
Figure 13.12. The variety of possible rule configurations is as wide as the rules they configure, from simple integers and Booleans to regular expressions, method names, and package names.

Once you find a configurable rule, how to make the configuration change should be pretty obvious from the context of the rule, the inline explanations next to the field, or both.
Rule parameters are one place you might thank profile inheritance (if you’ve chosen to use it). The parameter edits you make in a profile are unique to that profile; and every other profile can have those parameters set to different values. But parameters set in a parent profile will be inherited by the child, just like the rule is. And just like the severity of an inherited rule, an inherited rule’s parameters can be overridden at the child level, marking the rule and the profile as out of synch with the parent.
As you edit your rule parameters, there are only a couple of things you need to keep in mind. First, unlike every other edit you’ve seen so far on this page, these changes are not saved automatically. You must explicitly click the Update button for every single field you change. The second thing is something you can probably predict at this point: you need to run a new analysis to see your changes take effect.
13.3.2. Cookie-cutter rules: the ones you can duplicate
There’s a subset of editable rules that you probably won’t want to edit directly, although you can if you like. They’re the copyable rules, and typically they’re copyable because you’ll want multiple variations on the configuration.
To try this, find a copyable rule. Again, there’s no way of knowing whether a rule is copyable without looking at its details, but the trick of expanding the rule details works here too. Click the link, and then do a find on the page for Copy. Or you can use the rule we did, Comment Pattern Matcher, which is the rule you need if you want to use the Tag List plugin mentioned in earlier chapters. You should be able to find it pretty easily by entering comment in the Name/Key search input. Just be sure all the selects are set to Any.
When you’ve found the rule and expanded its details, a Copy Rule link appears at lower left. Click it, and you’ll see that the process is pretty transparent, as shown in figure 13.13. Typically, you make copies of this rule to find //TODO and //NOSONAR comments. We’ve created a copy for a third comment, //FixMe, which would be relevant only if it was a something your team used regularly.
Figure 13.13. Copying a rule is a straightforward process, from the Copy Rule link to filling in the rule details (including the description that will be used in the rule’s pop-up). After you’ve created the rule, you land back at a search result for it so you can enable it in your profile.

Note that creating a rule copy doesn’t automatically enable it in the profile you were working in. That’s because in making that copy, you haven’t made a change that’s local to that rule set. Instead you’ve created a new, globally available rule. You can enable it in your current rule set. Or not. You can also choose to enable it in every other rule set you have for that language. And if you decide not to enable it in any of them, that’s fine too. It’ll still be waiting for you in the inactive rule list when you’re ready to use it.
If you want to edit the parameters of your rule copy, the interface is the same as for any other editable rule. But when you expand the rule details, you’ll notice an extra option on these rule clones: Edit Rule, as shown in figure 13.14.
Figure 13.14. The process of creating new rules by copying is a forgiving one. Want to change the default severity? Use the Edit Rule link. Ditto the name and the description. If you decide you didn’t need the rule after all, you can always delete it.
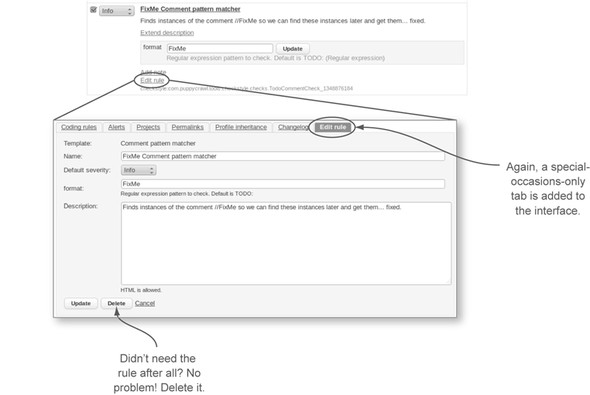
In addition to having the option to edit all the fundamentals of a copied rule (including the name), you also have the option to delete it. What’s that? You’ve already got issues racked up against your copy? No problem. Nothing blows up when you delete the rule, and the issues against it go away with the next analysis.
13.3.3. Extend Description: the rest of the story
Using the Extend Description link you’ll find on every rule makes a global change, similar to duplicating rules. It affects all profiles, not just the one you’re working in.
Why would you want to extend a rule description? Poke around in SonarQube long enough, and you’ll find a rule with a description that’s useless at best. For instance, the description of the Parameter Assignment rule is “Disallow assignment of parameters” with no indication of why that’s a bad idea. Another reason to extend a description would be to add specifics about your environment.
To get started, click Extend Description. Doing so expands an editing form into the page, as shown in figure 13.15.
Figure 13.15. Extend the description of a rule in one profile, and you’ve extended it for all profiles. You can use limited markdown syntax to help get your point across.

Again, these changes aren’t auto-saved; you have to explicitly submit them. Once you do, they’re reflected everywhere immediately, both when you browse to other profiles and when you click a rule name from the issues drilldown. You can also edit your extended description from any profile, not just the one where you originally extended it.
13.3.4. Notes: profile-specific records on individual rules
As you edit your profiles, adding rules and adjusting parameters, you may find yourself wishing you could annotate why you changed a certain parameter or why you included a given rule in the profile. That’s what the Add Note link is for. Using it adds a profile-specific note that’s displayed in the note details, as figure 13.16 shows.
Figure 13.16. Rule notes are profile-specific reminders you can set on any rule. They appear when you expand the rule details in the profile administration interface, and nowhere else.

Rule notes have a very limited life. They only appear in the profile administration interface; they aren’t added to the rule’s issues drilldown, because they’re intended to be an admin’s “note to self” sort of annotation. And because they’re profile-specific, dropping a rule from your profile drops your notes on it as well. Further, notes made on a rule in a parent profile aren’t inherited by child profiles, and adding a note to a child profile does not mark an inherited rule as overriding.
At this point, you know how to make all the rule-related changes that are possible in a profile. Next we’ll look at alerts, which aren’t related to rules at all.
13.4. Alerts: knowing when your metrics have crossed the line
In addition to modifying the rules in a profile, you can also set alerts, which are metric-based warning and error thresholds. When you set an alert on a profile, any project analyzed with that profile will have an alert raised against it if it crosses one of those thresholds.
Even though a profile is primarily about rules (and therefore issues), you can set an alert against any metric: issues certainly, but also duplications, documentation, complexity, and so on. Alert setup and maintenance is found on the Alerts tab of the profile maintenance interface, as shown in figure 13.17.
Figure 13.17. You can set as many alerts as you’d like. They’re simple Boolean tests against metric thresholds.

You have the flexibility to set either warning or error thresholds, or both at once. To set one up, you choose the metric to monitor, the Boolean operator to use, and the threshold to test. If you do, you may be surprised to see a colorful new widget appear on your dashboard. The alerts widget isn’t displayed on projects that are analyzed with alert-less profiles, but it will pop into view after your first analysis once you’ve set alerts. Its background color gives you at-a-glance insight into a project’s alert status, and its contents provide the specifics, as shown in figure 13.18.
Figure 13.18. SonarQube gets more colorful once you’ve set up alerts. The alert widget, shown three times on the left, uses a stoplight scheme to convey alert status. Any other widget that displays an alerted metric will also use color if the value has crossed an alert threshold, as shown with duplications on the right.

In addition to the colorful presentation of the alerts widget itself, other widgets may start to show additional color once you’ve set alerts. As the right side of figure 13.18 shows, a metric that has crossed an alert threshold is displayed on a colored background to draw your attention to the problem. But you only see red (error) and yellow (warning) backgrounds on these metrics; acceptable metric values aren’t presented on green backgrounds.
Setting and seeing alerts is easy, but choosing alert metrics is a little more tricky. Some alerts are probably obvious: Blocker issues > 0 is an attractive alert because Blockers need immediate attention. But what about Criticals? Clearly you don’t want any issues in your project, but from a practical standpoint can you set up an alert on Critical issues > 0? For a brand-new project it may work; but set that alert on a profile that’s used by legacy projects too, and you’re likely to see your dashboards light up like Christmas trees. Sure, Criticals need attention too, but alerts are like salt: best used in moderation.
Fortunately, SonarQube offers the ability to set differential-based alerts, so that you can raise an alert when the number of Criticals increases versus any of your differential periods. Percentage metrics offer another handy option. In chapter 8, we advised you against using percentages for goal setting because they fluctuate based on project size, but they make good alert candidates because they can help you balance that brand-new, probably tiny project against your lumbering giants of legacy projects. Going back to Criticals, there’s no Critical % metric to set an alert on, but there is a Rules Compliance Index metric, which factors the size of the code base against the number and severity of its issues.
Also looking backwards, you may remember that chapter 9 talked about using the Build Breaker plugin to mark your continuous integration build as failed if the SonarQube analysis raised any alerts. That way you can take advantage of the notification mechanisms available in most CI platforms to raise the alarm for new alerts, rather than having them wait passively (if colorfully) in SonarQube to be found.
Now that you know what alerts are, how to set them, and how to recognize a metric value that has raised an alert, we’ll move on to how to track all the changes you’ve been making to your profile, including what is tracked and what isn’t.
13.5. How to track profile changes
You’ve edited your rule set, edited the rules themselves, and probably set some alerts. At the beginning of this chapter, we advised you to start your profile journey by making a copy of your favorite profile and modifying it. At this point, your copy could be pretty far afield from where you started. Or maybe not. There are two ways you can keep up with those changes. The profile changelog gives you a granular record of changes to a profile, and the ability to compare two profiles will give you a summary of how far you’ve diverged from the source.
13.5.1. Changelog: who did what, when
Not surprisingly, you’ll find the granular log of your changes under the Changelog tab in the profile editing interface. The changes recorded here are the ones that would affect an analysis. So setting an alert doesn’t appear because it doesn’t impact the metrics that come out of analysis; it just reports on them. Neither will adding a rule note or extending a rule description.
What does appear here are the times when you’ve added or removed a rule, and when you’ve changed a rule’s severity or parameters—when you’ve made changes that will affect an analysis. Each of those changes is recorded granularly, so adding a new rule to your rule set and then adjusting it from the default severity appears as two distinct items in the changelog, as shown in figure 13.19.
Figure 13.19. Each change you make to a rule set is recorded granularly.
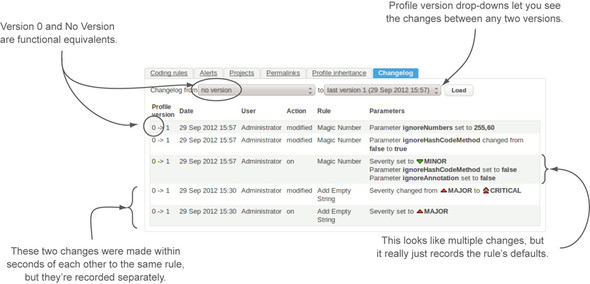
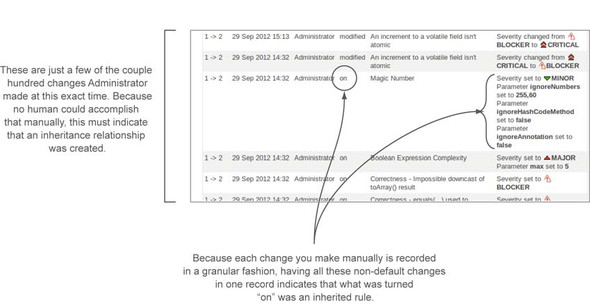
Interestingly, profile inheritance changes are reflected in the changelog, but not in the manner you might expect. Recall that Russell has set up several profiles. The Red Team profile is a conservative set of only Blocker and Critical rules. The Green Team profile inherits from Red Team and adds rules of lower priorities as well. When that inheritance relationship is established (when he picked the Red Team profile as the Green Team’s parent profile), what was recorded in the changelog was not the establishment of that relationship, as you can see in figure 13.20. Instead, the Green Team changelog shows (granularly) the addition of every single rule in the Red Team profile. In fact, the relationship between the two profiles isn’t explicitly reflected in the changelog, because the relationship has no impact on an analysis. The rules that come with that relationship do, so they’re what’s recorded.
Figure 13.20. Setting or revoking an inheritance relationship between profiles isn’t explicitly recorded in a changelog, but you can nonetheless find clues to a relationship. For instance, the addition or deletion of a couple hundred rules in the space of a minute is a strong indicator. An irrefutable one is the presence of multiple changes in a single record, because SonarQube doesn’t record changes made manually in that way.
Similarly, if you override some aspect of an inherited rule or revert the rule back to the parent definition, the change is recorded, not the impact on the relationship. Even so, the changelog holds clues to the relationship, if you know what you’re looking for, as figure 13.20 shows.
13.5.2. Profile versions: when changes go into production
Now that you’ve seen a couple of changelog excerpts and you understand what is recorded in a profile version, you may be wondering about the versions themselves. Profile creation is version 0, and your initial changes afterward go into version 1. But when does version 1 end and version 2 begin?
The version number changes when you run an analysis. That’s because profile changelogs aren’t about the profiles at all. Instead, they’re about the changes you’ve made to a profile that will affect an analysis. Just as you’d change a program’s version number when you put changes into production, a profile’s version number is incremented when its changes go into production: when you perform the next analysis with it.
The Changelog tab is the only place in the profile editing interface that you see any reference to a profile’s versions. But they’re referenced in the projects that use the profile, as figure 13.21 shows.
Figure 13.21. The description widget and the events widget both reflect profile version changes.
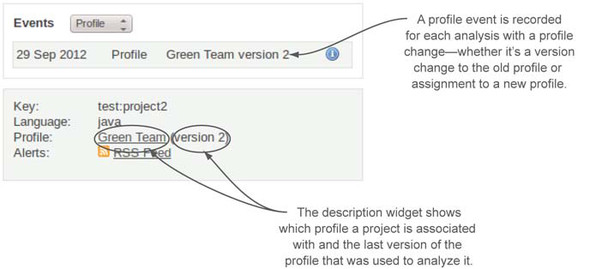
Because everything in SonarQube revolves around the analysis, the description widget shows a project’s assigned profile and the last version of the profile that was used to analyze the project, which isn’t necessarily the most recent version of the profile. Profile version changes also appear in a project’s events (an event is recorded for every analysis with a profile change) and history. Again, keep in mind that the history of an infrequently analyzed project may not reflect every single version of a profile.
13.5.3. Profile comparison
At the beginning of this chapter, we advised you to start your profile editing journey by making a copy of your favorite profile and editing it. At this point, your copy could be pretty far afield from where you started. Or not.
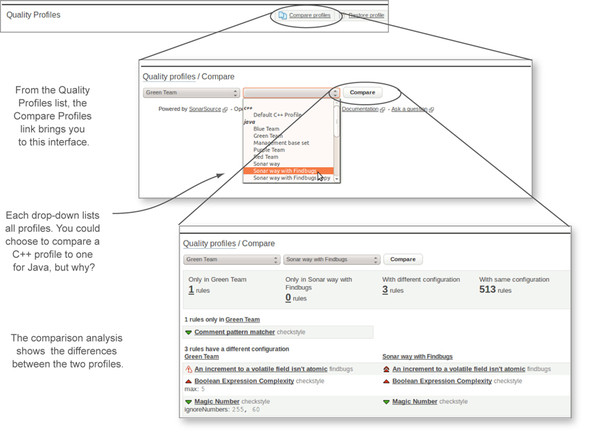
Fortunately, there is a way to tell. At the top of the list of quality profiles is an unobtrusive link: Compare Profiles. Click-through, and you’ll find yourself at a simple interface showing two drop-down menus. Each one lists all available profiles. To find out how far you’ve strayed from the profile you copied, choose them in the drop-down menus and click the Compare button. Figure 13.22 shows the results for the Green Team.
Figure 13.22. You access the profile comparison interface from the Compare Profiles link at the top of the list of profiles. It lets you compare any two profiles, regardless of language, and shows the differences in summary form at the top with a list of details at the bottom.
With changelogs and profile comparisons under your belt, you know 95% of everything you need to fully and successfully administer your profiles. We’ll cover the last 5% in the next section.
13.6. Administrative miscellany
At this point, we’ve discussed the meat of profile administration. But before we close the chapter, you need to know about a few more things: project assignment, backup and restore, and permalinks. Unfortunately, there’s no good unifying theme among these topics, which is why we’ve punted and named this the miscellany section. We’ll start with project assignment.
13.6.1. Project assignment: which project uses which profile
We covered the topic of the default profile and assigning a project to a profile in chapter 2, but it deserves at least a mention here. Every language SonarQube can analyze has a default profile: it’s the one marked with a green check in the list of profiles. Changing the default is as easy as clicking the Set as Default button next to a different profile. When you do, the next analysis of each project that hasn’t explicitly been assigned to a different profile will be run with the new default.
If you have projects that you don’t want analyzed with the default profile, you can explicitly assign them to the profile you do want them analyzed with. To do that, click-through from the list of profiles on the target profile, and choose the Projects tab. Figure 13.23 shows the interface.
Figure 13.23. Use the interface on the Projects tab to assign projects to a specific profile for analysis. This works even on the uneditable profiles.

Once you’ve assigned a project to a profile, all its subsequent analyses take place with that profile—unless you override that choice by using the sonar.profile parameter at analysis time to specify a different profile, which isn’t something you should do on a regular basis (if at all). One reason is that although a project’s assigned profile appears on the project dashboard in the description widget, an analysis-time override of the assigned profile is not reflected there.
13.6.2. Profile backup and restoration
The mechanics of backing up a profile and then restoring it are fairly simple. The Quality Profiles page has a Backup button on each non-default profile. Click it, and SonarQube spits out an XML file. Save that to disk, and presto! You have a backup.
But a backup of what? Browse around in that file, and you’ll find only two things: the profile’s alerts and its rules. The backup includes your rule parameters, but it doesn’t include any rule notes, the profile’s changelog, or its assigned project list.
And although the backup includes every single rule in the profile, including the inherited ones, it doesn’t include any indication of the inheritance relationship. So restoring that backup gives you back every rule, but you have to handle resetting inheritance manually.
But that raises the question of restoration. There’s a Restore Profile link at upper right in the list of profiles. Click it, and a form pops up as shown in figure 13.24.
Figure 13.24. The Restore Profile link at the top of the Quality Profiles page adds a form that allows you to restore a backup. Just make sure you aren’t trying to restore over an existing profile; you need to delete the current copy first.
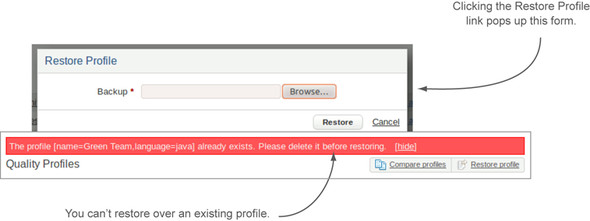
Restoring a backup is a simple matter of uploading it. Just be sure you’re not trying to restore an existing profile.
13.6.3. Permalinks
A project’s permalinks are a little like a backup. Each rule engine–specific link gives you a list of the profile’s rules from that engine. Filed under the Permalinks tab in the profile administration interface, you’ll find an All Rules link—which is another way to access the backup file—and a link for each rule engine available for the language.
At the beginning of this chapter, we looked at creating profiles from scratch. In that from-scratch interface, you have the opportunity to upload rule engine–specific rule files with which to seed the profile. At the time, we dodged the question of where those files would come from. Well, this is one source.
Like a profile backup, the engine-specific files contain your parameter settings. But because each of these files is generated in a format specific to the rule engine in question, don’t look for your rule notes, because they’re strictly a SonarQube-only thing.
With permalinks, backups, and project assignment under your belt, you now know everything you need to about how to administer SonarQube profiles.
13.7. Plugins
A number of plugins make new rules available, but most of them are better covered in other places. We’ll cover only two plugins in this chapter: Switch Off Violations and our old favorite, Widget Lab.
13.7.1. Switch Off Violations
The Switch Off Violations plugin gives you the option to turn off rules in a fine-grained way. Why would that be useful? Let’s say you have a profile that’s being applied to both JEE and Swing applications. They’re both flavors of Java development, but they’re very different in focus and method. And the Swing developers are complaining about the “Unused formal parameter” rule.
They keep being dinged by it, but they say they can’t help it because they didn’t choose the method parameters; those are set by the Swing API. If they want their app to work, they have to use the method signature dictated by Swing, regardless of whether they need the parameter. They’re lobbying to turn off the rule, but the JEE developers want to keep it on. You could split their rule sets, but if there are only a few points of contention, it might be better to just turn off the use of that rule for the Swing trouble spots. That’s what the Switch Off Violations plugin lets you do.
Using settings at a global or a project level, you can configure as many exclusions as you’d like. Each exclusion is one of the following:
- A pair of regular expressions to mark the beginning and ending of blocks that should be completely ignored by the rules. This is useful, for instance, when you’re dealing with NetBeans’ auto-generated code.
- A regular expression describing files or packages to be ignored.
- A combination of the file/package name regular expression, the key of the rule to be ignored, and a set of lines or line ranges, such as [4,23-50,72-81]. Leave the Lines input blank to have the exclusion cover all lines.
13.7.2. Widget Lab
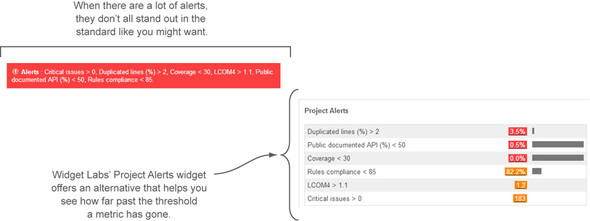
The other plugin for this chapter is Widget Lab, which we created to fill what we saw as gaps in SonarQube’s display of data. It’s relevant here because it offers an augmented alerts plugin. In the earlier figures, you may have noticed that when there are multiple alerts, they’re displayed together in paragraph form. Although that gets the point across, it doesn’t grab you as hard as we thought it should. So we offer an alternative, shown side by side with the standard widget in figure 13.25.
Figure 13.25. Whereas the standard alerts widget (left) presents all alerts in paragraph form, the project alerts widget (right) breaks out each alerting metric for a clearer picture of what’s past its error threshold and what’s at warning stage. The bar graphs to the right show you how far out of compliance the metric is.
13.8. Summary
This chapter has been a primer on profile management. You saw how to create a new profile (making a copy is usually much less work than starting from scratch) and how to set up profile inheritance. You learned how to include rules in and exclude them from your profiles and how to adjust their severities, and you learned to do lower-level edits of the rules themselves: their parameters, notes, and descriptions. We also showed you how to create alerts and how to pick good alert metrics.
You saw that you can track a profile’s drift from the one you copied either by comparing the two profiles or by looking at your profile changelog. And you saw that profile changelogs and backups are rule-centric. Although a backup contains your alerts, the changelog doesn’t; and neither reflects inheritance, rule notes, or rule-description extensions, because none of those things affect an analysis.
By learning to manage your profiles, you may feel you’ve mastered all the administration you need, but you’re just scratching the surface. In the next chapter, you’ll see how to configure filters and global dashboards to put the data that’s most important for your organization front and center. You’ll also learn how to set up notifications so that SonarQube notifies you (and your users) via email when there are new issues on one of your favorite projects.