
Chapter 11. IDE integration
- What’s supported
- Setting up Eclipse
- Working your assigned issues
- Running a local analysis
Rules that show you what’s wrong and rule descriptions that point you in the right direction for fixing the problems can help green developers become good developers, and good developers become even better. SonarQube gives you both.
But with SonarQube in place, your code quality is visible. Mistakes are no longer private or anonymous—the SCM Activity plugin pastes your ID next to each line of code like a billboard. Now there’s team and even management focus on mistakes.
Of course, visibility into code quality is supposed to be a good thing. Co-ownership of the code and team spirit (agile practices) should focus on getting things done, not on placing blame. After all, issues aren’t for pointing the finger but for increasing software quality. In the best situations, that’s exactly what happens: each issue is a teaching opportunity. But in other situations, the attention SonarQube brings to code quality isn’t always positive.
It’s been likened to cruising down a highway and suddenly finding yourself in a lazy little speed trap of a town. Sure, SonarQube posts the speed limit; but if you don’t know how fast you’re going until after the cop tells you what speed he clocked you at—after the next analysis runs—well, it can seem a little unfair.
That’s especially true because most developers—most good developers—are passionate about good code. Tell us ahead of time what the problems are, and we’ll get them fixed. Embarrass us with them later, and we’ll get ... resentful.
Fortunately, IDE integration offers a solution by allowing you to check your code the same way SonarQube will before you check it in. But in the world of SonarQube IDE integration, there are definitely first- and second-class passengers. If you work in Eclipse, then welcome to first class. Would you like a glass of champagne before we take off? If you spend your days in some other IDE, you still get to board the plane (we’ll look at what’s available to you), but your flight won’t be as comfortable.
In this chapter, we’ll look at both classes and show you what’s available to each. First-class passengers will see how to set up SonarQube’s plugin for Eclipse and start making the most of it with issue management and local issue scanning. For those not traveling in first class today, we’ll discuss how to pull the rules in your profile out of SonarQube for import into your IDE of choice.
If you’re not an Eclipse user, and you’re jealous because you wish you had access to the same level of integration, consider this: Eclipse is free and open source and supports development in a number of the same languages that SonarQube can analyze, including (but not limited to) C/C++, C#, Cobol, Flex, JavaScript, JSP, PHP, PL/SQL, Python, Natural, XML, and of course Java.
If you’re not yet convinced to try switching environments, you might also like to know that the trend has been for the SonarSource folks to migrate language plugins away from third-party rules engines to native, SonarQube-only ones. So, the ability to pull your SonarQube rules into other IDEs and run them without SonarQube may eventually disappear.
11.1. What’s supported
As the weekly code review ends, Susan looks down the table. “Okay Joe, how’d you do it?” He nearly suppresses a tiny smirk. “Do what?”
Susan laughs. “Come on, don’t B.S. me. I got spanked this week for adding three issues in last night’s build and forgetting to clean up one of the old issues assigned to me. Usually you’re the goat, but you didn’t add a single issue this week and you handled all the ones you were assigned. You must have a trick.”
Joe considers. “I shouldn’t tell you for a few more weeks. I like being the golden child for once.” At Susan’s look, he hurries on: “But, because I owe you ... I installed that Eclipse plugin.”
She smirks. “I didn’t know there was a plugin for the Easy button.”
“Har. No, seriously, the SonarQube a plugin. It lets me prescan my code before I check it in so I can make sure I’m not adding new issues.”
Susan’s eyebrows rise. “That sure would have helped me yesterday.”
“Yeah, and I can see all the issues assigned to me right there in Eclipse. For each one, I get everything I see in SonarQube, plus I can double-click an issue to jump straight to the code. And once I’m done, I can set the issue to Resolved without having to open a browser.”
As Susan and Joe head back to their desks, her voice floats back. “Huh. Looks like there might be more than one golden child next week.”
Susan and Joe can take full advantage of SonarQube from within their IDE because their team uses Eclipse; but as we’ve said, there are two flavors of IDE integration: Eclipse and everything else. We’ll spend most of this chapter on Eclipse, but first let’s look at what everyone else gets. (Eclipse users may want to skip ahead to section 11.1.2, “Eclipse support.”)
11.1.1. Generic support
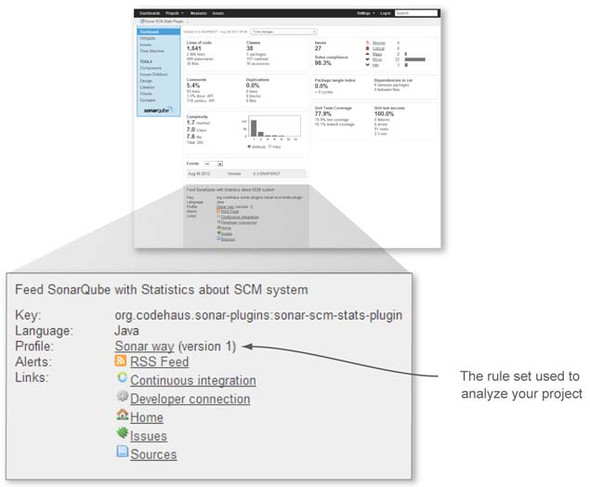
Assuming your IDE has integration with the source code analysis engine(s) that SonarQube uses for your language of choice, then the integration you get is the ability to check your code against the same rules SonarQube will use before you check it in. To do that, you have to pull those rules into your IDE manually. On the SonarQube side, that starts from the description widget on your project’s dashboard, which shows the profile it’s analyzed against, as shown in figure 11.1.
Figure 11.1. The description widget provides some of the static vitals of a project, including which profile it’s analyzed with.
Click-through on the profile name, and you’ll find yourself at the profile’s list of rules. Select the Permalinks tab, as shown in figure 11.2.
Figure 11.2. Each profile makes its lists of rules available as XML documents: one for each rules engine and one for the profile as a whole.

On this tab is a link for every rule engine relevant to the language—whether or not it’s used in the profile. Each one leads to a list in XML format of the rules from that engine that are in the profile. Once you have your lists of rules, the mechanics of importing them into your IDE obviously vary from editor to editor, but it’s possible to do in many popular IDEs (including Visual Studio, NetBeans, and IntelliJ IDEA). Typically this is done by adding a plugin for the rule engine to your IDE and then using the plugin’s management options to import the XML rule set.
After you import your rules, whether scans are triggered automatically or manually depends on what’s offered by your IDE. But at least you can double-check yourself before committing your code changes. Just keep in mind that you won’t be running any SonarQube-native rules, and you’ll need to reimport if your rule set changes. If those restrictions are too confining, then you may want to take advantage of the Issues Report plugin, which we’ll detail at the end of the chapter. It doesn’t integrate with any IDEs, but it does give you the ability to run local scans against your full rule set—without the need to keep a local copy of the rules in sync with the server.
11.1.2. Eclipse support
If you’re working in Eclipse, SonarQube integration is a lot easier and more richly featured for you than for everyone else. You have to trigger scans manually, but you don’t have to manually import the rule sets. Instead, they’re pulled from SonarQube as part of the scan. There’s no need to notice when your profile has changed and reimport the rules, because that happens automatically. SonarQube integration helps you bring your code quality efforts full circle.
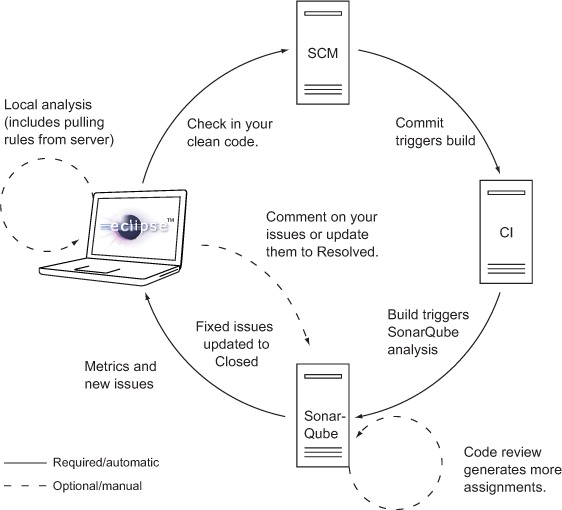
It’s not just a one-way trip from your IDE through source-code management and continuous integration into SonarQube. Now you can pull what SonarQube has to say directly into your IDE, completing the cycle, as shown in figure 11.3.
Figure 11.3. The SonarQube plugin for Eclipse helps you close the circle of code quality. It gives you local visibility into existing issues in the files you’re working on, helps you manage your issue assignments, and lets you prescan your code changes for issues.

Once you’ve closed the circle, in addition to being able to pull up a list of issues for a project, package, or file, you also get a SonarQube issue tree in the markers view and a warning in the problems view for each issue, as well as a marginal marker for each issue. If you’re working in Java, you’ll notice that some of the native Eclipse warnings duplicate SonarQube rules. For an unused method, for instance, you get both a SonarQube issue marker and an Eclipse warning. If the duplication bothers you, you can turn off the Eclipse warnings at the project level (right-click the project in the Package or Project Explorer, and choose Properties) or globally (Window > Preferences). You’ll find the warning settings under Java > Compiler > Errors/Warnings.
In addition to displaying the issues on your code as you work, SonarQube integration also closes the circle with issue-management functionality. You can view your assigned issues, comment on them, and mark them resolved.
11.2. Setting up Eclipse integration
The SonarQube integration for Eclipse is pretty nice, but before you can use it, you’ll need to set it up. There are four steps:
1. Install the SonarQube plugin for Eclipse.
2. Configure your SonarQube server.
3. Link your workspace project to the copy on SonarQube.
4. Add the SonarQube views to your current perspective.
None of the steps is hard, and, assuming you have a decent internet connection, they shouldn’t take long.
11.2.1. Installing the plugin
Eclipse makes plugin installation in general fairly painless. The most important thing to know for any plugin is the URL of its update site. In this case, it’s http://dist.sonar-ide.codehaus.org/eclipse.
With the URL for the update site in hand (or on the clipboard), go to the Help menu and choose Install New Software. You’ll get a dialog like the one shown in figure 11.4.
Figure 11.4. Eclipse plugin installation starts with the URL of a download site. From there, Eclipse takes over, checking dependencies, retrieving all the pieces, and getting your agreement to the appropriate licenses.

Enter the URL in the first field, and press Enter. Eclipse checks the site and recursively fetches the list of downloads for the plugin. Alternately, choose Help > Eclipse Marketplace. Search for Sonar, and, once the plugin is found in the Marketplace, click its Install button.
Note
We mentioned earlier in this book that SonarQube used to be called Sonar. Similarly, SonarQube’s issues used to be called violations. This chapter was last revised when that transition was incomplete. Those name changes were made at the server but not yet in Eclipse. That’s why you’ll see references in this chapter to Sonar and violations. Please treat them as synonyms for SonarQube and issues.
Installation via either avenue is remarkably similar from this point. In the list of plugin components, select the components you want, including those needed for the languages you’d like to analyze in Eclipse plus any optional components you’re interested in. Once you’ve picked all your components, click Next. On the next screen, you have a chance to review a granular list of downloads. Click Next again, and you’re asked to agree to the components’ licenses. After you do, the downloads begin.
Note that it’s common to get security warnings about unsigned content while installing Eclipse plugins. These warnings make you explicitly accept the risk in order to continue with the installation. We typically say OK and finish the install, but you have to make your own security decisions.
After a successful installation, you’re urged to restart Eclipse. Go ahead and do that.
11.2.2. Configuring the server
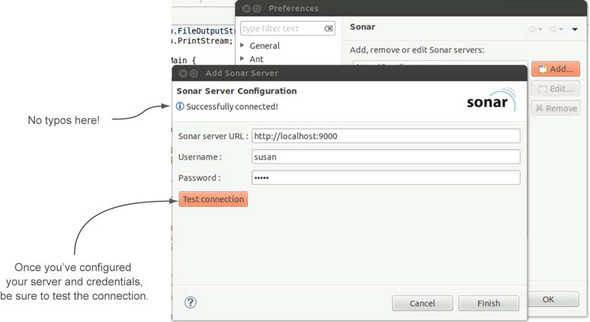
When Eclipse comes back up, you need to tell it where your SonarQube server is. Choose Window > Preferences, and then expand the Sonar option in the Preferences dialog and choose the Servers suboption. A Sonar server at localhost is preconfigured. Click Add to set up a server on another host, or edit an existing entry. You should configure not only the server location, but also your SonarQube credentials. Figure 11.5 shows the dialog.
Figure 11.5. At minimum, you need to tell Eclipse where your SonarQube server is. If you want to be able to manage your assigned issues from within Eclipse, you also need to set up the credentials you use to log in to SonarQube. If your SonarQube authentication is integrated with LDAP, don’t forget that you’ll need to come back here after a password change!
11.2.3. Project association
Now that Eclipse is configured, it’s time to configure the project. From the Package Explorer—or from the Project Explorer—right-click the project, and choose Configure. In the submenu, pick Associate with Sonar, as shown in figure 11.6.
Figure 11.6. To associate your project with SonarQube, type the project name in the Sonar Project field, if it’s not prefilled for you.
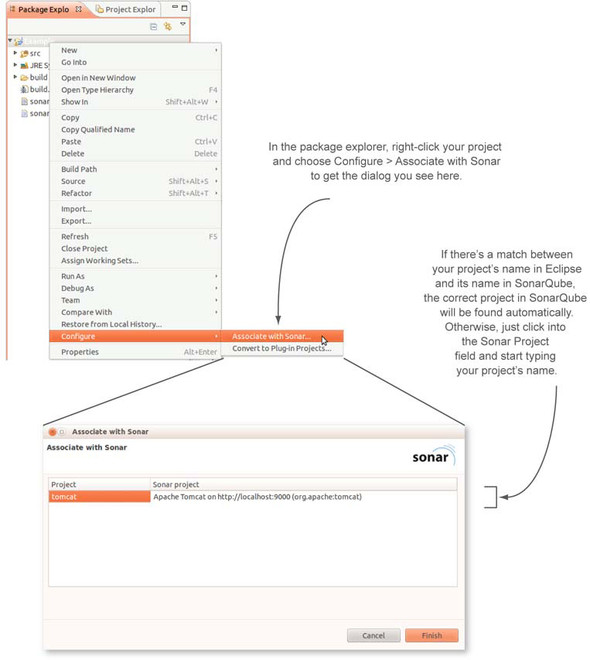
If you’re using Maven, or if your project’s name coincides with its key in SonarQube, it’s nearly effortless from here—the plugin automatically searches your servers for projects with a matching name and fills in the most likely match. But if you’re not using Maven and your project names in Eclipse and SonarQube don’t match, you have to do a little more typing: click into the Sonar Project field, and enter your project name. When you click Finish in this dialog, Eclipse immediately begins loading your project’s data from SonarQube. Once that load is complete, you may notice additional markers in the Eclipse interface, as shown in figure 11.7.
Figure 11.7. SonarQube linking adds several markers to the Eclipse interface, including one on the project and a marginal marker for each existing issue synched in from the server. Existing issues also show up as warnings in the Problems view.

Now you’ll want to make a few changes to your current perspective to make the most of the Eclipse plugin. Choose Window > Show View > Other. In the Show View dialog, several options appear on the Sonar menu, but we’ll only work with Sonar Issues and Sonar Issue Editor in this chapter.
11.3. Working your assigned issues
At the beginning of this chapter, one of the things Susan got scolded for during code review was leaving one of her assigned SonarQube issues unresolved. Fortunately, the Eclipse integration makes issues easy to find, so you’ll never have to look sheepish for forgetting again (unless that’s the best excuse that comes to mind).
At this point, we’ll assume you’ve followed along and you have the Eclipse plugin fully configured. You should see issues listed in the Sonar Issues view, and you’re about to sort them to find the ones assigned to you. If you don’t have any assigned issues, well ... go assign yourself some low-hanging fruit like missing curly-brace issues or unused imports. Don’t worry about over-committing yourself; this will be easy.
You have two choices for how to do the assignment. You can head for the SonarQube interface in a browser, or you can click an issue in the Sonar Issues view and then switch to the Sonar Issue Edit view. This view does what you might guess—it lets you edit an issue—with the same functionality you get in the SonarQube interface, because what it shows is a tiny slice pulled directly from the SonarQube interface: the issue summary you saw in chapter 10, complete with all the workflow options including assignment. If you included your SonarQube credentials when you set up the server earlier, it even includes the Assign to Me option.
11.3.1. Finding your assigned issues
If you did your issue-assigning from Eclipse, then your Sonar Issues tab updated automatically to show the new assignments. But if you used the SonarQube interface to make the assignments, you may be wondering how to pull them in—they didn’t magically appear when you flipped back into Eclipse. Use the Synchronize button in the Sonar Issues tab, as shown in figure 11.8.
Figure 11.8. Use the Synchronize button to re-synchronize SonarQube issues.
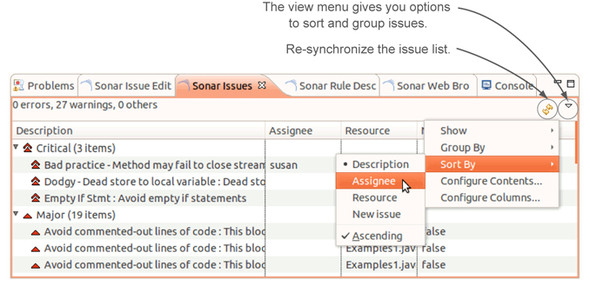
At this point, you probably see a lot of issues in the list. If you’re lucky, the ones assigned to you bobbed to the top. But they probably didn’t. That’s easy to fix, though, and you have a couple of choices for how to go about it. Right next to the Synchronize button is the selector for the view menu, which lets you sort issues by assignee. By default, issues are grouped by severity; but if you set the grouping to None (also in the view menu), all your assigned issues will sort together. Of course, if your name starts with a letter from the middle of the alphabet (you can flip the sort from ascending to descending by clicking the column header), this isn’t the best solution.
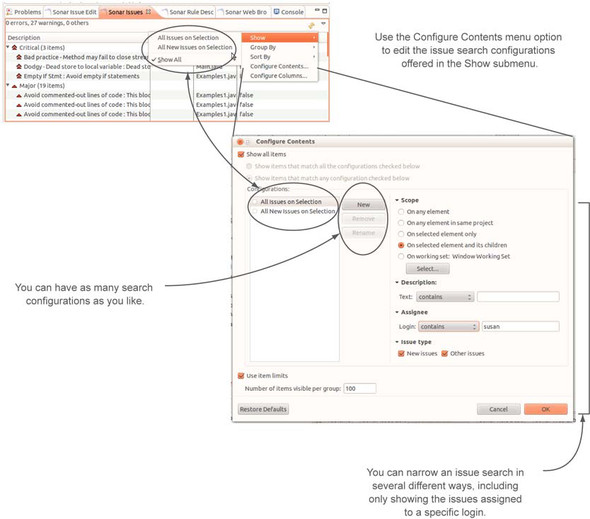
Fortunately, the Configure Contents option on the view menu lets you configure which issues you see. You can even specify multiple issue filters. There are two default filters; you can edit them or add your own, as figure 11.9 shows. Then you can choose to layer them by turning on several at once (use the check box next to the filter name in the Configure Contents interface), or you can turn them all off to see all the issues.
Figure 11.9. You can easily reconfigure the search that underlies the Sonar Issues tab to show only issues assigned to you. In fact, you can configure and save as many searches as you’d like. Once they’re saved, you’ll access them from the Show option in the view menu.
11.3.2. Finding and fixing the code
Now that you have issues to work on, double-click one. Eclipse opens the associated file and puts your cursor on the right line. All you have to do is add the missing curly brace or whatever was called for by the issue you grabbed.
Once that’s done, you may think the issue will automatically be marked Closed, or at least Resolved. The integration is good, but it’s not that good—you have to do that part manually. Head back to the Sonar Issue Edit view, make whatever comments you like, and mark the issue Resolved (under the More Actions menu).
We’ve covered resolving an issue here for the sake of keeping all the issue-related steps together, but normally we’d counsel running a local SonarQube scan first (doing so is covered in the next section). After all, you’d hate to resolve an issue only to have SonarQube reopen it.
11.4. Running a local analysis
By all means, let’s run a local analysis. But first, you may want to find your target issue in the list of issues so you can verify that it disappears after the analysis. Doing this won’t affect the analysis, but we like to see issues disappear from the list, just to make sure.
Now, in the Package Explorer (or the Project Explorer), right-click the project and choose Sonar > Mode > Local. The Console view immediately pops to the front, and an analysis begins. You see it interact with the SonarQube server briefly at the beginning to register metrics and rule repositories and then to select the appropriate rule profile for your project. From that point on, though, it’s a completely local operation. None of these results are stored on your SonarQube server—this analysis is for your benefit only.
The console output during the analysis is similar to what you’re used to, but this analysis doesn’t take as long as most—it’s primarily an issue scan. Other parts of the analysis, such as duplications detection, are left out.
When the analysis is done, you should be able to use the Sonar Issues tab to verify that you have indeed eliminated the issue you were targeting. Notice that all the markers for the issue are gone—not just the item in the list on the Issues tab, but also the marginal markers (and their accompanying mouseovers) that are added for each issue.
You’ve stepped through the whole workflow now, although admittedly not in the optimal order, which is as follows:
1. Pull in assigned issues.
2. Fix issues.
3. Verify your fix with a local analysis.
4. Mark issues resolved.
One thing you haven’t done is close a fixed issue. Remember, that only happens when the root issue disappears during a full SonarQube analysis (the analyses you run locally in Eclipse don’t count).
As a best practice before any SCM commit, we typically open each file we’re about to check in and run a local analysis. Then it’s easy to flip through each file, making sure we’ve fixed what we meant to and haven’t added any new issues. When we’ve run through that cycle enough times to get everything right, it’s time to commit our changes. At that point, the Continuous Integration/Inspection system kicks in and fires off a full analysis. It may take a little while for the changes to churn through the system, but eventually SonarQube closes those issues. You’ve seen the 30,000-foot view shown in figure 11.10 before, but it bears repeating now that you’ve had the opportunity to walk through every step in the process.
Figure 11.10. If everything’s working as it should, you see a virtuous cycle of improved code quality and higher developer productivity from the combination of Continuous Inspection, code reviews, and Eclipse integration.
The next time you want to run a local analysis, you’ll use a different menu item. By default, you start in remote mode, pulling values from the Sonar server. Right-clicking in your project and choosing Sonar > Mode > Local does two things: it kicks off a local analysis, and it flips you into local mode. So next time through, you’ll choose Sonar > Run Local Analysis. If you want to re-pull what SonarQube has on file, then you’ll need to use the remote option: Sonar > Mode > Remote.
In fact, let’s do that now. But first, add an issue. It could be anything—just something you know breaks a SonarQube rule. Then run a local analysis. When it’s finished, you’ll see that your new issue is picked up in the analysis, as expected. What you perhaps didn’t expect is that it gets special treatment. The normal SonarQube marginal marker is a tiny blue SonarQube logo. But for new issues, the logo is red. Further, new issues are marked not as warnings in the Problems view, but as errors, so Eclipse’s error-marking mechanisms kick in: a red X on the project, on each file that introduces new issues, and on the packages that contain them. Run an analysis before each commit, and you’ll never inadvertently add new issues again!
On the other hand, if having new issues presented the same way as compile breaks bothers you (it does bother some people), you can easily turn it off in the global preferences. You’ll find this option under Window > Preferences. Click Sonar, and you’ll see the option to adjust the severity of the markers.
11.5. Related plugins
If you don’t use Eclipse, and the makeshift integration available for other IDEs doesn’t suit you, the Issues Report plugin offers another alternative.
11.5.1. Issues Report
Although it offers a local analysis option, the Issues Report plugin is installed server-side. Once you’ve installed it and restarted SonarQube, you’re ready to run an analysis that won’t update the SonarQube database.
Similar to the functionality in Eclipse, you manually trigger an analysis that checks with the server to pull the current set of rules for your project and runs a local-only analysis. The Eclipse integration presents the analysis results in an Issues view; Issues Report generates an HTML-formatted file.
To take advantage of the plugin, each developer needs an analysis engine (see appendix B) such as SonarQube Runner installed locally. In this case, though, the installation is a rather shallow one—there’s no need to configure the SonarQube database location or credentials because you aren’t updating the database. Instead, you only configure the URL of the SonarQube host (SonarQube Runner interacts with the SonarQube web services to pull the data it needs for analysis) and make sure sonar-runner is in your PATH variable. Then you need to set up the project properties file.
Listing 11.1. sonar-project.properties

Once your properties file is in place, fire off an analysis. It won’t take as long to run as a full analysis, because it’s only an issues check. At the end of the console output, you’ll see something like this:
20:28:49.515 INFO  - HTML Issues Report generated: /path/to/issues-report.html

20:28:49.515 INFO  - -------------  Issues Report  -------------

20:28:49.515 INFO  - 3 new violations

20:28:49.515 INFO  - +3 major violations

20:28:49.515 INFO  - -------------------------------------------
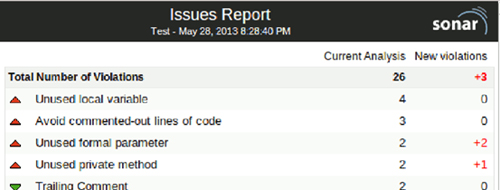
The resulting report starts with a project-level summary of new and existing issues, as shown in figure 11.11, and continues with a file-by-file breakdown.
Figure 11.11. The output from the Issues Report analysis is a single HTML file that shows at a project-level and file-by-file level which rules were violated and how many of the issues are new since the last full analysis.
11.6. Summary
IDE integration is a developer’s first line of defense against the embarrassment of adding new issues to a project, and SonarQube enables that for a wide variety of development environments.
If you don’t spend your days in Eclipse, your best bet is the Issues Report plugin, which offers a solid subset of the functionality available to Eclipse users. If you really want IDE integration, SonarQube offers the ability to import your rule set into your IDE for local scans, although as more and more of SonarQube’s language integrations go native, that ability will slowly diminish. In the meantime, you’ll need to remember to reimport your rules when the rule profile changes. But that’s better than being caught out in code review.
If you do work in Eclipse, then the offerings are far richer. With integration that’s rapidly approaching seamless, the SonarQube plugin for Eclipse brings code-quality remediation full circle. We showed you how to install the plugin, point it to your SonarQube server, and connect your local project to the copy on SonarQube. We walked through setting up an issue query to retrieve your assigned issues, and we showed you how to use an issue to jump right to the problem it describes.
Once you make your fixes, the plugin lets you prescan your code to make sure you haven’t inadvertently introduced any new issues before you check in your changes. Then you can mark the issue resolved without having to leave Eclipse.
In the next part of the book, we’ll dive into administration—users and groups, rules and profiles, and projects and SonarQube itself. You’ll learn to tune your rule sets to eliminate the rules that don’t fit your situation, add the ones that do, and adjust the remaining rules so their priorities line up with yours. You’ll see how to fine-tune your project settings and SonarQube itself. And you’ll learn how to set up project rights so you can delegate project administration to a team’s project or development lead, rather than handling it all yourself.