
6
MAKING SENSE OF A GHIDRA DISASSEMBLY

In this chapter, we cover important basic skills that will help you to better understand the Ghidra disassembly. We start with basic navigational techniques that allow you to move through the assembly and examine the artifacts you encounter. As you navigate from function to function, you will find that you need to decode each function’s prototype by using only clues available in the disassembly. Accordingly, we’ll discuss techniques for understanding how many parameters a function receives and how we might decode the data types of each parameter we encounter. Since much of the work that a function performs is associated with local variables maintained by the function, we’ll also discuss how functions use the stack for local variable storage and how you can, with Ghidra’s help, understand exactly how a function makes use of any stack space it may reserve for itself. Whether you find yourself debugging code, analyzing malware, or developing exploits, understanding how to decode a function’s stack-allocated variables is an essential skill for understanding the behavior of any program. Finally, we will look at the options Ghidra provides for searching and how that can contribute to understanding the disassembly.
Disassembly Navigation
In Chapters 4 and 5, we demonstrated that at a basic level, Ghidra combines the features of many common reverse engineering tools into its integrated CodeBrowser display. Navigating around the display is one of the essential skills required to master Ghidra. Static disassembly listings, such as those provided by tools like objdump, offer no inherent navigational capability other than scrolling up and down the listing. Even with the best text editors offering an integrated, grep-style search, such dead listings are very difficult to navigate. Ghidra, on the other hand, provides exceptional navigational features. In addition to offering fairly standard search features that you are accustomed to from your use of text editors or word processors, Ghidra develops and displays a comprehensive list of cross-references that behave like web page hyperlinks. The end result is that, in most cases, navigating to locations of interest requires nothing more than a double-click.
Names and Labels
When a program is disassembled, every location in the program is assigned a virtual address. As a result, we can navigate anywhere within a program by providing the virtual address of the location we are interested in visiting. Unfortunately for us, maintaining a catalog of addresses in our heads is not a trivial task. This fact motivated early programmers to assign symbolic names to program locations that they wished to reference, making things a whole lot easier on themselves. The assignment of symbolic names to program addresses was not unlike the assignment of mnemonic instruction names to program opcodes; programs became easier to read and write by making identifiers easier to remember. Ghidra continues this tradition by creating labels for virtual addresses and allowing the user to modify and expand the set of labels. We have already seen the use of names in relation to the Symbol Tree window. Recall that double-clicking a name caused the Listing view (and the Symbol References window) to jump to the referenced location. While there are usage differences between the terms name and label (for example, functions have names and appear in a separate branch of the Ghidra Symbol Tree from labels), in a navigational context the terms are largely interchangeable because both represent navigational targets.
Ghidra generates symbolic names during the auto analysis phase by using an existing name from the binary (if available) or by automatically generating a name based on how a location is referenced within the binary. In addition to its symbolic purpose, any label displayed in the disassembly window is a potential navigation target similar to a hyperlink on a web page. The two major differences between these labels and standard hyperlinks are that the labels are not highlighted in any way to indicate that they can be followed and that Ghidra generally requires a double-click to follow rather than the single-click required by a traditional hyperlink.
YOU ARE INVITED TO THE NAMING CONVENTION!
Ghidra provides the user lots of flexibility when assigning labels, but certain patterns have a special meaning and are reserved for Ghidra. These include the following prefixes when they are followed by an underscore and an address: EXT, FUN, SUB, LAB, DAT, OFF, and UNK. When you create a label, avoid these patterns. In addition, spaces and nonprintable characters are not allowed in labels. On the plus side, labels can be up to 2000 characters. Count carefully if you think you are in danger of exceeding that limit!
Navigation in Ghidra
In the listing shown in Figure 6-1, each of the symbols indicated by a solid arrow represents a named navigational target. Double-clicking any of them in the Listing window will cause Ghidra to relocate the Listing display (and all connected windows) to the selected location.
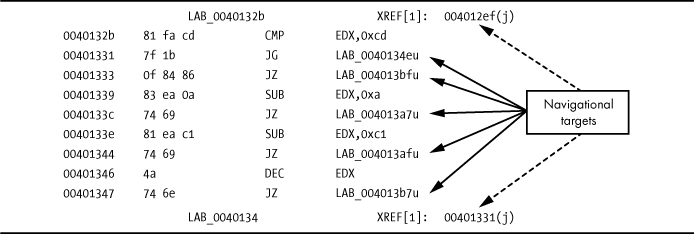
Figure 6-1: Listing showing navigational targets
For navigational purposes, Ghidra treats two additional display entities as navigational targets. First, cross-references (indicated by dashed arrows in Figure 6-1) are treated as navigational targets. Double-clicking the bottom cross-reference address will jump the display to the referencing location (00401331 in this case). Cross-references are covered in more detail in Chapter 9. Hovering over any of these navigable objects will display a pop-up that shows the destination code.
Second, the other type of display entity afforded special treatment in a navigational sense is one that uses hexadecimal values. If a displayed sequence of hexadecimal values represents a valid virtual address within the binary, then the associated virtual address will be displayed to the right, as shown in Figure 6-2. Double-clicking the displayed value will reposition the disassembly window to the associated virtual address. In Figure 6-2, double-clicking any of the values indicated by a solid arrow will jump the display, because each is a valid virtual address within this particular binary. Double-clicking any of the other values will have no effect.

Figure 6-2: Listing showing hexadecimal navigational targets
Go To
When you know the address or name you want to navigate to (for example, navigating to main in an ELF binary to begin your analysis), you could scroll through the listing to look for the address, scroll through the Functions folder in the Symbol Tree window to find the desired name, or use Ghidra’s search features (which are discussed later in this chapter). Ultimately, the easiest way to get to a known address or name is to use the Go To dialog (shown in Figure 6-3), accessed via Navigation ▸ Go To or by using the G hotkey while the disassembly window is active.

Figure 6-3: The Go To dialog
Navigating to any location in the binary is as simple as specifying a valid address (a case-sensitive symbol name or hex value) and clicking OK, which will immediately jump the display to the desired location. Values entered into the dialog are made available on subsequent use via a drop-down history list, which simplifies returning to previously requested locations.
Navigation History
As a final navigational feature, Ghidra supports forward and backward navigation based on the order in which you navigate the disassembly. Each time you navigate to a new location within a disassembly, your current location is appended to a history list. This list can be traversed from the Go To window or the left and right arrow icons in the CodeBrowser toolbar.
In the Go To window, shown in Figure 6-3, the arrow on the right side of the text box opens a picklist that allows you to choose from previous locations you have entered in the Go To dialog. The CodeBrowser toolbar buttons, seen near the top left in Figure 6-4, provide familiar browser-style forward and backward behavior. Each button is associated with a detailed drop-down history list that provides instant access to any location in the navigation history without having to retrace your steps through the entire list. A sample drop-down list associated with the back arrow is displayed in Figure 6-4.

Figure 6-4: Forward and backward navigation arrows with address list
ALT-left arrow (OPTION-left arrow on Mac), for backward navigation, is one of the most useful hotkeys you can commit to memory. Backward navigation is extremely handy when you have followed a chain of function calls several levels deep and you decide that you want to navigate back to your original position within the disassembly. ALT-right arrow (OPTION-right arrow on Mac) moves the disassembly window forward in the history list.
While we now have a much clearer picture regarding navigating a disassembly in Ghidra, we still have not attached meaning to the various destinations we have visited. The next section investigates what makes functions in general, and stack frames in particular, such important navigational targets for a reverse engineer.
Stack Frames
Because Ghidra is a low-level analysis tool, many of its features and displays expect the user to be somewhat familiar with the low-level details of compiled languages, which focus on the specifics of generating machine language and managing the memory used by a high-level program. Ghidra pays particular attention to the manner in which compilers handle local variable declarations and accesses. You may have noticed that a significant number of lines are dedicated to local variables at the beginning of most function listings. These lines result from detailed stack analysis that Ghidra performs on each function, using its Stack analyzer. This analysis is necessary because compilers place a function’s local variables (and in some circumstances, the function’s incoming arguments) in blocks of memory allocated on the stack. In this section, we review how compilers treat local variable and function arguments to help you better understand the details of Ghidra’s Listing view.
Function Call Mechanics
A function invocation may require memory for information passed into the function in the form of parameters (arguments) and for temporary storage space while executing the function. The parameter values, or their corresponding memory addresses, need to be stored somewhere the function can locate them. The temporary space is often allocated by a programmer through the declaration of local variables, which can be used within the function but cannot be accessed after the function has completed. Stack frames (also known as activation records) are blocks of memory allocated within a program’s runtime stack and dedicated to a specific invocation of a function.
Compilers use stack frames to make the allocation and deallocation of function parameters and local variables transparent to the programmer. For calling conventions that pass parameters on the stack, the compiler inserts code to place a function’s parameters into the stack frame prior to transferring control to the function itself, at which point the compiler inserts code to allocate enough memory to hold the function’s local variables. In some cases, the address to which the function should return is also stored within the new stack frame. Stack frames also enable recursion,1 as each recursive call to a function is given its own stack frame, neatly segregating each call from its predecessor.
The following operations take place when a function is called:
- The caller places any parameters required by the function being called into locations dictated by the calling convention employed by the called function. The program stack pointer may change if parameters are passed on the runtime stack.
- The caller transfers control to the function being called with an instruction such as the x86 CALL, ARM BL, or MIPS JAL. A return address is saved onto the program stack or in a processor register.
- If necessary, the called function configures a frame pointer and saves any register values that the caller expects to remain unchanged.2
- The called function allocates space for any local variables that it may require. This is often done by adjusting the program stack pointer to reserve space on the runtime stack.
- The called function performs its operations, potentially accessing the parameters passed to it and generating a result. If the function returns a result, it is often placed into a specific register or registers that the caller can examine after the function returns.
- When the function has completed its operations, any stack space reserved for local variables is released. This is often done by reversing the actions performed in step 4.
- Registers whose values were saved (in step 3) on behalf of the caller are restored to their original values.
- The called function returns control to the caller. Typical instructions for this include the x86 RET, ARM POP, and MIPS JR. Depending on the calling convention in use, this operation may also clear one or more parameters from the program stack.
- Once the caller regains control, it may need to remove parameters from the program stack by restoring the program stack pointer to the value that it held prior to step 1.
Steps 3 and 4 are so commonly performed upon entry to a function that together they are called the function’s prologue. Similarly, steps 6 through 8 make up the function’s epilogue. All of these operations, except step 5, are part of the overhead associated with calling a function, which may not be obvious in a program’s high-level source code, but is quite observable in assembly language.
ARE THEY REALLY GONE?
When we talk about “removing” items from the stack, as well as the removal of entire stack frames, we mean that the stack pointer is adjusted so it points to data lower on the stack and the removed content is no longer accessible through the POP operation. Until that content is overwritten by a PUSH operation, it is still there. From a programming perspective, that qualifies as removal. From a digital forensics perspective, you just have to look a little harder to find the contents. From a variable initialization standpoint, it means that any uninitialized local variables within a stack frame may contain stale values that remain in memory from the last use of a particular range of stack bytes.
Calling Conventions
When passing arguments from caller to callee, the calling function must store parameters exactly as the function being called expects to find them; otherwise, serious problems can arise. A calling convention dictates exactly where a caller should place any parameters that a function requires: in specific registers, on the program stack, or in both registers and on the stack. When parameters are passed on the program stack, the calling convention also determines who is responsible for removing them from the stack after the called function has completed: the caller or the callee.
Regardless of what architecture you are reversing for, understanding the code surrounding a function call will be difficult if you don’t understand the calling conventions in use. In the sections that follow, we review some of the common calling conventions encountered in compiled C and C++ code.
Stack and Register Arguments
Function arguments may be passed in processor registers, on the program stack, or in a combination of both. When arguments are placed on the stack, the caller performs a memory write (often a PUSH) to place the argument onto the stack, and the called function must then perform a memory read to access the argument. To speed up the function call process, some calling conventions pass arguments in processor registers. When an argument is passed in a register, there is no need to perform the memory write and read operations, as the argument is immediately available to the called function in a designated register. The one shortcoming with register-based calling conventions is that processors have a finite number of registers while function argument lists can be arbitrarily long, so the conventions must properly handle functions that require more arguments than available registers. Excess arguments that “spill” out of available registers are generally placed on the stack.
The C Calling Convention
The C calling convention is the default calling convention used by most C compilers when generating function calls. The keyword _cdecl may be used in a function’s prototype to force the use of this calling convention in C/C++ programs. The cdecl calling convention specifies that the caller place any stack-allocated parameters to a function on the stack in right-to-left order and that the caller (as opposed to the callee) remove the parameters from the stack after the called function completes. For 32-bit x86 binaries, cdecl passes all arguments on the program stack. For 64-bit x86 binaries, cdecl varies by operating system; on Linux, up to six arguments are placed in registers RDI, RSI, RDX, RCX, R8, and R9, in that order, and any additional arguments spill onto the stack. For ARM binaries, cdecl passes the first four arguments in registers R0 to R3, with arguments five and later spilling onto the stack.
When stack-allocated arguments are placed on the stack in right-to-left order, the leftmost argument will always be on the top of the stack when the function is called. This makes the first argument easy to locate regardless of the number of parameters the function expects, and it makes the cdecl calling convention ideally suited for use with functions that can take a variable number of arguments (such as printf).
Requiring the calling function to remove parameters from the stack means that you will often see instructions that make an adjustment to the program stack pointer immediately following the return from a called function. In the case of functions that can accept a variable number of arguments, the caller knows exactly how many arguments it passed to the function and can easily make the correct adjustment, whereas the called function does not know ahead of time how many parameters it will receive.
In the following examples, we consider calls to functions in a 32-bit, x86 binary, each using a different calling convention. The first function has the following prototype:
void demo_cdecl(int w, int x, int y, int z);
By default, this function will use the cdecl calling convention, expecting the four parameters to be pushed in right-to-left order and requiring the caller to clean the parameters off the stack. Given the following function call in C:
demo_cdecl(1, 2, 3, 4); // call to demo_cdecl (in C)
a compiler might generate the following code:
➊ PUSH 4 ; push parameter z
PUSH 3 ; push parameter y
PUSH 2 ; push parameter x
PUSH 1 ; push parameter w
CALL demo_cdecl ; call the function
➋ ADD ESP, 16 ; adjust ESP to its former value
The four PUSH operations ➊ change the program stack pointer (ESP) by 16 bytes (4 * sizeof(int) on a 32-bit architecture), which is undone immediately following the return from demo_cdecl ➋. The following technique, which has been used in some versions of the GNU compilers (gcc and g++), also adheres to the cdecl calling convention while eliminating the need for the caller to explicitly clean parameters off the stack following each call to demo_cdecl:
MOV [ESP+12], 4 ; move parameter z to fourth position on stack
MOV [ESP+8], 3 ; move parameter y to third position on stack
MOV [ESP+4], 2 ; move parameter x to second position on stack
MOV [ESP], 1 ; move parameter w to top of stack
CALL demo_cdecl ; call the function
In this example, when the parameters for demo_cdecl are placed on the stack, there is no change to the program stack pointer. Note that either method results in the stack pointer pointing to the leftmost stack argument when the function is called.
The Standard Calling Convention
In 32-bit Windows DLLs, Microsoft makes heavy use of a calling convention it has named the standard calling convention. In source code, this may be mandated by the use of the _stdcall modifier in a function declaration, as shown here:
void _stdcall demo_stdcall(int w, int x, int y);
To avoid any confusion surrounding the word standard, we refer to this calling convention as the stdcall calling convention for the remainder of the book.
The stdcall calling convention also requires that any stack-allocated function parameters be placed on the program stack in right-to-left order, but the called function is responsible for clearing any stack-allocated arguments from the stack when the function has finished. This is possible only for functions that accept a fixed number of parameters; variable argument functions such as printf cannot use the stdcall calling convention.
The demo_stdcall function expects three integer parameters, occupying a total of 12 bytes on the stack (3 * sizeof(int) on a 32-bit architecture). An x86 compiler can use a special form of the RET instruction to simultaneously pop the return address from the top of the stack and add to the stack pointer to clear the stack-allocated function arguments. In the case of demo_stdcall, we might see the following instruction used to return to the caller:
RET 12 ; return and clear 12 bytes from the stack
Using stdcall eliminates the need to clean parameters off the stack following every function call, which results in slightly smaller, slightly faster programs. By convention, Microsoft uses the stdcall convention for all fixed-argument functions exported from 32-bit shared library (DLL) files. This is an important point to remember if you are attempting to generate function prototypes or binary-compatible replacements for any shared library components.
The fastcall Convention for x86
The Microsoft C/C++ and GNU gcc/g++ (version 3.4 and later) compilers recognize the fastcall convention, a variation on the stdcall convention where the first two parameters are placed in the ECX and EDX registers, respectively. Any remaining parameters are placed on the stack in right-to-left order, and called functions are responsible for removing parameters from the stack when they return to their caller. The following declaration demonstrates the use of the fastcall modifier:
void fastcall demo_fastcall(int w, int x, int y, int z);
Given the following function call in C:
demo_fastcall(1, 2, 3, 4); // call to demo_fastcall (in C)
a compiler might generate the following code:
PUSH 4 ; move parameter z to second position on stack
PUSH 3 ; move parameter y to top position on stack
MOV EDX, 2 ; move parameter x to EDX
MOV ECX, 1 ; move parameter w to ECX
Call demo_fastcall ; call the function
No stack adjustment is required upon return from demo_fastcall, as demo_fastcall is responsible for clearing parameters y and z from the stack as it returns to the caller. It is important to understand that because two arguments are passed in registers, the called function needs to clear only 8 bytes from the stack even though there are four arguments to the function.
C++ Calling Conventions
Nonstatic member functions in C++ classes must make available a pointer to the object used to invoke the function (the this pointer).3 The address of the object used to invoke the function must be provided by the caller as a parameter, but the C++ language standard does not specify how this should be passed, so it should come as no surprise that different compilers use different techniques.
On x86, Microsoft’s C++ compiler utilizes the thiscall calling convention, which passes this in the ECX/RCX register and requires the non-static member function to clean parameters off the stack, as in stdcall. The GNU g++ compiler treats this as the implied first parameter to any nonstatic member function and behaves in all other respects as if the cdecl convention is being used. Thus, for g++-compiled 32-bit code, this is placed on top of the stack prior to calling the nonstatic member function, and the caller is responsible for removing parameters (there will always be at least one) from the stack after the function returns. Additional characteristics of compiled C++ programs are discussed in Chapters 8 and 20.
Other Calling Conventions
Complete coverage of every calling convention would require a book in its own right. Calling conventions are often operating system, language, compiler, and/or processor specific, and some research on your part may be required if you encounter code generated by less-common compilers. A few additional situations deserve special mention, however: optimized code, custom assembly language code, and system calls.
When functions are exported for use by other programmers (such as library functions), it is important that they adhere to well-known calling conventions so that programmers can easily interface to those functions. On the other hand, if a function is intended for internal program use only, then the calling convention used by that function need be known only within the program. In such cases, optimizing compilers may choose to use alternate calling conventions to generate faster code. For example, the use of the /GL option with Microsoft C/C++ instructs it to perform “whole program optimization,” which may result in optimized use of registers across function boundaries, and the use of the regparm keyword with GNU gcc/g++ allows the programmer to dictate that up to three arguments be passed to registers.
When programmers go to the trouble of writing in assembly language, they gain complete control over how parameters will be passed to any functions that they create. Unless they wish to make their functions available to other programmers, assembly language programmers are free to pass parameters in any way they see fit. As a result, take extra care when analyzing custom assembly code, like obfuscation routines and shellcode.
A system call is a special type of function call used to request an operating system service. System calls usually affect a state transition from user mode to kernel mode in order for the operating system kernel to service the user’s request. The manner in which system calls are initiated varies across operating systems and processors. For example, 32-bit Linux x86 system calls may be initiated using the INT 0x80 instruction or the sysenter instruction, while other x86 operating systems may use only the sysenter instruction or alternate interrupt numbers, and 64-bit x86 code uses the syscall instruction. On many x86 systems (Linux being an exception), parameters for system calls are placed on the runtime stack, and a system call number is placed in the EAX register immediately prior to initiating the system call. Linux system calls accept their parameters in specific registers and occasionally in memory when there are more parameters than available registers.
Additional Stack Frame Considerations
On any processor, registers are a finite resource that need to be shared, cooperativley, among all functions within a program. When a function (func1) is executing, its world view is that it has complete control over all processor registers. When func1 calls another function (func2), func2 may wish to adopt this same view and make use of all available processor registers according to its own needs, but if func2 makes arbitrary changes to the registers, it may destroy values that func1 depends on.
To address this problem, all compilers follow well-defined rules for register allocation and use. These rules are generally referred to as a platform’s application binary interface (ABI). An ABI divides registers into two categories: caller-saved and callee-saved. When one function calls another, the caller needs to save only registers in the caller-saved category to prevent values from being lost. Any registers in the callee-saved category must be saved by the called function (the callee) before that function is allowed to use any of those registers for its own purposes. This typically takes place as part of the function’s prologue sequence, with the caller’s saved values being restored within the function’s epilogue immediately prior to returning. Caller-saved registers are referred to as clobber registers because a called function is free to modify their contents without first saving any of them. Conversely, callee-saved registers are referred to as no-clobber registers.
The System V ABI for Intel 32-bit processors states that the caller-saved registers include EAX, ECX, and EDX, while the callee-saved registers include EBX, EDI, ESI, EBP, and ESP.4 In compiled code, you may notice that compilers often prefer to use caller-saved registers within a function because they are relieved from the responsibility of saving and restoring their contents on entry and exit from the function.
Local Variable Layout
Unlike the calling conventions that dictate how parameters are passed into a function, no conventions dictate the memory layout of a function’s local variables. When compiling a function, a compiler must compute the amount of space required by a function’s local variables, along with space required to save any no-clobber registers, and determine whether those variables can be allocated in processor registers or whether they must be allocated on the program stack. The exact manner in which these allocations are made is irrelevant to both the caller of a function and to any functions that may, in turn, be called, and it is not generally possible to determine a function’s local variable layout based solely on examination of the function’s source code. One thing is certain with regard to stack frames: the compiler must dedicate at least one register to remember the location of a function’s newly allocated stack frame. The most obvious choice for this register is the stack pointer, which, by definition, points at the stack and thus the current function’s stack frame.
Stack Frame Examples
When you perform any complex task, such as reverse engineering a binary, you should always strive to make efficient use of your time. When it comes to understanding the behavior of a disassembled function, the less time you spend examining common code sequences, the more time you will have to spend on difficult sequences. Function prologues and epilogues are excellent examples of common code sequences, and it is important that you’re able to recognize them, understand them, and rapidly move on to more interesting code that requires more thought.
Ghidra summarizes its understanding of function prologues in the local variable list at the head of each function listing, and while it may make the code more readable, it does nothing to reduce the amount of disassembled code that you need to read. In the following examples, we discuss two common types of stack frames and review the code necessary to create them so that when you encounter similar code in the wild, you can quickly move through it to get to the meat of a function.
Consider the following function compiled on a 32-bit x86-based computer:
void helper(int j, int k); // a function prototype
void demo_stackframe(int a, int b, int c) {
int x;
char buffer[64];
int y;
int z;
// body of function not terribly relevant
// other than the following function call
helper(z, y);
}
The local variables for demo_stackframe require 76 bytes (three 4-byte integers and a 64-byte buffer). This function could use either stdcall or cdecl, and the stack frame would look the same.
Example 1: Local Variable Access via the Stack Pointer
Figure 6-5 shows one possible stack frame for an invocation of demo_stackframe. In this example, the compiler has elected to utilize the stack pointer anytime it references a variable contained in the stack frame, leaving all other registers available for other purposes. If any instruction causes the value of the stack pointer to change, the compiler must ensure that it accounts for that change in all subsequent local variable accesses.
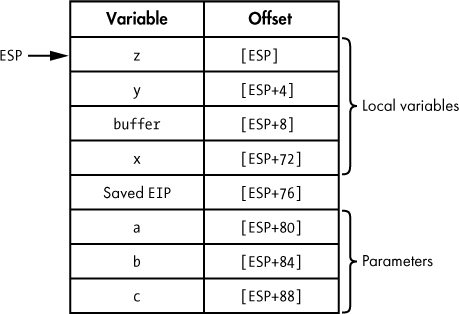
Figure 6-5: Sample stack frame for a function compiled on a 32-bit x86 computer
The space for this frame is set up on entry to demo_stackframe with the one-line prologue:
SUB ESP, 76 ; allocate sufficient space for all local variables
The Offset column in Figure 6-5 indicates the x86 addressing mode (base + displacement in this case) required to reference each of the local variables and parameters in the stack frame. In this case, ESP is being used as the base register, and each displacement is the relative offset from ESP to the start of the variable within the stack frame. However, the displacements shown in Figure 6-5 are correct only as long as the value held in ESP doesn’t change. Unfortunately, the stack pointer changes frequently, and the compiler must constantly adapt to ensure that proper offsets are used when referencing any variables within the stack frame. Consider the call made to helper in the function demo_stackframe, the code for which is shown here:
➊ PUSH dword [ESP+4] ; push y
➋ PUSH dword [ESP+4] ; push z
CALL helper
ADD ESP, 8 ; cdecl requires caller to clear parameters
The first PUSH ➊ correctly pushes local variable y per the offset in Figure 6-5. At first glance, it might appear that the second PUSH ➋ incorrectly references local variable y a second time. However, because all variables in the stack frame are referenced relative to ESP and the first PUSH ➊ modifies ESP, all of the offsets in Figure 6-5 must be temporarily adjusted. Therefore, following the first PUSH ➊, the new offset for local variable z becomes [ESP+4]. When examining functions that reference stack frame variables using the stack pointer, you must be careful to note any changes to the stack pointer and adjust all future variable offsets accordingly.
Once demo_stackframe has completed, it needs to return to the caller. Ultimately, a RET instruction will pop the desired return address off the top of the stack into the instruction pointer register (EIP in this case). Before the return address can be popped, the local variables need to be removed from the top of the stack so that the stack pointer correctly points to the saved return address when the RET instruction is executed. For this particular function (assuming the cdecl calling convention is in use), the epilogue becomes the following:
ADD ESP, 76 ; adjust ESP to point to the saved return address
RET ; return to the caller
Example 2: Give the Stack Pointer a Break
At the expense of dedicating a second register to locating variables with a stack frame, the stack pointer may be allowed to freely change without the need to recompute offsets for each variable within the frame. Of course, the compiler needs to commit to not changing this second register; otherwise, it will need to contend with the same issues raised in the previous example. In this situation, the compiler needs to first select a register for this purpose and then it must generate code to initialize that register on entry to the function.
Any register selected for this purpose is known as a frame pointer. In the preceding example, ESP was being used as a frame pointer, and we can say that it was an ESP-based stack frame. The ABI for most architectures suggests which register should be used as a frame pointer. The frame pointer is always considered a no-clobber register because the calling function may already be using it for the same purpose. In x86 programs, the EBP/RBP (extended base pointer) register is typically dedicated for use as a frame pointer. By default, most compilers generate code to use a register other than the stack pointer as a frame pointer, though options typically exist for specifying that the stack pointer should be used instead. (GNU gcc/g++, for example, offers the -fomit-frame-pointer compiler option, which generates functions that do not use a second register as a frame pointer.)
To see what the stack frame for demo_stackframe will look like using a dedicated frame pointer, we need to consider this new prologue code:
➊ PUSH EBP ; save the caller's EBP value, because it's no-clobber
➋ MOV EBP, ESP ; make EBP point to the saved register value
➌ SUB ESP, 76 ; allocate space for local variables
The PUSH instruction ➊ saves the value of EBP currently being used by the caller because EBP is a no-clobber register. The caller’s value of EBP must be restored before we return. If any other registers need to be saved on behalf of the caller (ESI or EDI, for example), compilers may save them at the same time EBP is saved, or they may defer saving them until local variables have been allocated. Thus, there is no standard location within a stack frame for the storage of saved registers.
Once EBP has been saved, it can be changed to point to the current stack location with the MOV instruction ➋, which copies the current value of the stack pointer (the only register guaranteed to be pointing into the stack at this moment in time) into EBP. Finally, as in the ESP-based stack frame, space for local variables is allocated ➌. The resulting stack frame layout is shown in Figure 6-6.
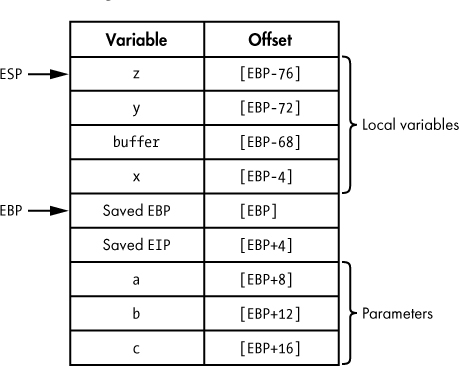
Figure 6-6: An EBP-based stack frame
With a dedicated frame pointer, all variable offsets can now be computed relative to the frame pointer register, as seen in Figure 6-6. It is most often (though not necessarily) the case that positive offsets are used to access any stack-allocated function arguments, while negative offsets are used to access local variables. With a dedicated frame pointer in use, the stack pointer may be freely changed without affecting the offset to any variables within the frame. The call to the function helper can now be implemented as follows:
➍ PUSH dword [ebp-72] ; PUSH y
PUSH dword [ebp-76] ; PUSH z
CALL helper
ADD ESP, 8 ; cdecl requires caller to clear parameters
The fact that the stack pointer has changed following the first PUSH ➍ has no effect on the access to local variable z in the subsequent PUSH.
In the epilogue of a function that uses a frame pointer, the caller’s frame pointer must be restored prior to returning. If the frame pointer is to be restored using a POP instruction, local variables must be cleared from the stack before the old value of the frame pointer can be popped, but this is made easy by the fact that the current frame pointer points to the location on the stack that holds the saved frame pointer value. In 32-bit x86 programs utilizing EBP as a frame pointer, the following code represents a typical epilogue:
MOV ESP, EBP ; clears local variables by resetting ESP
POP EBP ; restore the caller's value of EBP
RET ; pop return address to return to the caller
This operation is so common that the x86 architecture offers the LEAVE instruction to accomplish the same task:
LEAVE ; copies EBP to ESP AND then pops into EBP
RET ; pop return address to return to the caller
While the names of registers and instructions used will certainly differ for other processor architectures, the basic process of building stack frames will remain the same. Regardless of the architecture, you will want to familiarize yourself with typical prologue and epilogue sequences so that you can quickly move on to analyzing more interesting code within functions.
Ghidra Stack Views
Stack frames are a runtime concept; a stack frame can’t exist without a stack and without a running program. While this is true, it doesn’t mean that you should ignore the concept of a stack frame when you are performing static analysis with tools such as Ghidra. All of the code required to set up stack frames for each function is present within a binary. Through careful analysis of this code, we can gain a detailed understanding of the structure of any function’s stack frame, even though the function is not running. In fact, some of Ghidra’s most sophisticated analysis is performed specifically to determine the layout of stack frames for every function that it disassembles.
Ghidra Stack Frame Analysis
During initial analysis, Ghidra goes to great lengths to track the behavior of the stack pointer over the course of a function by making note of every PUSH or POP operation along with any arithmetic operations that may change the stack pointer, such as adding or subtracting constant values. The goal of this analysis is to determine the exact size of the local variable area allocated to a function’s stack frame, determine whether a dedicated frame pointer is in use in a given function (by recognizing a PUSH EBP/MOV EBP, ESP sequence, for example), and recognize all memory references to variables within a function’s stack frame.
For example, if Ghidra noted the instruction
MOV EAX, [EBP+8]
in the body of demo_stackframe, it would understand that the first argument to the function (a in this case) is being loaded into the EAX register (refer to Figure 6-6). Ghidra can distinguish between memory references that access function arguments (those that lie below the saved return address) and references that access local variables (those that lie above the saved return address).
Ghidra takes the additional step of determining which memory locations within a stack frame are directly referenced. For example, while the stack frame in Figure 6-6 is 96 bytes in size, there are only seven variables that we are likely to see referenced (four locals and three parameters). As a result, you can focus your attention on the seven things that Ghidra has identified as important and spend less time thinking about all the bytes that Ghidra has left unnamed. In the process of identifying and naming individual items within a stack frame, Ghidra also recognizes the spatial relationship of variables with respect to one another. This can be tremendously helpful in some use cases, such as exploit development, when Ghidra makes it easy to determine exactly which variables may get overwritten as the result of a buffer overflow. Ghidra’s decompiler (discussed in Chapter 19) also relies heavily on stack frame analysis, and it uses the results to infer how many arguments a function receives and what local variable declarations are necessary in the decompiled code.
Stack Frames in Listing View
Understanding the behavior of a function often comes down to understanding the types of data that the function manipulates. When you’re reading a disassembly listing, one of the first opportunities you have to understand the data that a function manipulates is to view the breakdown of the function’s stack frame. Ghidra offers two views into any function’s stack frame: a summary view and a detailed view. To understand these two views, we will refer to the following version of demo_stackframe, which we have compiled using gcc:
void demo_stackframe(int i, int j, int k) {
int x = k;
char buffer[64];
int y = j;
int z = 10;
buffer[0] = 'A';
helper(z, y);
}
As local variables exist only while the function is running, any local variable that is not used in the function in a meaningful way is essentially useless. From a high-level view, the following code is a functionally equivalent (you might say optimized) version of demo_stackframe:
void demo_stackframe_2(int b) {
helper(10, b);
}
(So, while this function acts like it is doing a lot of work, it’s really just trying to look busy to impress the boss.)
In the original version of demo_stackframe, local variables x and y are initialized from parameters k and j, respectively. Local variable z is initialized with the literal value 10, and the first character in the 64-byte local array, named buffer, is initialized to the character 'A'. The corresponding Ghidra disassembly of this function, using the default auto analysis, is shown in Figure 6-7.

Figure 6-7: Disassembly of the demo_stackframe function
There are many points to cover in this listing as we begin to acquaint ourselves with Ghidra’s disassembly notation. In this discussion, we focus on two sections of the disassembly that provide us with particularly useful information. Let’s start by zooming in on the stack summary, as shown in the following listing. (You can always refer back to Figure 6-7 to see this summary stack frame in context.) To simplify the discussion, the terms local variable and argument are used to distinguish between the two types of variables. The term variable is used when discussing both collectively.
undefined AL:1 <RETURN>
undefined Stack[0x4]:1 param_1
undefined4 Stack[0x8]:4 param_2
undefined4 Stack[0xc]:4 param_3
undefined4 Stack[-0x10]:4 local_10
undefined4 Stack[-0x14]:4 local_14
undefined4 Stack[-0x18]:4 local_18
undefined1 Stack[-0x58]:1 local_58
Ghidra provides a summary stack view that lists every variable directly referenced within the stack frame, along with important information about each. The meaningful names (in the third column) that Ghidra assigns to each variable provide information about the variables when you see them throughout the disassembly listing: the names of arguments passed to the function begin with a helpful prefix of param_, and local variable names begin with local_. As a result, it is easy to distinguish between the two types of variables.
The variable name prefixes are combined with information about the position or location of a variable. For arguments, like param_3, the number in the name corresponds to the argument’s position in the function’s parameter list. For local variables, like local_10, the number is a hexadecimal offset representing the variable’s location within the stack frame. The location can also be found in the center column of the listing, to the left of the names. This column has two components separated by a colon: Ghidra’s estimate of the size of the variable in bytes, and the location of the variable within the stack frame, represented as the offset of that variable from the initial stack pointer value on entry into the function.
A tabular representation of this stack frame is shown in Figure 6-8. As discussed, parameters lie below the saved return address and thus have a positive offset from the return address. Local variables lie above the saved return address and thus have a negative offset. The order of the local variables in the stack do not match the order in which they were declared in the source code shown earlier in this chapter, because the compiler is free to arrange local variables on the stack based on a variety of internal factors, such as byte alignment and placement of arrays relative to other local variables.
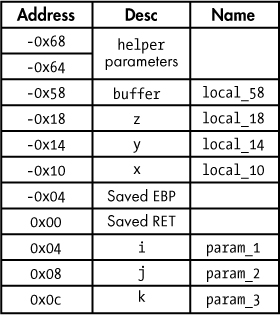
Figure 6-8: Sample stack frame image
Decompiler-Assisted Stack Frame Analysis
Remember the functional equivalent of the code that we identified?
void demo_stackframe_2(int j) {
helper(10, j);
}
The code that the decompiler generated for this function is shown in Figure 6-9. Ghidra’s decompiler-generated code is very similar to our optimized code, as the decompiler includes only the executable equivalent of the original function. (The exception is the inclusion of param_1.)
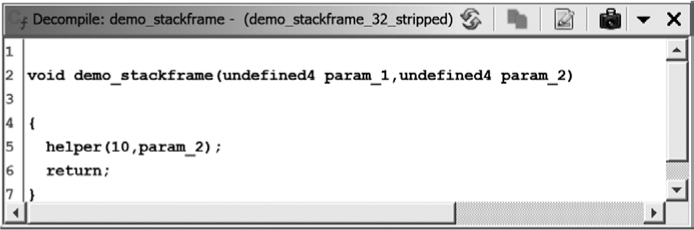
Figure 6-9: Decompiler window for demo_stackframe (with Decompiler Parameter ID analyzer)
You may have noticed that the function demo_stackframe accepted three integer parameters, but only two of them (param_1 and param_2) are accounted for in the decompiler listing. Which one is missing and why? It turns out that the Ghidra disassembler and the Ghidra decompiler approach the names a little differently. While both name all of the parameters up to the last one referenced, the decompiler names only the parameters up to the last one that is used in a meaningful way. One of the analyzers that Ghidra can run for you is called the Decompiler Parameter ID analyzer. In most cases, this analyzer is not enabled by default (it is enabled for only Windows PE files smaller than 2MB). When the Decompiler Parameter ID analyzer is enabled, Ghidra uses decompiler-derived parameter information to name a function’s parameters in the disassembly listing. The following listing shows the variables in the disassembly listing of demo_stackframe when the Decompiler Parameter ID analyzer is enabled:
undefined AL:1 <RETURN>
undefined Stack[0x4]:4 param_1
undefined4 Stack[0x8]:4 param_2
undefined4 Stack[-0x10]:4 local_10
undefined4 Stack[-0x14]:4 local_14
undefined4 Stack[-0x18]:4 local_18
undefined1 Stack[-0x58]:1 local_58
Note that param_3 no longer appears in the list of function arguments, as the decompiler has determined that it is not used in any meaningful way within the function. This particular stack frame is discussed further in Chapter 8. If you ever want Ghidra to perform Decompiler Parameter ID analysis after opening a binary with that analyzer disabled, you can always choose Analysis ▸ One Shot ▸ Decompiler Parameter ID to run the analyzer after the fact.
Local Variables as Operands
Let’s shift our focus to the actual disassembly portion of the following listing:
08048473 55 PUSH EBP➊
08048474 89 e5 MOV EBP,ESP
08048476 83 ec 58 SUB ESP,0x58➋
08048479 8b 45 10 MOV EAX,dword ptr [EBP + param_3]
0804847c 89 45 f4 MOV dword ptr [EBP + local_10],EAX➌
0804847f 8b 45 0c MOV EAX,dword ptr [EBP + param_2]
08048482 89 45 f0 MOV dword ptr [EBP + local_14],EAX➍
08048485 c7 45 ec MOV dword ptr [EBP + local_18],0xa➎
0a 00 00 00
0804848c c6 45 ac 41 MOV byte ptr [EBP + local_58],0x41➏
08048490 83 ec 08 SUB ESP,0x8
08048493 ff 75 f0 PUSH dword ptr [EBP + local_14]➐
08048496 ff 75 ec PUSH dword ptr [EBP + local_18]
The function uses a common function prologue ➊ for an EBP-based stack frame. The compiler allocates 88 bytes (0x58 equals 88) of local variable space ➋ in the stack frame. This is slightly more than the estimated 76 bytes and demonstrates that compilers occasionally pad the local variable space with extra bytes in order to maintain a particular memory alignment within the stack frame.
An important difference between Ghidra’s disassembly listing and the stack frame analysis that we performed earlier is that in the disassembly listing you don’t see memory references similar to [EBP-12] (which you might see with objdump, for example). Instead, Ghidra has replaced all constant offsets with symbolic names corresponding to the symbols in the stack view and their relative offsets from the function’s initial stack pointer location. This is in keeping with Ghidra’s goal of generating a higher-level disassembly. It is simply easier to deal with symbolic names than numeric constants. It also gives us a name that can be modified to match our understanding of the variable’s purpose once known. Ghidra does display the raw form of the current instruction, without any labels, in the extreme, lower-right corner of the CodeBrowser window for reference.
In this example, since we have source code available for comparison, we can map the Ghidra-generated variable names back to the names used in the original source by using a variety of clues available in the disassembly:
- First, demo_stackframe accepts three parameters, i, j, and k, which correspond to variables param_1, param _2, and param _3, respectively.
- Local variable x (local_10) is initialized from parameter k (param_3) ➌.
- Similarly, local variable y (local_14) is initialized from parameter j (param _2) ➍.
- Local variable z (local_18) is initialized with the value 10 ➎.
- The first character buffer[0] (local_58) in the 64-byte character array is initialized with A (ASCII 0x41) ➏.
- The two arguments for the call to helper are pushed onto the stack ➐. The 8-byte stack adjustment that precedes these two pushes combines with the two pushes to yield a net stack change of 16 bytes. As a result, the stack maintains any 16-byte alignment achieved earlier in the program.
The Ghidra Stack Frame Editor
In addition to the summary stack view, Ghidra offers a detailed stack frame editor in which every byte allocated to a stack frame is accounted for. The Stack Frame Editor window is accessed by right-clicking and selecting Function ▸ Edit Stack Frame from the context menu when you have selected a function or stack variable within Ghidra’s summary stack view for a function. The resulting window for the demo_stackframe function is shown in Figure 6-10.
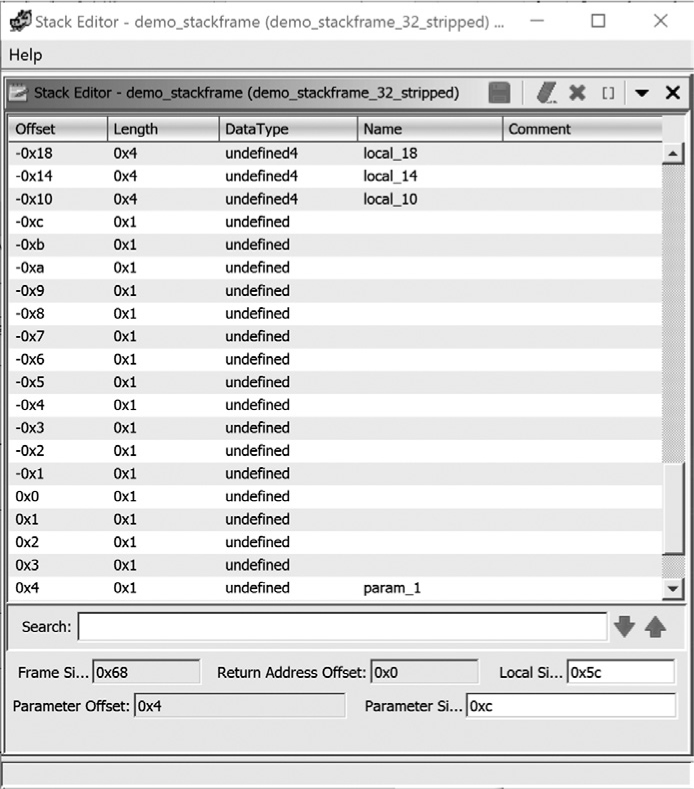
Figure 6-10: Sample summary stack view
Because the detailed view accounts for every byte in the stack frame, it occupies significantly more space than the summary view. The portion of the stack frame shown in Figure 6-10 spans a total of 29 bytes, which is only a small portion of the entire stack frame. Also in the previous listing, local_10 ➌, local_14 ➍, and local_18 ➎ are directly referenced in the disassembly listing where their contents were initialized using dword (4-byte) writes. Based on the fact that 32 bits of data were moved, Ghidra is able to infer that each of these variables is a 4-byte quantity and labels each as an undefined4 (a 4-byte variable of unknown type).
As this is a Stack Frame Editor, we can use this window to edit fields, change display formats, and add supplemental information if it benefits our process. For example, we could add a name for the saved return address at 0x0.
REGISTER-BASED PARAMETERS
ARM calling conventions use up to four registers to pass parameters to functions without using the stack. Some x86-64 conventions use as many as six registers, and some MIPS conventions use up to eight. Register-based parameters are a little harder to identify than stack-based parameters.
Consider the following two assembly language fragments:
stackargs: ; An example x86 32-bit function
PUSH EBP ; save no-clobber ebp
MOV EBP, ESP ; set up frame pointer
➊ MOV EAX, [EBP + 8] ; retrieve stack-allocated argument
MOV CL, byte [EAX] ; dereference retrieved pointer argument
...
RET
regargs: ; An example x86-64 function
PUSH RBP ; save no-clobber rbp
MOV RBP, RSP ; set up frame pointer
➋ MOV CL, byte [RDI] ; dereference pointer argument
...
RET
In the first function, the region of the stack beneath the saved return address is being accessed ➊, and we conclude that the function expects at least one argument. Ghidra, like most high-end disassemblers, performs stack pointer and frame pointer analysis to identify instructions that access members of a function’s stack frame.
In the second function, RDI is used ➋ before it has been initialized. The only logical conclusion is that RDI must have been initialized in the caller, in which case RDI is being used to pass information from the caller into the regargs function (that is, it is a parameter). In program analysis terms, RDI is live on entry to regargs. To determine the number of register-based parameters the function expects, identify all registers that appear to be live within a function by observing that their contents are read and utilized before the register has been written (initialized) within a function.
Unfortunately, this data flow analysis is usually beyond the capabilities of most disassemblers, including Ghidra. Decompilers, on the other hand, must perform this type of analysis and are generally quite good at identifying the use of register-based parameters. Ghidra’s Decompiler Parameter ID analyzer (Edit ▸ Options for <prog> ▸ Properties ▸ Analyzers) can update the disassembly listing based on parameter analysis performed by the decompiler.
The stack editor view offers a detailed look at the inner workings of compilers. In Figure 6-10, it is clear that the compiler has inserted 8 extra bytes between the saved frame pointer -0x4 and the local variable x (local_10). These bytes occupy offsets -0x5 through -0xc in the stack frame. Unless you happen to be a compiler writer yourself or are willing to dig deep into the source code for GNU gcc, all you can do is speculate as to why these extra bytes are allocated in this manner. In most cases, we can chalk up the extra bytes to padding for alignment, and usually the presence of these extra bytes has no impact on a program’s behavior. In Chapter 8, we return to the stack editor view and its uses in dealing with more complex data types such as arrays and structures.
Searching
As shown at the start of the chapter, Ghidra makes it easy to navigate through the disassembly to locate artifacts that you know about and to discover new artifacts. It also designs many of its data displays to summarize specific types of information (names, strings, imports, and so on), making them easy to find as well. However, effective analysis of a disassembly listing often requires the ability to search for new clues to inform the disassembly analysis. Fortunately for us, Ghidra has a Search menu that allows us to conduct searches to locate items of interest. The default search menu options are shown in Figure 6-11. In this section, we investigate methods to search the disassembly by using both text and byte search functionality provided in the CodeBrowser.
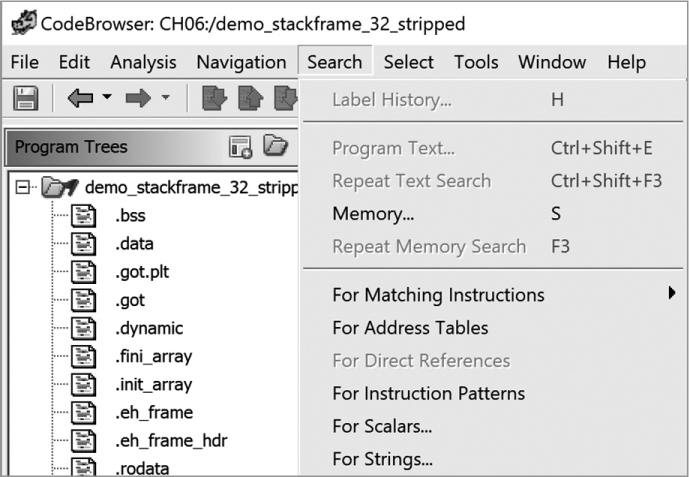
Figure 6-11: Ghidra Search menu options
Search Program Text
Ghidra text searches amount to substring searches through the disassembly listing view. Text searches are initiated via Search ▸ Program Text, which opens the dialog shown in Figure 6-12. Two search types are available: the entire program database, which extends beyond what you see in the CodeBrowser window, and the listing display within the CodeBrowser. Beyond the search type, several self-explanatory options let you select how and what to search.
To navigate between matches, use the Next and Previous buttons at the bottom of the Search Program Text dialog, or select Search All to open the search results in a new window, allowing easy navigation to any match.
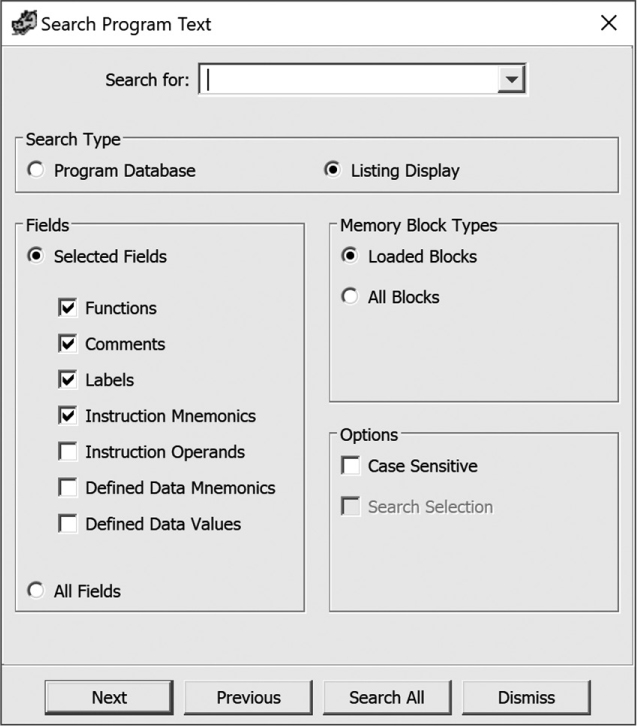
Figure 6-12: Search Program Text dialog
I DUB THEE . . .
Search windows are one of the window types within Ghidra that you can rename at will, which will help you keep track of search windows as you experiment. To rename a window, just right-click the title bar and provide a name that is meaningful to you. A handy trick is to include the search string along with a mnemonic to help you remember the settings you have chosen.
Search Memory
If you need to search for specific binary content, such as a known sequence of bytes, then text searches are not the answer. Instead, you need to use Ghidra’s memory search functionality. A memory search can be initiated using Search ▸ Memory, or the associated hotkey S. Figure 6-13 shows the Search Memory dialog. To search for a sequence of hex bytes, the search string should be specified as a space-separated list of two-digit, case-insensitive hex values, such as c9 c3, as shown in Figure 6-13. If you are not sure of the hex sequence, you can use wildcards (* or ?).
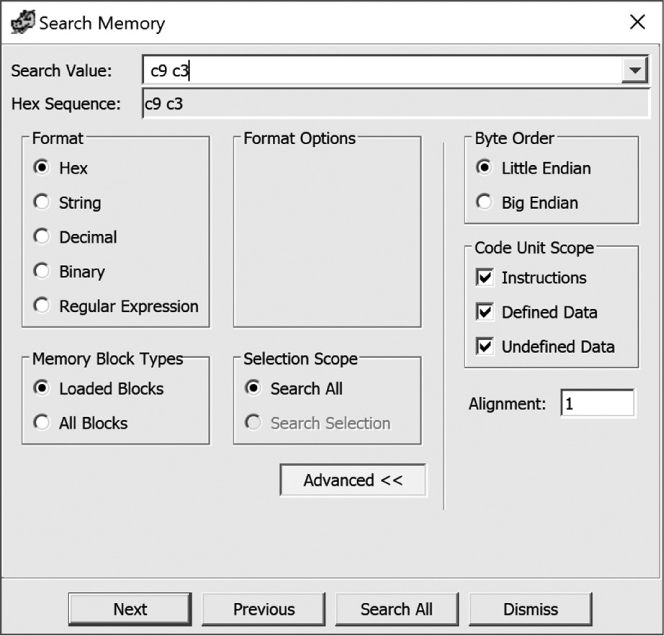
Figure 6-13: Search Memory dialog
The Search Memory results for the bytes c9 c3, run with the Search All option, are shown in Figure 6-14. You can sort on any column, rename the window, or apply a filter. This window also offers some right-click options, including the ability to delete rows and manipulate selections.

Figure 6-14: Search Memory results
Search values can be input in string, decimal, binary, and regular expression formats as well. String, decimal, and binary each provide context-appropriate format options. Regular expressions let you search for a particular pattern, but only in the forward direction, because of restrictions on how they are processed. Ghidra uses Java’s built-in regular expressions grammar, which is described in significant detail in Ghidra Help.
Summary
The intent of this chapter was to provide you with the minimum essential skills for effectively interpreting Ghidra’s disassembly listings and navigating your way around them. The overwhelming majority of your interactions with Ghidra will involve the operations that we have discussed so far. However, the ability to perform basic navigation, understand important disassembly constructs like the stack, and search the disassembly are just the tip of the iceberg for a reverse engineer.
With these skills safely under your belt, the logical next step is learning how to use Ghidra to suit your particular needs. In the next chapter, we begin to look at how to make the most basic changes to a disassembly listing as a means of adding new knowledge based on our understanding of a binary’s content and behavior.