
12
CUSTOMIZING GHIDRA

After spending time with Ghidra, you may prefer some settings that you wish to use as defaults every time you open a new project or that you want to apply to all files within a particular project. At this point, you may be confused as to why some of the options you have changed carry over from session to session, while other options need resetting every time you load a new project or file. In this chapter, we examine the ways in which you can customize Ghidra’s default appearance and behavior to better serve your reverse engineering needs.
To understand the scope of some customizations, it’s useful to understand the (fuzzy) distinction between the terms plugin and tool. In a general sense, the following is true:
Plugin A plugin is a software component (for example, Byte Viewer, Listing window, and so on) that adds functionality to Ghidra. Plugins frequently present themselves as windows, but many plugins do their work behind the scenes (for example, analyzers).
Tool A tool can be a single plugin or a set of plugins that work together. They generally present as a useful graphical user interface (GUI) to help users accomplish tasks. A tool that we have been working with extensively, CodeBrowser, is a window that serves as a GUI framework. Function Graph is also a tool.
Don’t panic if these definitions are not strictly adhered to. In many cases, distinguishing between the two simply doesn’t matter. For example, some menus, such as the Tool Options menu discussed later in this chapter, include options that can be applied to both tools and plugins despite using the term Tool. In that context, as well as many others, the distinction is not important, as both are treated the same. You should be able to successfully navigate the customization process even when the usage of the terms varies.
In addition to Ghidra customizations, we’ll also discuss Ghidra workspaces to round out the chapter. Workspaces couple a tool with a configuration and provide the capability to design and use a personalized virtual desktop.
CodeBrowser
In Chapters 4 and 5, we introduced the CodeBrowser and many of its associated windows. We already covered some of the basic customization options; now we will walk through a more thorough example of customizations in the CodeBrowser before moving on to the Ghidra Project window and workspaces.
Rearranging Windows
The following six basic operations allow you to control where the individual windows appear in relation to the CodeBrowser window:
Open Windows are generally opened using the CodeBrowser’s Window menu. Each window has defaults that determine where it opens.
Close Windows can be closed by clicking the X in the upper right of the window. (If you reopen a closed window, it will reappear at the same location rather than its original default location.)
Move Move windows around by dragging and dropping them.
Stack Use the drag-and-drop functionality to stack and unstack windows.
Resize Hovering on a border between two windows reveals an arrow that allows to you grow and shrink the windows adjacent to the border.
Undock You can undock a tool from the CodeBrowser window, but redocking is not as straightforward as you might wish, as shown in Figure 12-1.

Figure 12-1: Redocking the Decompiler window
To redock a window, you can’t click the title bar ➊, as you’ll just drag the window around in front of the CodeBrowser. Instead, click the internal title bar ➋ to redock or stack a window. Now that we can rearrange windows, let’s customize the windows themselves by using the Edit ▸ Tool Options menu.
Editing Tool Options
When you choose Edit ▸ Tool Options, a CodeBrowser option window opens, as shown in Figure 12-2. This window allows you to control options associated with individual CodeBrowser components.
Available options are determined by the developers of each component, and the significant variability between available options reflects the specific nature of the individual tools. Because describing every available tool option would take up an entire book, we’ll look at a few edits that affect tools we have discussed in previous chapters and some that are similar for many tools.
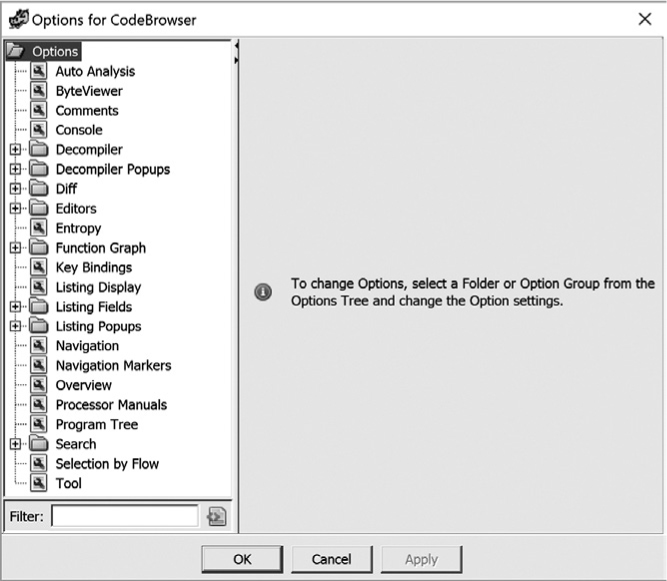
Figure 12-2: Default CodeBrowser Edit ▸ Tool Options window
While it may not be apparent when rendered in grayscale, many of the tools use color to identify attributes, and the associated color palette is configurable. Clicking a default color within the Options window opens a standard Color Editor dialog, as shown in the Byte Viewer options panels in Figure 12-3. This provides you with the option to control the color of a plethora of items within your CodeBrowser.

Figure 12-3: Edit ▸ Tool Options Color Editor dialog
In Figure 12-3, you can select colors for six items in the Byte Viewer window: Block Separator, Current View Cursor, Cursor, Edit Cursor, Highlight Cursor Line, and Non-Focus Cursor. In addition to customizing color in the Byte Viewer window, you can also select the font and choose to highlight the cursor line. Conveniently, any CodeBrowser tool’s option panel includes a Restore Defaults option in the lower right. This enables you to use special color schemes during some analysis steps and then revert to the default color scheme for the tool when done.
Beyond cosmetic changes, many tools provide the ability to set parameters in the edit options. We have hinted at this potential as we introduced new functionality in previous chapters, such as the ability to control which analyzers are included in auto analysis. In general, anytime something has a default, there is a way to change it to something else.
The settings for some overarching tools are also accessible and modifiable through the Options window. For example, key bindings are used to specify mappings between Ghidra actions and hotkey sequences, and there are over 550 actions in the default CodeBrowser window for which you can create or reassign a hotkey binding using the Options window. Hotkey reassignment is useful in many instances, including making additional commands available via hotkeys, changing default sequences to sequences that are easier to remember, and changing sequences that might conflict with others in use by the operating system or your terminal application. You might even remap all hotkeys to match those of other disassemblers.
Three fields are associated with each key binding, as shown in Figure 12-4. The first field is Action Name. In some cases, the action name corresponds to a menu command (for example, Analysis ▸ Auto Analyze). In other cases, it is a parameter associated with a menu command (for example, Aggressive Instruction Finder within Analysis Options).
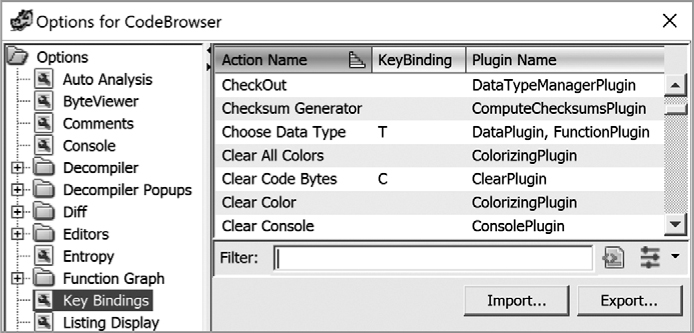
Figure 12-4: Edit ▸ Tool Options Key Bindings option
The second column is the actual key binding (hotkey) that is associated with the action. The final column holds the name of the plugin in which the action is implemented.1 Not all actions have associated hotkeys, but you can easily assign hotkeys by selecting an action and entering the desired hotkey in the text box. A list of all other uses of that hotkey is displayed if the hotkey has already been associated with another action. When you use a hotkey that has multiple key bindings, you will be provided a list of potential actions and will need to choose the appropriate one.
Editing the Tool
At the bottom of the Edit ▸ Tool Options window is an option called Tool. The meaning of Tool changes depending on the tool whose menu was used to reach the Options dialog. Generally this will be either the CodeBrowser or the Project window. Figure 12-5 shows the default configuration options for the CodeBrowser tool. The title bar of the Options dialog provides the most prominent clue that we are looking at the options page for the CodeBrowser.
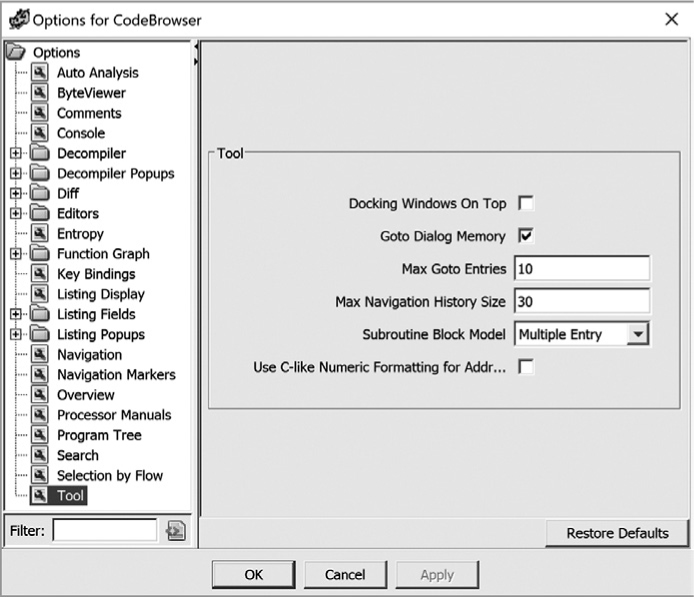
Figure 12-5: Using Edit ▸ Tool Options ▸ Tool to edit CodeBrowser options
Special Tool Editing Features
Some tools have editing features integrated within their individual windows so that you can immediately see the effect of the options on the associated contents. The most extensive set of built-in editing features is available in the Listing window. The Listing window contains the textual contents of the disassembly and is highly configurable using the Browser Field Formatter introduced in “Changing Code Display Options” on page 133. Figure 12-6 shows a Listing window with the default Browser Field Formatter open.
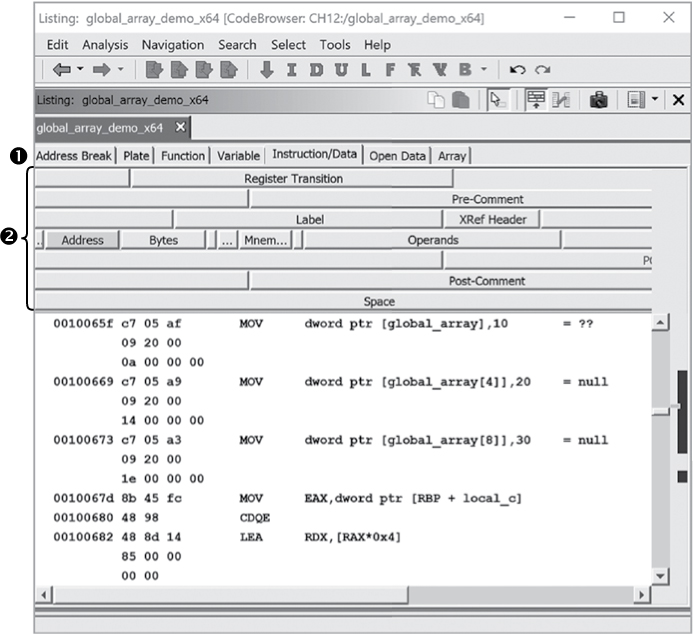
Figure 12-6: Listing window with default Browser Field Formatter open
A row of tabs ➊ representing the various field types present in the disassembly appears at the top of the formatter. In this case, we are looking at instructions, so the Instruction/Data tab is selected. The remainder of the formatter ➋ displays bars for each individual field associated with an address in an Instruction/Data section. In this case, the cursor is on an address within the Listing window, so the Address field is highlighted.
You can use the Browser Field Formatter to change the appearance of the listing. The capabilities are extensive, and each field has its own associated options. We will investigate only some of the simpler capabilities, many of which are similar to editing the appearance of windows in the CodeBrowser. You can rearrange fields by dragging them to new locations; increase or decrease the width of a field; and add, remove, enable, or disable individual fields.
Figure 12-7 shows the same listing contents after removing the Bytes field. We have removed the Bytes field in many of the listing images in previous chapters to condense the listing and show more content in the available space.

Figure 12-7: Listing window with customized Browser Field Formatter selections
Saving the CodeBrowser Layout
When closing the CodeBrowser, you can save any layout changes associated with a file. Alternatively, you can exit without saving, which generates a warning message to make sure you understand the implications. If you use the File ▸ Save Tool option in the CodeBrowser window, the current CodeBrowser appearance will be associated with the current file within the active project. The next time you open the file, Ghidra will use the saved CodeBrowser layout. When you have multiple CodeBrowser instances open at the same time and have modified some (or all) of them, this can result in conflicting tool configurations. Ghidra will then display a new Save Tool dialog, as shown in Figure 12-8.

Figure 12-8: Ghidra’s Save Tool – Possible Conflict dialog
Later in this chapter, we will show you how to use this and similar customization functionality to create a new powerful suite of tools that are tuned to your individual reverse engineering tasks and tastes.
Ghidra Project Window
Let’s switch gears (or windows anyway) and venture back to the Ghidra Project window, shown in Figure 12-9. The main menu was discussed in the preceding chapter. Before we discuss Project window customizations, let’s look at two areas of the window that we have not yet discussed.
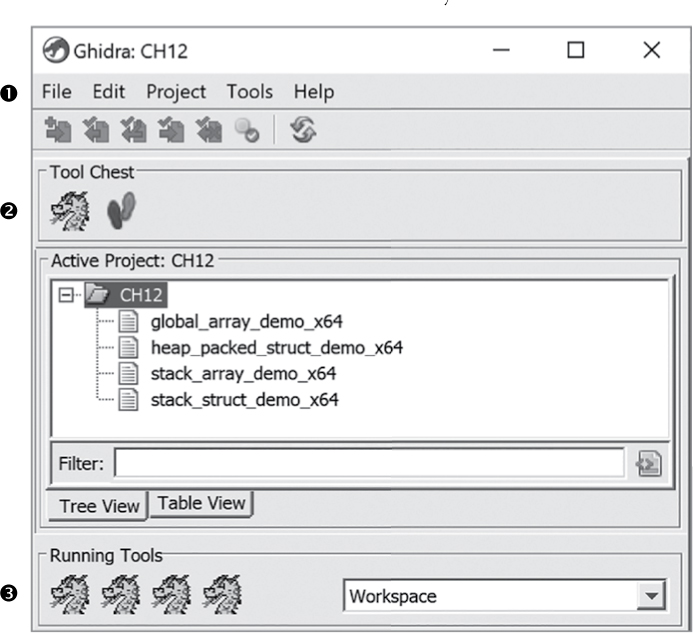
Figure 12-9: Ghidra Project window
The Tool Chest ➋ displays icons for all of the tools capable of operating on the binaries that you have imported into your projects. By default, two tools are available. The dragon icon is the default for the CodeBrowser, and the footprints icon is associated with Ghidra’s version control tool. We demonstrate how to supplement the Tool Chest by modifying and importing tools, as well as building our own, a little later in this chapter.
The Running Tools ➌ contains icons for each running tool instance. In this example, we have opened each of the project files in a separate CodeBrowser window. As a result, four instances of CodeBrowser are currently running. Clicking any of the Running Tools icons brings the associated tool to the foreground of your desktop.
Let’s return to the Ghidra Project window menu ➊ and look at some of the options to customize the window. We will start by investigating the four Edit ▸ Tool Options actions for the Ghidra project shown in Figure 12-10. Two of the options are the same as in CodeBrowser: Key Bindings and Tool.
In Figure 12-10, the Key Bindings option has been selected. The Ghidra Project tool has significantly fewer actions than the CodeBrowser tool does, and therefore fewer options for key binding. If you’re playing along at home, you may notice that most of the actions are associated with the FrontEndPlugin. (The Ghidra Project tool is also called the Ghidra Frontend, and these terms are used interchangeably throughout the Ghidra environment, including Ghidra Help.)
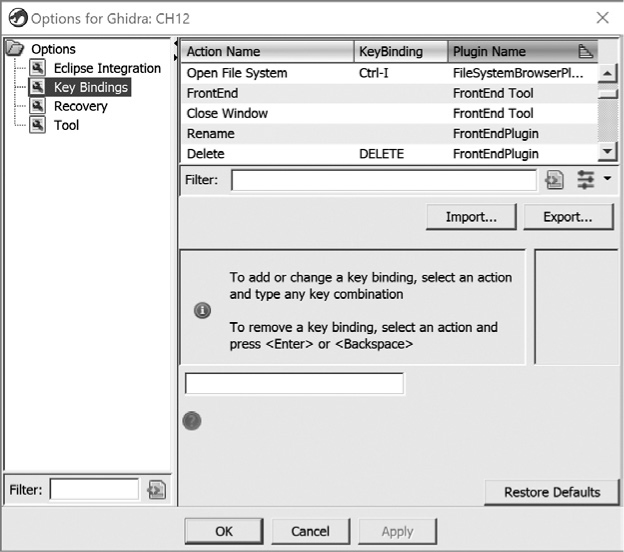
Figure 12-10: Ghidra Project window (aka Ghidra Frontend), via Edit ▸ Tool Options
Eclipse Integration is the focus of Chapter 15, so we will postpone discussion of this particular option for now. Recovery simply allows you to set a frequency for snapshots. The default value is 5 minutes. Setting this value to 0 disables snapshots.
The final option, Tool, can be quite fun to experiment with. As mentioned earlier in the chapter, the generic term tool, in this context, refers to the active tool. In this case, it is the Ghidra Project tool. The associated options are shown in Figure 12-11, and we will focus on the Swing Look And Feel and Use Inverted Colors options, which change the appearance of the Ghidra windows.
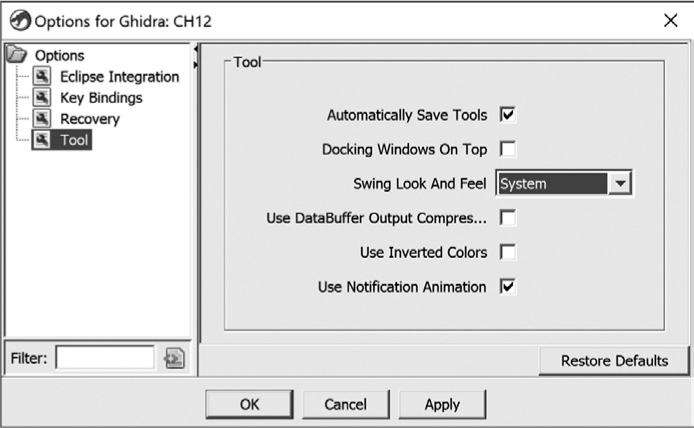
Figure 12-11: Ghidra Project tool edit options
The combination of Use Inverted Colors with the selection of Metal for the Swing Look And Feel results in a dark theme that is popular with many reverse engineers. Your changes will take effect after you restart Ghidra, and the new styles will be used for all Ghidra windows, including the CodeBrowser and Decompiler. A portion of the resulting CodeBrowser window is shown in Figure 12-12.
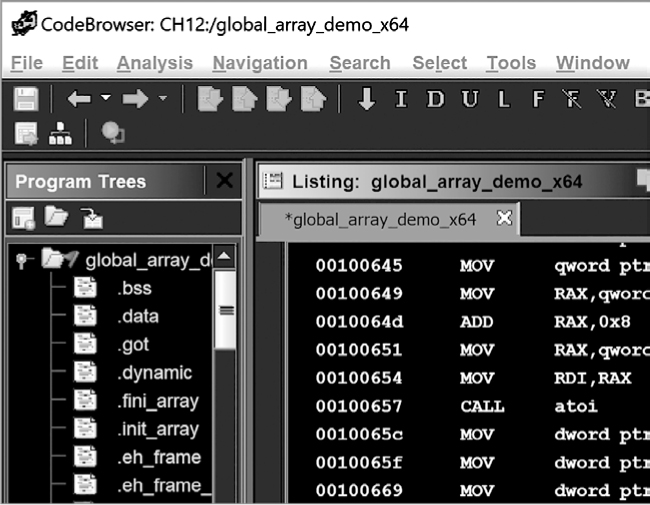
Figure 12-12: Portion of the CodeBrowser window using a dark theme
Now that you know how to change the look and feel of Ghidra to better suit your personality, let’s return to the File menu and investigate what configuration means in that context. The File ▸ Configure option displays three categories of Ghidra plugin collections, as shown in Figure 12-13. Each category has a different purpose.
Ghidra Core contains the set of plugins that we have been using in our default Ghidra configuration. These provide the basic functionality that is essential to reverse engineering. The Developer category provides plugins that assist you in the process of developing new plugins. This is a good starting point if you want to learn more about Ghidra development. The final group of plugins is Experimental. These plugins have not been thoroughly tested and could destabilize your Ghidra instance, so use them with caution.

Figure 12-13: Ghidra project configuration options
While only Ghidra Core is enabled as part of the default Ghidra installation, you can check the box next to the other options to enable them as well. Use the Configure option beneath a category to select (or deselect) the individual plugins that appear in the category list. Figure 12-14 displays the Ghidra Core plugins list, including a description and category for each. If you click a Ghidra plugin within this menu, a window at the bottom of the screen will provide additional information about the plugin.
Two additional Ghidra Project menu options are available for Ghidra configuration. The first is File ▸ Install Extensions, which we discuss in Chapter 15. The other option, Edit ▸ Plugin Path, allows you to add, modify, and delete new user plugin paths, which tell Ghidra where to look for additional Java classes beyond its installed defaults. Through this option, you can include additional plugins and classes in your Ghidra instance. Editing the plugin path requires that you restart Ghidra in order to see the results.

Figure 12-14: Ghidra Core configuration window with ImporterPlugin selected
Now that you have seen the potential to modify plugin options, we can move on to extend plugin use. The Tools menu option allows you to perform operations associated with tools, including creating new tools (if none of the existing tools exactly fit your needs). In this case, we will build and work with tools that are collections of existing plugins, rather than coding plugins from scratch.
Tools
Most of the tool options are provided in the Ghidra Project window Tools menu, shown in Figure 12-15. Until now, you have been using and modifying the default tool, CodeBrowser, as your primary analysis tool. We will now demonstrate how you can create custom tools in Ghidra.
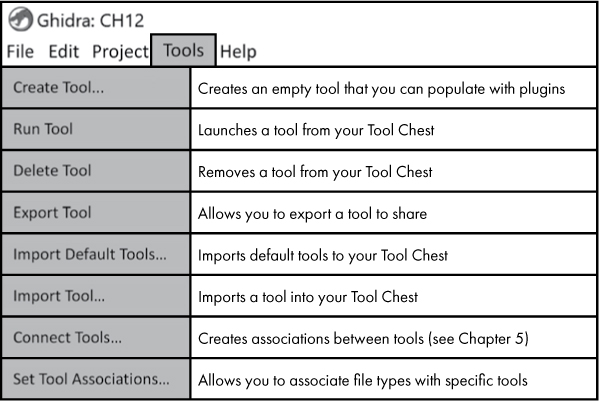
Figure 12-15: Ghidra Tools menu options
If you have experimented with modifying the CodeBrowser tool, you may have become frustrated when the default tool is modified for subsequent files you open. Let’s consider a specialized case where you want to examine a file, with many function calls, that is complicated to navigate. In Chapter 10, we demonstrated the use of function call graphs and function graphs to help you understand the control flow of a program. Both of these graphs open in their own windows, which can cause challenges if you have many files open. Let’s address these challenges with a specialized tool called ExamineControlFlow that you can use to analyze the flow of control in a program.
When you choose the Tools ▸ Create Tool… menu option, you are presented with two windows (shown stacked in Figure 12-16). The upper window in the figure presents plugin options similar to those you saw in Figure 12-13, but with one additional category, Function ID, which we discuss in Chapter 13. The lower window in the figure is an empty, untitled tool development window that you can customize to create your tool, ExamineControlFlow.

Figure 12-16: Ghidra Configure Tool window
You can compose your new tool by using plugins from Ghidra Core. When you select the Ghidra Core category, your tool development window populates with options from Ghidra Core, as shown in Figure 12-17. The resulting window has a lot in common with the CodeBrowser. This makes sense, as the CodeBrowser is also based on Ghidra Core.

Figure 12-17: New, untitled tool before configuration
You will need to remove some of the plugins that you don’t want in your new tool and then specify the windows that you do want. Click the Configure option under Ghidra Core and delete the following plugins you don’t need (you could remove many others, but we have chosen not to for the sake of brevity):
- Console
- DataTypeManagerPlugin
- EclipseIntegrationPlugin
- ProgramTreePlugin
Each of these is associated with other plugins, so, as you remove each one from your new tool, Ghidra will display a warning message with the list of additional plugins that are being removed. You can add plugins back in by choosing File ▸ Configure from your new tool at any time. An example of the warning message associated with removing DataTypeManagerPlugin is shown in Figure 12-18.
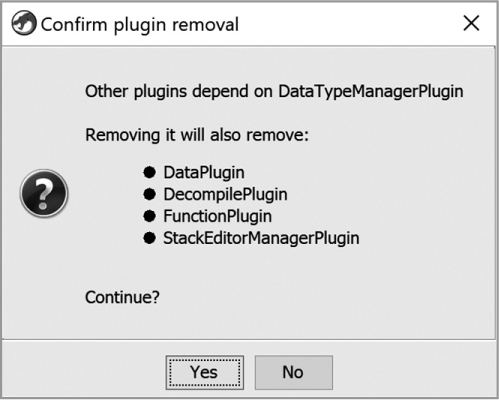
Figure 12-18: Plugin dependency warning for DataTypeManagerPlugin
You can also control the layout of your new tool. In this case, you want to be able to see the Listing, Function Call Graph, and Function Graph windows in the same tool. Using the techniques described in previous chapters, you open the desired windows by using the Window menu in your new tool and then drag them into the desired locations. The new, untitled tool is shown in Figure 12-19.
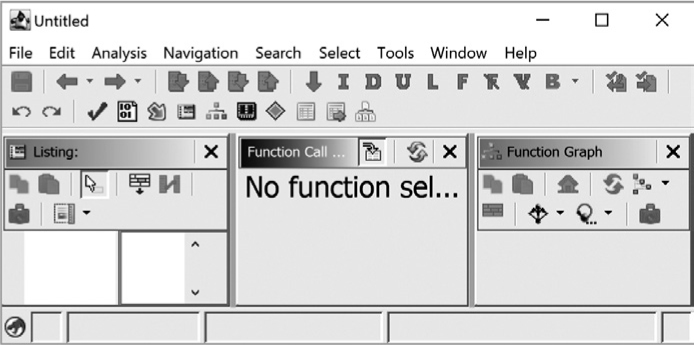
Figure 12-19: New, untitled tool
Since you plan to use this tool frequently and share it with your collaborators, you should save the tool by selecting File ▸ Save Tool As, which presents you with the options to name the tool and associate an icon with it (see Figure 12-20). You can choose from among the provided icons or select your own image file in a supported format (for example, .jpg, .png, .gif, and so on).

Figure 12-20: Icon options for new tools
This new tool (and other tools you create) becomes part of your Tool Chest and will be displayed as an option in your projects, as shown in Figure 12-21.
To share a new tool with others, export it using Tools ▸ Export Tools. Ghidra will ask you to choose a folder in which to save the tool and then create a .tool file containing your tool specification. To import a tool, use the Tools ▸ Import Tool option.
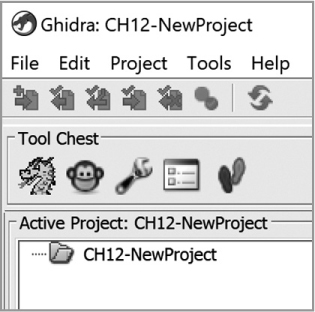
Figure 12-21: New project with new tool options displayed in Tool Chest
While double-clicking a file in the Ghidra Project window opens the file in the CodeBrowser by default, you can choose any tool in your Tool Chest by right-clicking the file and then choosing the tool from the context menu. Alternatively, you can drag the filename and drop it onto a tool.
The more you use Ghidra, the more you will realize that there is no one-size-fits-all Ghidra interface that provides exactly the tools you need for each RE task you undertake. As a reverse engineer, the approach to analyzing a particular file largely depends on the file itself, the goal of the analysis, and the progress toward that goal.
We have devoted much of this chapter and earlier chapters to describing how you might change Ghidra’s look and feel as well as the tools available to meet your needs. A final step in customizing Ghidra is the ability to save these configurations you have created so that you can choose the correct configuration based on the analysis project you are undertaking. This is accomplished through the creation and preservation of Ghidra workspaces.
Workspaces
A Ghidra workspace can be viewed as a virtual desktop that includes the tools as they are currently configured and the associated files. Imagine that you are analyzing a binary. While you are looking at the file, you notice characteristics that are similar to another file you analyzed last week. You would like to compare the two files to identify the similarities between the two functions, but you also want to continue analyzing the file. These are two unique problems that have a file in common.
One way to proceed down these two paths concurrently is to create a workspace associated with each analysis problem. You can preserve your current analysis by selecting Project ▸ Workspace ▸ Add from the Ghidra Project window and giving the new workspace a name. In this example, we will call this workspace FileAnalysis. You can then open another tool from the Tool Chest and perhaps compare the two files using a specialized tool that utilizes the Diff View (see Chapter 23), then create a second workspace (FileComparison) using the same method. You can now easily switch between the workspaces by selecting the workspace in the pull-down menu shown in Figure 12-22 or by using the Switch option in the Project ▸ Workspace menu, which cycles you through the available workspaces.
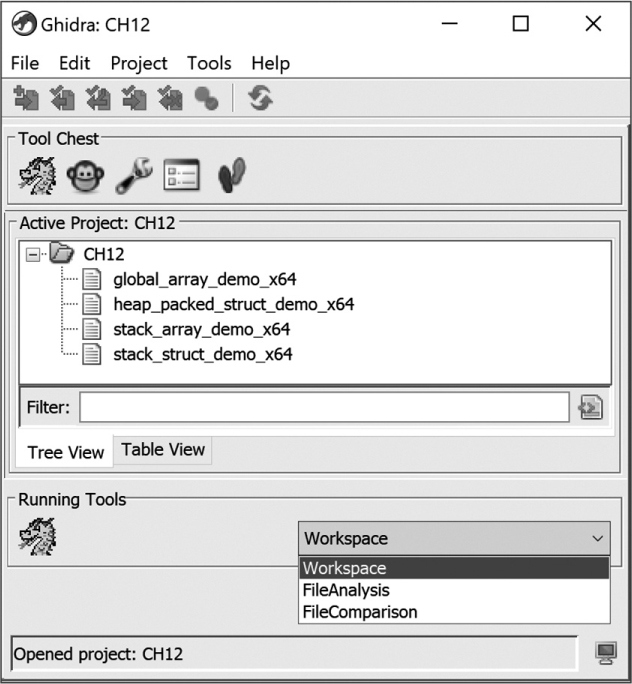
Figure 12-22: Workspace options within Ghidra Project window
Summary
When starting out with Ghidra, you may be perfectly satisfied with its default behaviors and its default CodeBrowser layout. However, as you become more comfortable with Ghidra’s basic features, you are certain to find ways to customize Ghidra for your reverse engineering workflow. While there is no way for a single chapter to provide complete coverage of every possible option Ghidra offers, we have introduced and provided examples for the customization capabilities that you will most likely need at some point in your SRE experience. Discovering additional useful tools and options is left as a matter of exploration for inquisitive readers.