
19
THE GHIDRA DECOMPILER

Until now, we’ve focused our reverse engineering analysis on the Listing window and presented Ghidra’s features through the disassembly listing lens. In this chapter, we shift our focus to the Decompiler window and investigate how we can accomplish familiar analysis tasks (and some new ones) with the Decompiler and its associated functionality. We start with a brief overview of the decompilation process before moving on to the functionality available in the Decompiler window. We then walk through some examples to help you identify ways that the Decompiler window can be used to improve your reverse engineering process.
Decompiler Analysis
It’s logical to assume that the content in the Decompiler window is derived from the Listing window, but, surprisingly, the contents of the Listing window and Decompiler window are derived independently, which is why they sometimes disagree and why both should be evaluated in context when you’re trying to determine ground truth. The main function of Ghidra’s Decompiler is to convert machine language instructions into p-code (see Chapter 18) and then to convert the p-code to C and present it in the Decompiler window.
In a simplified view, the decompilation process includes three distinct phases. In the first phase, the Decompiler uses the SLEIGH specification file to create a draft of the p-code and derive associated basic blocks and flows. The second phase focuses on simplification: unneeded content such as unreachable code is eliminated, and then control flows are adjusted and tuned in response to the changes. In the wrap-up phase, finishing touches are added, some final checks are made, and the final results are sent through a pretty-printing algorithm before being presented in the Decompiler window. Of course, this greatly simplifies a very complex process, but the main takeaways are the following:1
The Decompiler is an analyzer.
It starts its work with the binary and produces p-code.
It converts the p-code to C.
The C code and any associated messages are displayed in the Decompiler window.
We discuss some of these steps in more detail as we navigate through Ghidra’s decompilation functionality. Let’s start our investigation with the analysis process and the primary capabilities it unleashes.
Analysis Options
During the auto analysis process, there are several analyzers that pertain to the Decompiler window. Decompiler analysis options are managed through the Edit ▸ Tool Options menu, shown in Figure 19-1 with defaults selected.
We discuss two of these options, Eliminate unreachable code and Simplify predication, next. For the remaining options, you can experiment with their results or refer to Ghidra Help.
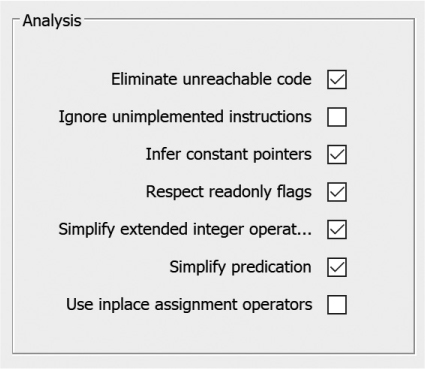
Figure 19-1: Ghidra Decompiler analysis options with defaults selected
Eliminate Unreachable Code
The Eliminate unreachable code option excludes unreachable code from the Decompiler listing. For example, the following C function has two conditions that can never be met, which makes the corresponding conditional blocks unreachable:
int demo_unreachable(volatile int a) {
volatile int b = a ^ a;
➊ if (b) {
printf("This is unreachable
");
a += 1;
}
➋ if (a - a > 0) {
printf("This should be unreachable too
");
a += 1;
} else {
printf("We should always see this
");
a += 2;
}
printf("End of demo_unreachable()
");
return a;
}
The variable b is initialized to zero in a perhaps less than obvious manner. When b is tested ➊, its value can never be non zero, and the body of the corresponding if statement will never be executed. Similarly a - a can never be greater than zero, and the condition in the second if statement ➋ can also never evaluate to true. When the Eliminate unreachable code option is selected, the Decompiler window displays warning messages to let us know it has removed unreachable code.
/* WARNING: Removing unreachable block (ram,0x00100777) */
/* WARNING: Removing unreachable block (ram,0x0010079a) */
ulong demo_unreachable(int param_1)
{
puts("We should always see this");
puts("End of demo_unreachable()");
return (ulong)(param_1 + 2);
}
Simplify Predication
This option optimizes if/else blocks by merging blocks that share the same condition. In the following listing, the first two if statements share the same condition:
int demo_simppred(int a) {
if (a > 0) {
printf("A is > 0
");
}
if (a > 0) {
printf("Yes, A is definitely > 0!
");
}
if (a > 2) {
printf("A > 2
");
}
return a * 10;
}
With Simplify predication enabled, the resulting Decompiler listing shows the combined blocks:
ulong demo_simppred(int param_1)
{
if (0 < param_1) {
puts("A is > 0");
puts("Yes, A is definitely > 0!");
}
if (2 < param_1) {
puts("A > 2");
}
return (ulong)(uint)(param_1 * 10);
}
The Decompiler Window
Now that you understand how the Decompiler Analysis Engine populates the Decompiler window, let’s see how you can use the window to facilitate your analysis. Navigating the Decompiler window is relatively easy, as it displays only one function at a time. To move between functions or see the function in context, it is helpful to correlate with the Listing window. Because the Decompiler window and the Listing window are linked by default, you can navigate both by using the available options in the CodeBrowser toolbar.
The function displayed in the Decompiler window helps with analysis, but it may not be so easy to read at first. Any lack of information about the data types used by the functions that it decompiles requires Ghidra to infer those data types itself. As a result, the decompiler may overuse type casts, as you can see in the following sample statements:
printf("a=%d, b=%d, c=%d, d=%d, e=%d, f=%d, g=%d
", (ulong)param_1,
(ulong)param_2,(ulong)uVar1,(ulong)uVar2,(ulong)(uVar1 + param_1),
(ulong)(uVar2 * 100),(ulong)uVar4);
uStack44 = *(undefined4 *)**(undefined4 **)(iStack24 + 0x10);
As you provide more accurate type information using the Decompiler editing options, you will notice that the Decompiler relies less and less on type casts, and the generated C code become easier to read. In the examples that follow, we’ll discuss some of the Decompiler window’s most useful features to clean up the generated source code. The ultimate goal is readable source code that is easier to comprehend, which reduces the amount of time needed to understand the behavior of the code.
Example 1: Editing in the Decompiler Window
Consider a program that accepts two integer values from the user and then calls the following function:
int do_math(int a, int b) {
int c, d, e, f, g;
srand(time(0));
c = rand();
printf("c=%d
", c);
d = a + b + c;
printf("d=%d
", d);
e = a + c;
printf("e=%d
", e);
f = d * 100;
printf("f=%d
", f);
g = rand() - e;
printf("g=%d
", g);
printf("a=%d, b=%d, c=%d, d=%d, e=%d, f=%d, g=%d
", a, b, c, d, e, f, g);
return g;
}
The function uses two integer parameters with five local variables to generate its output. The interdependencies can be summed up as follows:
Variable c depends on the rand() return value, influences d and e directly, and influences f and g indirectly.
Variable d depends on a, b, and c, and influences f directly.
Variable e depends on a and c, and influences g directly.
Variable f depends on d directly and on a, b, and c indirectly, and influences nothing.
Variable g depends on e directly and on a and c indirectly, and influences nothing.
When the associated binary is loaded into Ghidra and the function is analyzed, you see the following representation of the do_math function in the Decompiler window:
ulong do_math(uint param_1,uint param_2)
{
uint uVar1;
uint uVar2;
int iVar3;
uint uVar4;
time_t tVar5;
tVar5 = time((time_t *)0x0);
srand((uint)tVar5);
uVar1 = rand();
printf("c=%d
");
uVar2 = uVar1 + param_1 + param_2;
➊ printf("d=%d
");
printf("e=%d
");
printf("f=%d
");
iVar3 = rand();
uVar4 = iVar3 - (uVar1 + param_1);
printf("g=%d
");
printf("a=%d, b=%d, c=%d, d=%d, e=%d, f=%d, g=%d
", (ulong)param_1,
(ulong)param_2,(ulong)uVar1,(ulong)uVar2,(ulong)(uVar1 + param_1),
(ulong)(uVar2 * 100),(ulong)uVar4);
return (ulong)uVar4;
}
If you want to do your analysis using the Decompiler, you’ll want to make sure the code the Decompiler is generating is as accurate as possible. Usually, this is done by providing as much information as possible about data types and function prototypes. Functions that accept a variable number of arguments, such as printf, are especially tricky for the Decompiler since the Decompiler would need to fully understand the semantics of the required arguments in order to estimate the number of supplied optional arguments.
Overriding Function Signatures
You can see a number of printf statements ➊ that don’t look quite right. Each one has a format string but no additional arguments. Since printf takes a variable number of arguments, you can override the function signature at each calling location and (based on the format string) indicate that the printf statement should take one integer argument.2 To make this change, right-click a printf statement and choose Override Signature from the context menu to open the dialog shown in Figure 19-2.

Figure 19-2: The Override Signature dialog
Adding the second parameter type, int, to the signature (as shown in the figure) for each of the printf statements results in the following listing:
ulong do_math(uint param_1,uint param_2)
{
➊ uint uVar1;
uint uVar2;
uint uVar3;
int iVar4;
uint uVar5;
time_t tVar6;
tVar6 = time((time_t *)0x0);
srand((uint)tVar6);
uVar1 = rand();
printf("c=%d
",uVar1);
uVar2 = uVar1 + param_1 + param_2;
printf("d=%d
",uVar2);
➋ uVar3 = uVar1 + param_1;
printf("e=%d
",uVar3);
printf("f=%d
",uVar2 * 100);
iVar4 = rand();
➌ uVar5 = iVar4 - uVar3;
printf("g=%d
",uVar5);
➍ printf("a=%d, b=%d, c=%d, d=%d, e=%d, f=%d, g=%d
", (ulong)param_1,
(ulong)param_2,(ulong)uVar1,(ulong)uVar2,(ulong)(uVar1 + param_1),
(ulong)(uVar2 * 100),(ulong)uVar4);
return (ulong)uVar4;
}
In addition to the updated calls to printf with the correct arguments, two new lines have been added to the Decompiler listing as a result of overriding the printf function ➋ ➌. These statements weren’t included previously because Ghidra believed the results were not used. Once the Decompiler understands that the results are used in each printf, the statements become meaningful and are displayed in the Decompiler window.
Editing Variable Types and Names
After correcting the function calls, you can continue cleaning up the listing by renaming (hotkey L) and retyping (hotkey CTRL-L) the parameters and the variables ➊ based on the names found in the printf format strings. As an aside, format strings are an extremely valuable source of information regarding the type and purpose of variables in any program.
After these changes have been completed, the final printf statement ➍ is still a bit cumbersome:
printf("a=%d, b=%d, c=%d, d=%d, e=%d, f=%d, g=%d
", (ulong)a,
(ulong)(uint)b, (ulong)(uint)c, (ulong)(uint)d, (ulong)(uint)e,
(ulong)(uint)(d * 100),(ulong)(uint)g);
Right-clicking this statement allows you to override the function signature. The first argument in this printf statement is the format string, and it doesn’t need to be modified. Changing the rest of the arguments to type int results in the following cleaner code (Listing 19-1) in the Decompiler window.
int do_math(int a, int b)
{
int c;
int d;
int e;
int g;
time_t tVar1;
tVar1 = time((time_t *)0x0);
srand((uint)tVar1);
c = rand();
printf("c=%d
",c);
d = c + a + b;
printf("d=%d
",d);
e = c + a;
printf("e=%d
",e);
printf("f=%d
",d * 100);
g = rand();
g = g - e;
printf("g=%d
",g);
printf("a=%d, b=%d, c=%d, d=%d, e=%d, f=%d, g=%d
",a,b,c,d,e,d * 100➊,g);
return g;
}
Listing 19-1: Decompiled function with updated signatures
This is very similar to our original source code and much easier to read than the original Decompiler listing as the modifications of the function arguments have been propagated throughout the listing. One difference between the Decompiler listing and our original source code is that the variable f has been replaced by an equivalent expression ➊.
Highlighting Slices
Now that you have a more understandable Decompiler window, you can begin further analysis. Suppose that you want to know how individual variables affect and are affected by other variables. A program slice is a collection of statements that contribute to the value of a variable (backward slice) or are affected by a variable (forward slice). In vulnerability analysis scenarios, this might manifest as “I have control of this variable; where does its value get used?”
Ghidra provides five options in its right-click context menu to highlight relationships between variables and instructions in a function. If you right-click a variable in the Decompiler window, you can choose from the following options:
Highlight Def-use This option highlights all uses of the variable within the function. (You can use a middle mouse click to get the same effect.)
Highlight Forward Slice This option highlights everything that is impacted by the value in the selected variable. For example, if you select variable b in Listing 19-1 and choose this option, all occurrences of b and d will be highlighted in the listing, because a change in the value of b could also result in a change in the value of d.
Highlight Backward Slice This is the inverse of the previous option and highlights all of the variables that contribute to a particular value. If you right-click variable e in the final printf statement in Listing 19-1 and choose this option, all of the variables that affect the value of e (in this case e, a, and c) will be highlighted. Changing a or c could also change the value of e.
Highlight Forward Inst Slice This option highlights the entire statement associated with the Highlight Forward Slice option. In Listing 19-1, if you use this option while variable b is selected, all statements in which b or d appear will be highlighted.
Highlight Backward Inst Slice This option highlights the entire statement associated with the Highlight Backward Slice option. In Listing 19-1, selecting this option while highlighting variable e in the final printf statement will cause all statements in which a, c, or e appear to be highlighted.
Now that we have a general understanding of some approaches to work with the Decompiler window and use it in our analysis, let’s look at a more specific example.
Example 2: Non-Returning Functions
In general, Ghidra can safely assume function calls return and therefore treat function calls as if they exhibit sequential flow within basic blocks. However, some functions, such as those marked with the noreturn keyword in source code, or ended with an obfuscated jump instruction in malware, do not return, and Ghidra may generate inaccurate disassembled or decompiled code. Ghidra offers three approaches for dealing with non-returning functions: two non-returning function analyzers and the capability to edit function signatures manually.
Ghidra can identify non-returning functions based on a list of known noreturn functions such as exit and abort using the Non-Returning Functions-Known analyzer. This analyzer is selected by default as part of auto analysis, and its job is straightforward: if a function name appears in its list, it marks the function as non-returning and does its best to correct any associated issues (for example, set associated calls to non-returning, find flows that might need repairing, and so on).
The Non-Returning Functions-Discovered analyzer looks for clues that might indicate that a function doesn’t return (for example, data or bad instructions right after the call). What it does with the information is largely controlled by the three options associated with the analyzer, as shown in Figure 19-3.

Figure 19-3: Analysis options for Non-Returning Functions-Discovered
The first option ➊ allows the automatic creation of analysis bookmarks (which appear on the Listing window’s bookmark bar). The second option ➋ allows you to specify a threshold that determines whether to designate a function as non-returning based on a series of checks for characteristics that are likely to indicate a non-returning function. Finally, there is a checkbox ➌ to repair the associated flow damage.
When Ghidra is unable to identify a non-returning function, you have the option to edit the function signature yourself. If you complete analysis and have error bookmarks, which are used to flag bad instructions, then that is a good indication that something is not quite right with Ghidra’s own analysis. If the bad instruction follows a CALL, as in
00100839 CALL noReturnA
0010083e ?? FFh
then you are likely to see an associated post-comment warning you about the situation in the Decompiler window, like this:
noReturnA(1);
/* WARNING: Bad instruction - Truncating control flow here */
halt_baddata();
If you click the function name (noReturnA in this case) in the Decompiler window and then choose Edit Function Signature, you will have the option to modify attributes associated with the function, as shown in Figure 19-4.

Figure 19-4: Editing function attributes
Check the No Return box to mark the function as non-returning. Ghidra then inserts a pre comment, shown next, in the Decompiler window as well as a post comment in the Listing window:
/* WARNING: Subroutine does not return */
noReturnA(1);
With this error corrected, you can move on to other issues.
Example 3: Automated Structure Creation
When analyzing decompiled C source code, you’re likely to come across statements that appear to contain structure field references. Ghidra helps you create a structure and populate it based on the associated references that the Decompiler has detected. Let’s walk through an example starting with the source code and Ghidra’s initial decompilation of the code.
Suppose you have source code that defines two struct types and then creates a global instance of each:
➊ struct s1 {
int a;
int b;
int c;
};
➋ typedef struct s2 {
int x;
char y;
float z;
} s2_type;
struct s1 GLOBAL_S1;
s2_type GLOBAL_S2;
One structure ➊ contains homogeneous elements, and the other ➋ contains a heterogeneous collection of types. The source code also contains three functions, one of which (do_struct_demo) declares a local instance of each structure type:
void display_s1(struct s1* s) {
printf("The fields in s1 = %d, %d, and %d
", s->a, s->b, s->c);
}
void update_s2(s2_type* s, int v) {
s->x = v;
s->y = (char)('A' + v);
s->z = v * 2.0;
}
void do_struct_demo() {
s2_type local_s2;
struct s1 local_s1;
printf("Enter six ints: ");
scanf("%d %d %d %d %d %d", (int *)&local_s1, &local_s1.b, &local_s1.c,
&GLOBAL_S1.a, &GLOBAL_S1.b, &GLOBAL_S1.c);
printf("You entered: %d and %d
", local_s1.a, GLOBAL_S1.a);
display_s1(&local_s1);
display_s1(&GLOBAL_S1);
update_s2(&local_s2, local_s1.a);
}
The decompiled version of do_struct_demo appears in Listing 19-2.
void do_struct_demo(void)
{
undefined8 uVar1;
uint local_20;
undefined local_1c [4];
undefined local_18 [4];
undefined local_14 [12];
uVar1 = 0x100735;
printf("Enter six ints: ");
__isoc99_scanf("%d %d %d %d %d %d", &local_20, local_1c, local_18,
GLOBAL_S1,0x30101c,0x301020,uVar1);
printf("You entered: %d and %d
",(ulong)local_20,(ulong)GLOBAL_S1._0_4_);
➊ display_s1(&local_20);
➋ display_s1(GLOBAL_S1);
update_s2(local_14,(ulong)local_20,(ulong)local_20);
return;
}
Listing 19-2: Initial decompilation of do_struct_demo
Navigating to the display_s1 function from either function call ➊➋ by double-clicking it in the Decompiler window yields the following:
void display_s1(uint *param_1)
{
printf("The fields in s1 = %d, %d, and %d
", (ulong)*param_1,
(ulong)param_1[1],(ulong)param_1[2]);
return;
}
Because you suspect the argument to display_s1 might be a structure pointer, you can ask Ghidra to automate the process of creating a struct for you by right-clicking param_1 in the function’s argument list and selecting Auto Create Structure from the context menu. In response, Ghidra tracks all uses of param_1, treats all arithmetic performed on the pointer as referencing a member of a struct, and automatically creates a new struct type containing fields at each referenced offset. This changes a few things in the Decompiler listing:
void display_s1(astruct *param_1)
{
printf("The fields in s1 = %d, %d, and %d
",(ulong)param_1->field_0x0,
(ulong)param_1->field_0x4,(ulong)param_1->field_0x8);
return;
}
The type of the parameter has changed and is now astruct*, and the call to printf now contains field references. The new type has also been added to the Data Type Manager, and hovering over the structure name displays the field definitions, as shown in Figure 19-5.

Figure 19-5: Automatic structs in the Data Type Manager
You can update the type for local_20 and GLOBAL_S1 to astruct by using the Retype Variable option from the right-click context menu. The results are shown in the following listing:
void do_struct_demo(void)
{
undefined8 uVar1;
➊ astruct local_20;
undefined local_14 [12];
uVar1 = 0x100735;
printf("Enter six ints: ");
__isoc99_scanf("%d %d %d %d %d %d", &local_20, &local_20.field_0x4➋,
➌ &local_20.field_0x8, &GLOBAL_S1, 0x30101c, 0x301020, uVar1);
printf("You entered: %d and %d
", (ulong)local_20.field_0x0,
➍ (ulong)GLOBAL_S1.field_0x0);
display_s1(&local_20);
display_s1(&GLOBAL_S1);
update_s2(local_14,(ulong)local_20.field_0x0,(ulong)local_20.field_0x0);
return;
}
Comparing this with Listing 19-2 shows the modification of the type for local_20 ➊ and the addition of field references for both local_20 ➋ ➌ and GLOBAL_S1 ➍.
Let’s shift focus to the decompilation of the third function, update_s2, shown in Listing 19-3.
void update_s2(int *param_1,int param_2)
{
*param_1 = param_2;
*(char *)(param_1 + 1) = (char)param_2 + 'A';
*(float *)(param_1 + 2) = (float)param_2 + (float)param_2;
return;
}
Listing 19-3: Initial decompilation of update_s2
You can use the previous approach to automatically create a structure for param_1. Simply right-click param_1 in the function and choose Auto Create Structure from the context menu.
void update_s2(astruct_1 *param_1,int param_2)
{
param_1->field_0x0 = param_2;
param_1->field_0x4 = (char)param_2 + 'A';
param_1->field_0x8 = (float)param_2 + (float)param_2;
return;
}
The Data Type Manager now has a second struct definition associated with this file, as shown in Figure 19-6.
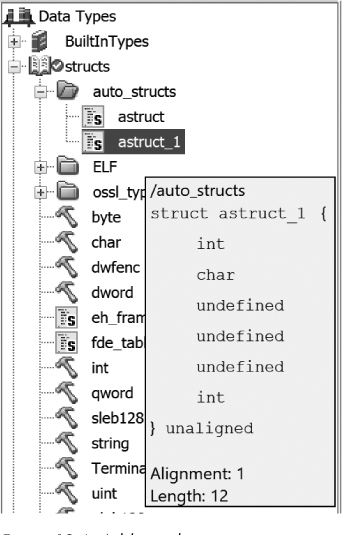
Figure 19-6: Additional automatic structs in the Data Type Manager window
This structure has an int, a char, three undefined bytes (likely padding inserted by the compiler), and a float. To edit the structure, right-click astruct_1 and choose Edit from the context menu, which opens the Structure Editor window. If we choose to name the int field x, the char field y, and the float field z, and then save the changes, the new field names will be reflected in the Decompiler listing:
void update_s2(astruct_1 *param_1,int param_2)
{
param_1->x = param_2;
param_1->y = (char)param_2 + 'A';
param_1->z = (float)param_2 + (float)param_2;
return;
}
This listing is much easier to read and understand than the original decompilation in Listing 19-3.
Summary
The Decompiler window, like the Listing window, provides you with a view into a binary, and each has its associated strengths and weaknesses. The Decompiler provides a higher-level view that can help you understand the general structure and functionality of a single function more quickly than looking at the disassembly (particularly for those who do not have years of experience reading disassembly listings). The Listing window provides a lower-level view of the entire binary, with all of the available detail, but this can make it more difficult to gain insight into the big picture.
Ghidra’s Decompiler can be used effectively with the Listing window and all of the other tools we have introduced throughout the book to aid you in your reverse engineering process. In the end, it is the reverse engineer’s role to determine the best approach to solving the problem at hand.
This chapter focused on the Decompiler window and issues associated with decompilation. Many of challenges can be traced to the wide variety of compilers and associated compiler options that directly influence the resulting binary. In the next chapter, we take a look at some compiler-specific behaviors and compiler build options to better understand the resulting binaries.