
![]() DIRECTIONAL POLICY MATRIX
DIRECTIONAL POLICY MATRIX
Application: Business Portfolio Strategy, Investment, Budgeting
The Concept
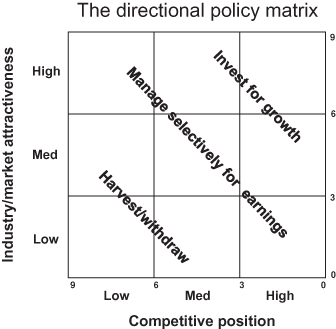
Sometimes called the “GE/McKinsey matrix”, the directional policy matrix is a way of categorizing and prioritizing opportunities (see Figure D.3). It can be customized to unique content and made relevant to the individual strategic position of the company in its market place. The grid plots “market attractiveness” against “business strength” and allows management to prioritize resources accordingly. It is created in the following way:
(i) Identify and define the strategic business units in a company.
(ii) Debate and agree the factors contributing to market attractiveness in the markets under discussion.
(iii) Agree the factors contributing to business success.
(iv) Rank and rate the market attractiveness and business strength features.
(v) Rank each business or product unit against these criteria.
(vi) Plot the SBUs on the matrix.
(vii) Represent the total size of the market and the business’s market share by a pie chart at the appropriate plot on the matrix.
Figure D.3: The directional policy matrix
Steps (iv) and (v) involve numerically rating the relative importance of each feature. Multiplying these together and totalling them for each business unit gives a composite score which allows marketers to plot the businesses on the matrix.
This visual presentation means that complex information can be presented in an easily understood form and strategy can be deduced from the matrix. Where a business unit scores high or medium on business strength or market attractiveness the firm should maintain or grow investment. Whereas those which score low/low or low/medium should have investment cut. If possible, cash should be harvested from them. Units scoring high/low or medium/medium should be examined to see if selective investment should be made to increase earnings.
History, Context, Criticism, and Development
This tool was developed (by the American coporation GE) soon after the Boston Matrix as a result of inadequacies with it. It was typical of several methods of “multi-factor portfolio models” which were developed at the time. (There is some suggestion, incidentally, that the term “directional policy matrix,” originally belonged to a tool developed by oil giant Shell which compared “prospects for sector profitability” against “competitive capability”.) The original GE matrix used the market attractiveness and business strength factors which are listed on the next page. GE used these factors because they believed that, taken together, they had the most influence on return on investment in their industry. However, this list should be modified for each company according to its own particular circumstances.
| Factors of market attractiveness and business strength used in the original GE matrix | |
| Market attractiveness | Business strength |
| Size
Growth rates Competitive intensity Profitability Technology impacts Social impacts Environmental impacts Legal impacts Human impacts | Size
Growth rate Market share Profitability Margins Technology position Strengths and weaknesses Image Environmental impact Management |
The fact that this concept uses several dimensions to assess business units instead of two, and that it is based on ROI rather than cash flow, makes it a different, and probably better tool than the Boston Matrix. However it is criticized because:
(i) It offers only broad strategy guidelines with no indication as to precisely what needs to be done to achieve strategy.
(ii) There is no indication of how to weight the scoring of market attractiveness and business strengths. As such it is highly subjective.
(iii) Evaluation of the scoring is also subjective.
(iv) The technique is more complex than the Boston Matrix and requires much more extensive data gathering.
(v) The approach does not take account of inter-relationships between business units.
(vi) It is not supported by empirical research or evidence. For instance there does not seem to be evidence that market attractiveness and business position are related to ROI.
(vii) It pays little attention to business environment.
Voices and Further Reading
- McDonald, M.H.B. and Wilson, H., “Marketing Plans: How to prepare them, how to use them” John Wiley and Sons Ltd, 2011.
- McDonald, M.H.B., “Some methodological comments on the directional policy matrix” Journal of Marketing Management, 6, 1990.
- “The first time managers try using the directional policy matrix, they frequently find that the circles do not come out where expected. One possible reason for this is a misunderstanding concerning the use of market attractiveness factors. Please remember, you will be most concerned about the potential for growth in volume, growth in profit, and so on for your organization in each of your markets.” McDonald, ibid.
- Wilson, M.S. et al, “Strategic marketing management” Butterworth-Heinemann, 1992.
- Johnson, G. and Scholes, K., “Exploring Corporate Strategy, Prentice Hall, 2002.
- “This portfolio logic is about understanding the relative strength of a business in the context of its markets so as to make decisions about investment, acquisition and divestment”. Johnson and Scholes, ibid.
- Kotler, P. “Principles of marketing.” Pearson, 2005.
- “… these approaches focus on classifying current businesses but provide little advice for future planning. Management must still rely on its judgement to set the business objectives … ”, Kotler, ibid.
Things You Might Like to Consider
(i) This is really powerful as a tool to reach consensus amongst a group of leaders. The definition of business units, the agreement of common criteria and, particularly, the joint scoring exercise stimulate debate which is very valuable. So it is particularly useful in organizations where leadership seeks consensus such as professional partnerships, and some cultures, such as Swedish corporations.
(ii) A major decision in the process of using this tool is the degree to which leaders will be involved in the detail of its construction. Too little involvement means that they will criticize the criteria and scoring; too much and their patience will be tried. This, more than the tool itself, determines the success or failure of any attempt to use it.
Russell Reynolds Associates Hunts in Sectors
Russell Reynolds Associates is one of the world’s leading international executive search firms. Founded in the latter half of the 20th century (1969), it specializes in finding executives for the top jobs of leading companies. It has 31 offices around the world and more than 40 specialist practice areas.
Historically, the firm had grown by the creation of local geographic offices as teams in major cities established and developed client relationships. However, like other professional services firms, the partners found that clients tended to come back to search consultants who had expertise in their industry sector. Also, as searches became increasingly international, clients valued search consultants who knew their industry sector (and key individuals within it) more than a local geography. So they naturally grew specialties in certain industry sectors such as “investment banking”, “technology”, and “consumer products”.
Debate grew within the firm about how to prioritize opportunities and where to invest. How should the firm decide whether “global telecommunications” had more potential than, say “consumer products” or geographies such as the newly liberated Eastern European markets? Where should the leadership team invest partners, staff, and marketing programmes? What was the mechanism by which scarce resources would be allocated?
By the mid 1990s the firm had reached the point where it needed to reach a consensus on how to prioritize the approach to industry sectors. It decided to use the GE/McKinsey matrix as a tool to structure its thinking.
The first step was to define each industry sector, something which the firm hadn’t done before. Partners were surprised by two things: the actual number of claimed industry specialisms and the difference in the understanding of what comprised such sectors. The discussion among the industry leaders in the firm revealed differences about which clients would belong to which sector. After debate, the group produced an agreed, defined list of the main sectors.
Lead partners then began to consider the criteria which made any of those markets attractive to them. The technique required the group to produce a clear, ranked, and graded set of criteria. Again, this was a very useful debate because it helped to make explicit different assumptions by partners about what made the markets attractive. The debate produced criteria about what made a market attractive to the firm – these had previously been unarticulated and diverse.
The final list included criteria such as “potential growth”, “client size”, “ability to earn fees”, and “sector turbulence”. Once the criteria were agreed, each was then rated out of 10 to produce a prioritized list.
The next step was to decide what characteristics make a practice (whether belonging to Russell Reynolds or its competitors) strong in each of the markets. After debate, the final criteria included: “brand strength”, “dominance in sector”, and “partner expertise”. As with market criteria, the final list was ranked out of 10.
The industry leaders then ranked each practice against those criteria. So, for example, the industry leader for investment banking (the firm’s strongest practice) was asked to indicate how the practice stood against each of those criteria by giving marks out of 10. By multiplying each practice’s score against the criteria score, a plot on a matrix was produced. Once all the practices were plotted, a final matrix, shown in Figure D.4 above, was agreed.
Figure D.4 Directional policy matrix
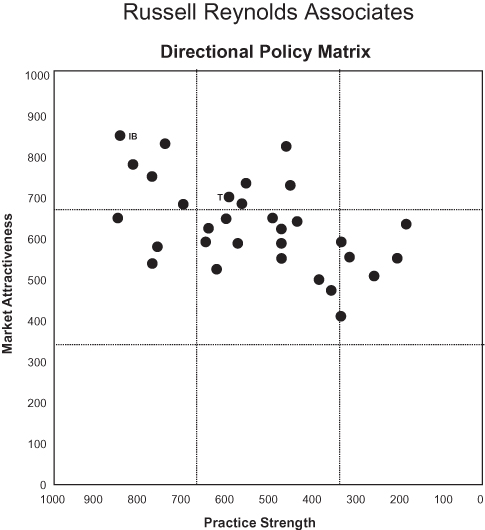
The final matrix proved to be a useful basis for debate and decisions. Investment strategies were naturally discussed and agreed by the group. For instance, at the time, the technology practice was seen to be in a highly attractive market but it was weaker than investment banking. The group therefore decided to invest partners, staff, and marketing programmes in it. Other, less attractive areas were denied funding or had resources depleted.
The power of the exercise was the use of the tool to generate debate among the leaders of the sectors and to reach consensus about investment strategy. As each practice was ranked, colleagues challenged their peers and reached a workable consensus.
![]() RATING: Practical and powerful
RATING: Practical and powerful