
![]() MARKETING MEASUREMENT
MARKETING MEASUREMENT
Application: Control, Tracking, Planning
The Concept
This is another controversial, extensive, and important field that it is difficult to do justice to in this format. Marketers undoubtedly need to set up mechanisms whereby they can gain an indication of the effectiveness of their work. There have, though, been some idiotic concepts promulgated as to how they should do that and there remains extensive confusion. The balance of judgement about the most simple of measures, revenue generated, shows how difficult it is to reach a sensible, professional perspective of marketing measurement.
When a new campaign is launched it is, in many environments, relatively easy to track the leads passed to the sales force. So, it should at least be possible to set up a measure of “leads generated” and then to analyse how many turn into sales. There are though a number of considerations which make this crude measure only an indication of success. For instance, the campaign may follow a number of other campaigns and be reaping the momentum of that former investment. Or it may be part of a powerful brand franchise, building its worth on the heritage of brand equity. And what about those sales that the sales force closed? How many were stimulated by this campaign and not by the sales person themselves? How many opportunities were lost because warm leads were passed to hopelessly inadequate sales people who were unable to close? Whereas purists, academics, and large companies might be able to invest in large tracking surveys or to isolate a number of fascinating variables, life and time is normally far too short for the average marketing manager in the average real company. Most normally have to agree with their own line management sensible mechanisms to give an indication of success and, frankly, after nearly a hundred years of obscure “marketing science” or dubious proprietary tools or concepts, there is probably not much wrong with that.
One really good writer on this subject, Tim Ambler (see Ambler, T., 2003), suggests three criteria for assessing marketing effectiveness: internal expectation, external comparison, and adjustments to brand equity. In reality, marketers seem to measure through several broad categories:
(i) Financial measures
The first and most important is some form of financial measure like revenue, price maintenance, margin, or projected sales volume resulting from marketing activities. This is so simple and obvious that it is often neglected. A surprising number of smart people in even the largest companies do not step back and analyse revenue trends or sources of profit. Too many believe their customers to be at different levels than they actually are and far too many are blinded by accepted myths. It is possible for new customers to be more profitable than existing customers and it is possible that large repeat customers are unprofitable. It is also possible to form a judgement of the cost-effectiveness of certain projects. People also measure: sales volume, sales value, gross revenue, net revenue (i.e. gross revenue less marketing and sales costs), investment, profit, and cost. Yet nearly all specialists in this field have horror stories of marketing managers neglecting the simplest of financial measures. This really ought to be put in place before esoteric tracking programmes are set up.
(ii) Market-based measures
These have to be gained through a reliable research mechanism. They might include: customer value, total number of customers, contribution per customer, share of wallet, satisfaction, propensity to buy again, complaint levels and intensity, and price inelasticity. They might also include mechanisms to measure brand equity, such as: unprompted awareness, prompted awareness, loyalty, lifestyle adoption, and image.
Customer equity is a growing category of market-based measures. It includes: profit per customer, perceived quality, perceived value for money, customer acquisition, visits to new customers, cost per acquisition, contacts before purchases, and life-time value of customers.
Product innovation can be a market-based measure (rather than an internal investment measure). It might include: number of new offers, number of successful launches, average speed of market acceptance, number of competitor imitations, and investment spend in R&D.
Effectiveness of marketing communications might include: share of voice, response, recall, category share. One common way of measuring the effect of marketing campaigns is by having “quiet areas”. These are geographic areas where no marketing is undertaken. They are compared against revenues in areas where programmes impact. As the – rather surprising – case study shows, this is not entirely new!
(iii) Internal performance measures
The firm’s own operational performance measures can be used to judge the effect of marketing. The marketer can set measures of the progress of marketing tasks and measure marketing output (articles published, conferences spoken at, etc.).
Approaches to the management of marketing measurement inside modern companies seem to include:
(i) Cascade management systems
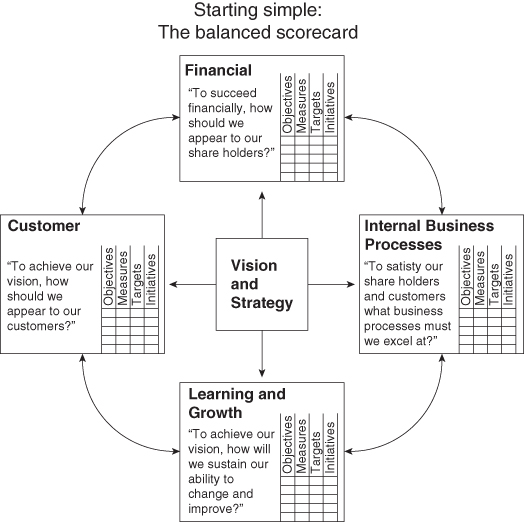
These align internal management thinking across a firm in common values, objectives, and aims. The simplest is probably KPIs (key performance indicators). These prompt each level of management to identify performance indicators and success measures relevant for their work. They normally work alongside some form of management by objectives. These are so simple and obvious that they are sometimes taken for granted by marketers. They remain, nonetheless, very effective and practical methods of reaching a view on the effectiveness of the marketing operation. A recent, and famous, cascade system is Kaplan and Norton’s “balanced score card” (see Figure M.7). This is not normally exclusive to marketing but embraces the whole company; wherein lies it power. It is particularly useful to marketing and sales because “customers” is one of the areas of focus introduced at all levels of the company.
Figure M.7 A representation of Kaplan and Norton’s balanced scorecard
(ii) “Dashboards”
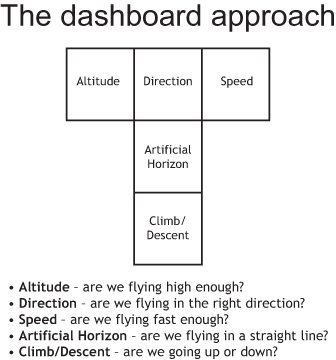
Setting up mechanisms whereby key metrics are available, often in a cascade system, to different levels of marketing management (see Figure M.8). These are blunt instruments which can be questionable and dangerous across large international organizations because they aim to provide one inflexible and consistent view. They are unlikely to allow for local, regional differences.
Figure M.8 Dashboard’s in marketing measurement
(iii) Benchmarking
This is the use of external surveys to measure marketing effectiveness. These might be specially commissioned membership surveys, wherein members subscribe and have anonymous comparative data. Or they may be an externally constructed reporting system.
(iv) Research
Some of the most interesting measures are research-based. It is possible to establish research programmes which track changes in the attitudes and intentions of buyers. An ongoing survey which takes, for example, a small monthly sample can build up useful trend data. Key issues to track are: brand strength, competitive reputation, propensity to refer, and propensity to purchase. For instance, one market-based measure is “test” marketing. Groups of customers are either invited to a group discussion or are subject to a small trial run. Response or attitude changes are then assessed.
Tim Ambler reported that his research showed that company’s marketing measurement went through phases of development: first they were unaware, then they started to use financial measure. After a while, they grew to understand that financial measures were not enough and reached for a diversity of measures from different departments. This, however, led to confusion. Most then reached for some form of market-based measure, streamlining financial and non-financial measures into one coherent system. Finally, they adopted some form of “scientific method” of assessment such as comparison of trends against a complex database of past and current metrics.
History, Context, Criticism, and Development
At the start of the 20th century John Wanamaker said: “50% of my advertising budget is wasted but I don’t know which 50%” (it has been attributed to several people) and, according to Tim Ambler, at the start of the 21st century the situation has only improved a little. He reported (Ambler, T., 2003) that 63% of the American Marketing Leadership Council were dissatisfied with their marketing performance measurement system and that they were wasting 26% of their spend. So, although nearly a hundred years’ research, trial, error, and investment has improved the experience of the best by 100%, there is still a long way to go in understanding the effectiveness and value of marketing activities. There is much further to go in convincing business leaders and financial directors.
During that period marketers and marketing academics have tried various mechanisms to measure the effect and return of marketing. So much so that the Wanamaker comment need no longer apply because there are many ways to get a view on effectiveness. If the marketer is willing to invest time, thought, and effort in progressively developing the necessary processes and systems, satisfactory measures can be set up.
Voices and Further Reading
- Ambler, T., Marketing and the Bottom Line. 2003 (2nd edn).
- When people talk of the ROI from marketing, they usually mean the profit return after deducting the cost of the campaign: it is return minus investment, not return divided by investment. And, of course, we are considering discretionary marketing activities (the budget) not marketing as a whole. In making this point, one response has been that the ratio is still useful for comparing alternative uses … of the same budget. In fact, if the I is constant, then R-I peaks at the same point R/I does, so the ratio is still redundant at best and possibly misleading because the immediate reaction to a high ratio is the supposition that more investment would produce the same ratio.” Ambler, ibid.
- Shaw, R. and Merrick, D., Marketing Payback. Prentice Hall, 2005.
- “Marketing payback myopia is a common symptom of … structural problems. While most marketers get excited talking about creativity, they get immensely bored when costs and budgets are mentioned; their eyes glaze over and their minds shut down. The limited attention span is also widely reflected in the treatment of costs and budgets in books on marketing. Examples of the amount of space devoted to the assessment and evaluation of marketing costs and budgets in some leading text books is shown in Table 2.1.*” Shaw, ibid.
(*Note: all under 1% except Philip Kotler which was 1.7%.) - Binet, L. and Field, P., Marketing in the Era of Accountability. WARC, 2007. This identifies the marketing practices and metrics that practitioners think truly increase profitability. It draws on key quantitative findings from 880 case studies in the IPA Effectiveness Awards databank in the most comprehensive analysis of the communications process to date. Amongst other things their analysis proves the importance of emotional as opposed to rational communications, the power of “fame” or “buzz” for a brand, and the increased effectiveness of multi-media campaigns.
- Doyle, P., Value Based Marketing. John Wiley & Sons Ltd, 2000.
- How Share of Voice Wins Share of Market, published by IPA 2009. Central to a successful campaign is setting the right media budget in the first place. This study by the IPA and Nielsen Analytic Consulting shows that share of voice continues to drive brand growth, and without investment here, innovation in media and creativity is wasted. The report indicates that an average fmcg (fast moving consumer goods) campaign for an average brand can be expected to deliver market share growth of 0.5 percentage points for every 10 points of “extra” share of voice (ESOV), where extra share of voice equals the difference between share of voice and share of market. Brands that allow their share of voice to fall below their share of market lose market share in the same proportion. So, any marketer setting goals for their brand must take this into account. Similarly any agency entering into a remuneration agreement involving an element of payment by results needs to ensure that the KPIs are actually achievable on the budget set for the brand. The data also highlights the importance of the quality of advertising alongside the quantity of advertising. Comparison between Nielsen data and data from proven highly effective campaigns in the IPA Databank of IPA Effectiveness Awards cases shows that IPA-grade campaigns are on average about 60% more effective than the “typical” fmcg campaigns in the Nielsen sample. The implication here is that clients can “beat the system” by investing in top quality agency work.
- Farris, P.W., Bendle, N.T., and Reibstein, D.J., Marketing Metrics. Wharton School Publishing, 2006.
- Kaplan, R.S. and Norton, D.P., The Balanced Scorecard. Harvard Business School Press, 1996.
- Reicheld, F.F., “The only number you need to grow”. Harvard Business Review. December, 2003.
- “Unfortunately, most accounting systems do not measure what drives customer value.” Reicheld, ibid.
- Shaw, R., “Net promoter”. Journal of Database Marketing and Customer Strategy Management, August 2008. A devastating and forensic analysis of this faddish measure by a marketing professor who started as a PhD mathematician.
- “The need for common metrics becomes more critical as marketing becomes more embedded in the sales process … Sales metrics are easier to define and track. Some of the most common measures are percent of sales quota achieved, number of new customers, number of sales closing, average gross profit per customer and sales expense to total sales … But how then should the company evaluate the upstream marketers? On the basis of the accuracy of their product forecasting, or the number of new market segments they discover? The metrics will vary according to the type of marketing job.” Kotler, P., Rackham, N., and Krishnaswamy, S., 2006.
- “Beware of make-believe marketing metrics … On the boards that I sit on I have always argued that we should carefully review marketing metrics such as customer satisfaction, brand equity, and customer loyalty.” Kumar, N., 2004.
Things You Might Like to Consider
(i) It really is possible to set up satisfactory measures of most marketing activities if time is taken to think through what is needed and to invest and test. These measures should be enough to get an operational judgment even though they would not be “scientific” to purists.
(ii) Tracking surveys are the most widely used and, probably, some of the least useful mechanisms used by marketers.
(iii) “ROI” is one of the most widely used and devalued terms in discussions about marketing budgets. Marketing is, in most cases, a current account cost, not an investment. The judgement is whether the expense of these tasks is effective operationally. Physical assets like a CRM system or intangible assets like brand are investments and can be subject to DCF analysis, comparing their internal rate of return against other assets. To continually and casually refer to the ROI on marketing campaigns is sloppy.
(iv) A recent, dubious, idea that has been suggested is ROMI (return on marketing investment). There are several difficulties with this. Firstly, it is, as Robert Shaw points out, often muddled with ROCE (return on marketing expenditure). Secondly, marketing is normally an expense of business not an investment, so it is inappropriate to look for an ROI measure. Thirdly, the technique suggests understanding a “base line of sales” that would exist without marketing, a virtually impossible task in many situations. Finally, it is often difficult to isolate other effects of campaigns in the way purists suggest.
(v) Another relatively recent concept, and another dubious idea, is linked to the “shareholder value” concept: value-based marketing. The concept of shareholder value rose in the late 20th century and was promulgated as a mechanism to align management action with the levers inside a company that influence the value of its shares (such as “cost of capital”). Value-based marketing is an attempt to align the actions of marketing to these mechanisms. It is argued by some accountants, for instance, that “brand equity” and “customer equity” are important influences on share value. There have, though, been a number of criticisms of shareholder value (most harshly from Jack Welch, ex CEO of GE). One is that it is too narrow a focus; prompting some, in continental Europe, for instance, to concentrate on “stakeholder value”. The most obvious fault is, though, that there are many other determinants of share value than the internal actions of management. Linking marketing success to shareholder value may be useful if the company is obsessed with this approach but it is unlikely to be credible in the long term.
(vi) Clearly marketing needs to be measured in different time scales. Activities aimed at creating customer awareness or building brand equity will have longer term effects than a campaign aimed at immediate quarterly sales stimulation.
(vii) Digital marketing gives a dangerous appearance of precise measures. It can be easy to track, for instance, the number of visits to a web site or “stickiness” (the amount of time people spend there). Yet how far do these measures reflect buying behaviour and relate to items purchased?
(viii) PR is a discipline which has specific measures which have been developed in their professional silo. There have been various attempts at conceptual work related to PR effectiveness and evaluation, such as: Cutlip’s PII model (1985), Watson’s continuing model (1997), Watson’s unified model (1999), the IPR “pre” model (2001), Lindeman’s PR yardstick (1993), the pyramid model (1992, 2000). Specialists tend to discuss and track the advising equivalent effect of their work. Again, it’s a matter of seasoned judgement (particularly when deciding how much budget to allocate between different media based on previous successes) as to how credible these different indicators of effectiveness actually are.
(ix) How much should you go native? Although it is professional to have some form of sensible indicator, there is a case for marketers not to get too anal, precise, financial, and pedantic about their work. There is no doubt that certain aspects of marketing (such as brand, synergistic impact, herd behaviour of markets, and creative appeal) are hard to summarize or capture in precise financial or operational measures. Sensible leaders and CFOs understand that and are willing to discuss pragmatic indicators of effect and return.
(x) Since the advent of the discussions on loyalty many companies have investigated and adopted Fredrick Reicheld’s recommended “net promoter” measure (see Reicheld, F.F., 2003). This is an adaptation of word-of-mouth tracking measures and the propensity of customers to refer their contacts to the product or service. So it should be, in most circumstances, a powerful indicator of satisfaction and growth potential. There are, though, a number of strategic issues which need to be addressed in loyalty management and it is far from a panacea (see separate entry on loyalty). There are also a number of doubters and sceptics about the basis of some of the claims and applicability of this measure (see Ambler, T., 2003 and Shaw, R., 2008). It seems most applicable to areas where word-of-mouth and personal recommendation play an important part in growth.
(xi) There are some very effective measures to indicate and improve customer satisfaction. See the introduction to SERVQUAL under the GAP model entry, for instance, or the description of the public tracking measures under service quality. This is the marketer’s province because it affects repurchase intent. Very poor customer service undermines any marketing claims and damages brand equity. At the same time, many of the impromptu satisfaction surveys, such as written sheets left in hotel rooms, ask the wrong questions inadequately. Satisfaction measures are likely to only reveal future buying intent if properly configured. There are several types of these measures that are important to understand and have in place in order to manage ongoing customer satisfaction. They are:
Event driven feedback. These are sometimes called “transaction surveys”, because they follow a specific transaction between the supplier and its customer. This is feedback from the buyer in response to a specific event or project (a completed consultancy project, for example, or the installation of a new home service). These feedback mechanisms can either be through some form of questionnaire or response to a telephone survey. Their purpose is to capture the customers’ views of their specific experience while it is fresh in their mind. It is therefore important to gather customers’ responses as soon after the transaction as possible. The surveys need to be carefully designed using experienced researchers. If not, they are likely to reflect the wrong views and mislead the company. They need to be carefully administered and sent to the correct people. (More suppliers than would admit send these to anonymous departments or invoicing addresses.) The firm should keep careful records and undertake trend analysis as an input to its strategic direction.
Generic perception studies. These are research projects undertaken on a regular basis in order to understand the general view that different groups of buyers have about a supplier. Frequency of surveys varies according to volume (some might be monthly, some might be annual). Quite often suppliers will carry out a number of surveys each month and then have either a quarterly or annual summary of trends. Techniques for conducting this research vary although many suppliers have used conjoint research because it yields powerful insights into changing customer views of different aspects of service. These are very different in style, purpose, and design to event driven research. They are frequently conducted by independent research companies using independent sampling techniques. The aim is to get a generic view of the firm’s service performance which can then be compared to the trends in event driven measures.
Internal measures. Firms should establish internal measures of service quality (percentage of projects completed to predicted time scales, for instance). These should be prioritized around customer need and the leadership’s objectives. They should be communicated to all, set as individual objectives for each executive and used as a basis for reward. However, they should also be compared with external measures to identify any gaps. If, for instance, a firm’s internal measures show excellent performance in an area that customers criticize there are two possible solutions. Either internal results are distorted and need adjustment or customer perception needs to be changed through marketing communication.
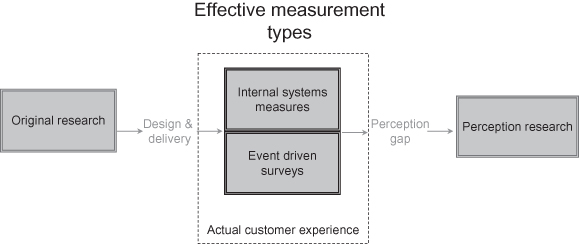
Stone and Young (1994) proposed the following method of drawing these elements together as an ongoing management system of satisfaction measurement.
Figure M.9 A structure for satisfaction measurement
Marketing measurement in the Edo period of Japan
Mitsukoshi is a famous Japanese department store in Japan founded as a Kimono shop in the seventeenth century. It claims to be the first retailer in the world to have implemented one-price selling (with its then slogan “Cash sales at fixed prices”). In doing so it repositioned its offer, making a luxury item available to a wider range of Japanese shoppers. Yet that is not the extent of their marketing.
In cities like Edo and Osaka merchants competed with each other using display signs and door-to-door sales. One of their most powerful marketing tools was “hikifuda”; exquisitely painted hand bills. Many of these were created by artists like Santo Kyoden, who have since become prized famous artists (advertising, as ever, supporting artists in their early career).
According to Japan’s museum of advertising and marketing, early versions were copied by woodblock cutting and stuck into every gateway in town. Upmarket advertisers, by contrast, handed the beautiful sheets “only to valued customers and neighbourhood leaders”. These folk, in turn, were counted on to disseminate the information by word-of-mouth; an early use of viral marketing.
What is startling is the focus on mass advertising and the sophistication of their understanding of its effect. Advertising was routinely used for products like toothpaste, clothing, smoking accessories, and sake (see Pollock, D., 1995). The same copy was used in different media such as hand bills, signs, stories, and theatre, a deliberate attempt at integrated marketing communication.
Mitsukoshi’s founders, though, demonstrated why they had the marketing skills to create and nurture a 300-year-old brand. According to Toshio Yamaki (Tokyo University) and Kikuko Fukatsu (University of Iowa) (see Yamaki, T. and Fukatsu, K., 1995) they handed out around 500,000 hikifuda in April of 1673 when they opened a new store and measured a 60% return on revenue by having no advertising at all for another store, to get comparative data. Just over a hundred years later (1794) they were still measuring the effects of advertising on both sales and profits in their Osaka store, and reported the cost of advertising as 4.5% of total sales. There are advertisers today who are not as measured.