
![]() POSITIONING
POSITIONING
Application: Strategy Development, Competitive Strategy
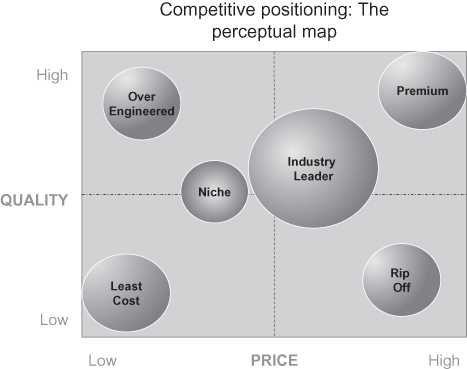
Figure P.3: A generic perceptual map of a market to indicate positioning
Adapted from Lambin’s Figure 6.12, 2000
The Concept
The “position” of a businesses in a market is based on buyers’ perceptions of the value of its offer. By gaining and holding a clear position in a market, a firm can maximize its margins and create a long-term sustainable competitive stance. “Perceptual maps” are used by marketers in many different businesses to determine market position, set strategy, and gain insight. By understanding and ranking the buyers’ views of all the significant offers, marketers can deduce and set direction for their own offer. The diagram above (adapted from Lambin, J., 2000) is a generic “perceptual” map of buyer views (“perceptual” because it concentrates on their perceptions of value). The tool is best constructed using detailed conjoint research amongst representatives of all buyers in the market and by understanding their values (see value propositions). It uses two axes (quality and price) which together form buyers’ views of value (i.e. value f price x quality).
The “market leader” (like IBM, BA, Microsoft, and Centrica) normally takes centre stage with the offer by which all are judged. It has dominant share and the ability to influence the rules of engagement in the total market. It sets the price/quality expectations and has the power to change the whole market. The market leader serves the majority of buyers and, as a result, sets both price expectations and service standards for the whole market. A “follower” (like Fujitsu, or Scottish Power) is smaller than the market leader and able to earn a profitable existence by providing a healthy alternative either in terms of price or the mix of features.
The “premium” position (normally a heritage brand like Rolls Royce or Harrods) is taken by a features-rich offer at a high price, whilst the “least cost” supplier (Easyjet, Ryan Air, Costcutter, etc.) strips out all that is possible to achieve low price. Various niche providers (like Virgin Atlantic) set themselves against the market leader and survive by providing a different offer. Each company, either by design or default, eventually commands its own position in a market by serving one group of customers with a particular value proposition.
There are two unsustainable positions. The “rip off” has low quality at high price. It normally exists because of some distortion or recent trauma in the market. However, it cannot keep this position in the long term because buyers will compare offers and desert it for other suppliers with an offer nearer to their values. The “over engineered” supplier might be a naïve new entrant or a recently privatized or de-monopolized supplier. Again it must move in the long term.
The perceptual map can be used in several ways.
(i) Strategy development
The tool can be used to create both corporate and competitive strategy. The leadership can use it to reach consensus on the position that they want the firm to take in the market. It is therefore a very powerful input to strategy debate amongst leadership teams. For instance, the leadership may find that, through acquisition, their company can become the volume market leader of an industry. However, to maintain that position, it must adopt the behaviour of a market leader, taking a stance on price, quality, and leading industry issues. Alternatively, a firm might find that it can maximize margins by taking a position as a niche provider. In this case it needs to determine exactly how its offer will be different from the market leader, communicating that to buyers. Marketers can work out where the target buyers’ values lie and move the firm’s offer towards them. “Positioning” the firm in this way, is a guide for NPD and NSD policy.
(ii) Communication planning
This tool can also leads communication and marketing programmes. It gives real direction to message planning and creative content.
(iii) Forecasting
Perceptual maps can also be used to determine the number of buyers the firm should expect and what the value proposition should be. The customer insights around value perceptions can take forecasting beyond mere statistical modelling based on historic data.
(iv) Competitive strategy
These perceptual maps can also be used to understand competitive forces (the likely manoeuvres of other businesses in the market) and to work out competitive strategy. Markets are not static. It is dangerous, for example, for the market leader to assume its position is inviolable, since niche providers can progressively capture segments of the market and mount a challenge for leadership. Or a follower, which finds itself number two in a market with a vulnerable market leader, might decide to mount a challenge. So this tool can be used to anticipate the likely reaction of competitors when the firm makes any move. It is a powerful strategic insight, which can clarify strategic intent and give real focus to marketing programmes.
(v) Internal communication and training
The tool can also be used as an internal communication aid. Firstly, it is a very simple and clear summary of the market and the firm’s ambitions which can be used effectively in internal meetings. Secondly, it can be used as a diagnostic tool to develop internal communications programmes. By using it as a basis for internal research of employee opinion, it can be contrasted against customers’ views. Training and communications programmes can then be designed to address any gap in view. Finally, and particularly important to service firms, is the fact that a clear position communicates to the recruitment market, attracting the right calibre of service employees; this, in turn, enhances quality and margins.
History, Context, Criticism, and Development
Positioning has been a recognized technique since the 1960s. In practice it is closely related to both brand and segmentation strategies. Consumer marketers have used it to command a space for their offers in retail environments and in the mind of their consumers. Towards the end of the 20th century it was increasingly applied to corporate brands and to service offers. At the start of the 21st century, though, it has taken on a more subtle tone as global audiences have become more demanding on social issues and responsiveness. Marketers have increasingly had to think about positioning their company or their offers in line with the values of both their buyers and their employees.
Voices and Further Reading
- “Market leaders develop unique competitive strategies and have higher prices for their higher-quality products than do small-share businesses.” Buzzell, R.D., Bradley, T.G., and Sultan, R.G.M., 1975 (reporting the results of the first years of the PIMS database).
- Taylor, D. and Nichols, D., “Brands as market leaders”. Market Leader, Quarter 2, 2010.
- “The positioning in the target segment can be crafted in numerous ways. The company can be positioned as a ‘hero for the poor’ or as a company ‘that teaches people how to fish instead of giving them free fish’. The main message is the same … if it is a multinational company; the positioning should be localized to the community level.” Kotler, P. et al., 2010.
- “Positioning is about developing a unique selling proposition (USP) for the target segment. … the inability to do so results in either a price negotiation with the customer or a loss of a sale.” Kumar, N., 2004.
- “Product positioning refers to the perceptions customers have about the product. It is a relative term that describes customer perceptions of the product’s position in the market relative to rival products. It is founded upon understanding how customers discriminate between alternative products and it considers the factors customers use in making judgments or choices between products in the market being investigated.” Trott, P., 2008.
- “In many cases, consumers use a few basic dimensions to categorize competing products or services, and then evaluate each alternative in terms of its relative standing on these dimensions. This tendency has led to the use of a very useful positioning tool – a perceptual map. By identifying the important dimensions and then asking consumers to place competitors within this space, marketers can answer some crucial strategic questions …” Solomon, M. et al., 2006.
- Tybout, A.M. and Sternthal, B., “Brand Positioning” in Iacobucci, D. (ed.), Kellogg on Marketing. 2001.
Things You Might Like to Consider
(i) This is critically dependant on effective segmentation. It is quite normal for marketers to have different positioning maps for different segments in different markets. This is very powerful when idiotic competitors are taking bland generic approaches to a market. It is relatively easy to gain a prominent position by dominating a segment at a time.
(ii) In reality, the two axes used in most companies’ work are often a derivative of critical issues or success factors in the market. They are normally issues which are uppermost in the minds of most buyers rather than generic indicators of quality and value.
(iii) There is a clear inter-relationship between good segmentation, targeting that segment and positioning the offer to them; which is the foundation of many marketing programmes. Some use the mnemonic “STP” (segmentation, targeting, positioning) to prompt thinking around the clarity of it in planning cycles.
(iv) This technique is dependent on getting an understanding of buyers’ perceptions, sometimes a very difficult task which is progressive. It can be misleading and dangerous until a reliable view of perception can be formed. Refusal to invest in research methods to get at perception undermines this important strategic perspective.
The Accountants Position Themselves
The UK market for insolvency services illustrates how useful value maps can be in alerting firms to potential dangers. This is a sophisticated processional services market which focuses on helping businesses or individuals to avoid bankruptcy or getting the best return for creditors if problems are irresolvable.
In the 1990s the market was divided between the big firms and boutiques dedicated to insolvency practices at the higher end; and individual practitioners who dealt with the lower end of the market (about 40%).
The big accountancy firms had become accustomed to being given insolvency business from the leading banks, which dealt with problems in companies to which they had lent money. These banks tended to use a virtual rotation system, choosing partners from an approved list of firms to lead assignments. Larger insolvencies went to the bigger firms (either because of perceived complexity or international reach), whereas boutiques tended to be awarded smaller, more price-sensitive jobs.
But the market was changing. First, many of the banks had changed their strategy and had a “cleaner” lending portfolio than previously. Secondly, there was a growing emphasis on turnaround, requiring different management skills. Thirdly, there were new lenders entering the market, both foreign banks and “asset- based lenders” who were not so tied to traditional suppliers. In addition, a new insolvency law was mooted which would change the responsibility for choosing an insolvency firm, swinging the influence on the buying decision away from the large, highly centralized banks towards their smaller, often regionally-based clients.
All these factors would disrupt this tidy market and change behaviour. The barrier between the big firms and the individual practitioners would begin to disappear. This, in turn, would mean that they could no longer be complacent about business and would have to find ways to market to this new audience. The perceptual map, if constructed using client data, would give insight into market conditions and help to chart a course through the changes.
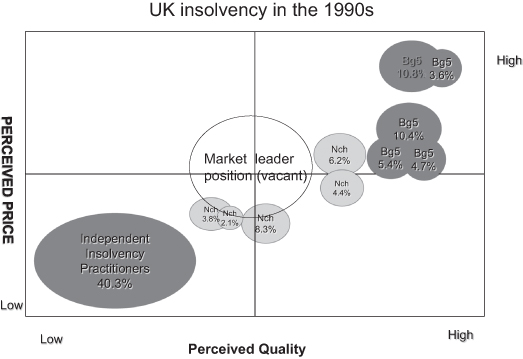
For instance, at least two of the then “Big Five” firms claimed to be market leader, but analysis showed they were not. Based on the perceptual map in Figure P.4 below, once the semi-monopolistic distortion was removed from the market, a new market leader would emerge, threatening the position of the bigger firms. It could move into this position by increasing its volume through finding a new value proposition. Alternatively, one of the niche providers could take a more dominant position because they were nearer to market pricing expectations and more in tune with the new buyers emerging in the market.
Figure P.4: The UK insolvency market in the 1990s
![]() RATING: Practical and powerful
RATING: Practical and powerful