
The design behind the UWP architecture has been established so that your app can easily be deployed to any device that runs Windows 10. There may be some minor customizations needed depending on the capabilities that various platforms offer, but UWP will not limit you unnecessarily. As a reader of this book though, you are probably developing your UWP on a traditional computer that most likely has a keyboard and a mouse. While this is great for development (and usually, a keyboard is a needed component), this means that your workstation doesn't always match what is available to your app's users. Enter the Windows 10 simulator.
The Windows 10 simulator, available under VS2015, provides the ability to run your UWP app in your choice of Debug or Release builds, so that you can see how it runs and appears on a machine outside of your regular development machine configuration.
This recipe will show how to use the simulator to assist in developing your own apps.
For this recipe, you may use a project of your choosing if you have one available, but we are going to use one of Microsoft's publicly provided sample UWP apps for the examples. Specifically, we are going to use the RSSReader app listed at http://microsoft.github.io/windows/. If you are familiar with Git, you may clone the repo, but for brevity, we will just download the project's ZIP file to our machine and open the solution file.
The steps for using the Windows 10 simulator are as follows:
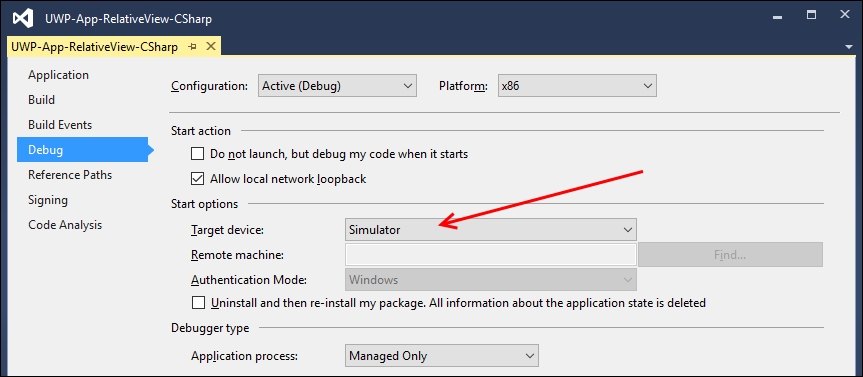
- Go to the properties page of your UWP project (the properties page is available under the Project menu).
- Select the Debug tab, and change the target machine to Simulator, as shown in the following screenshot:
- Start debugging the app by either pressing F5 or navigating to the Debug | Start Debugging menu option.
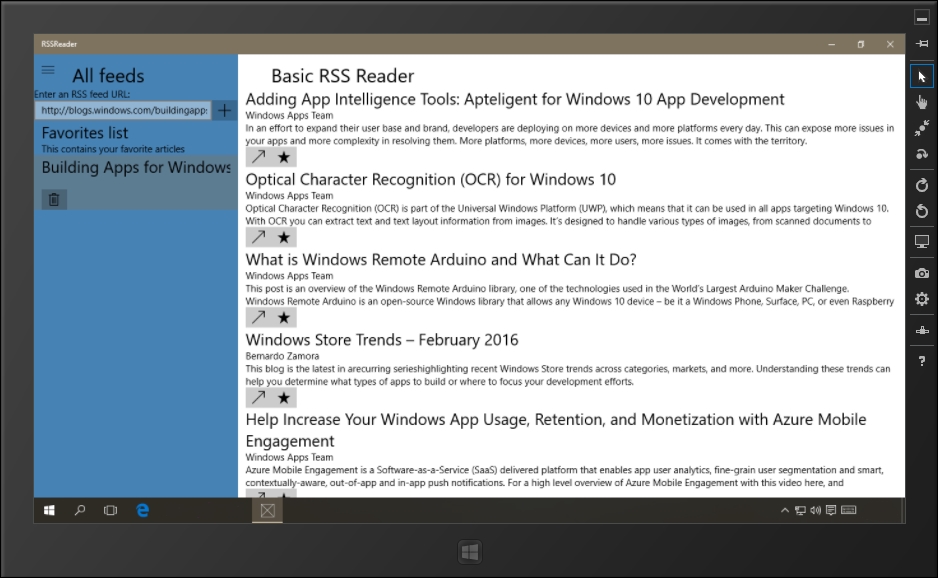
- Visual Studio will start the Windows 10 simulator and launch the app for you, as shown in the following screenshot:

- On the right-hand side of the simulator are a number of icons that control the simulator's behavior. By default, the simulator starts in the mouse mode so that you can navigate within the app using the keyboard and mouse. However, you aren't limited to those methods of input—touch is also available regardless of whether your physical PC supports it.
Note
For reference, the toolbar icon functions are, from top to bottom: Minimize, Always on top, Mouse mode, Basic touch mode, Pinch/Zoom touch mode, Rotation touch mode, Rotate clockwise, Rotate counterclockwise, Change resolution, Copy screenshot, Screenshot settings, Change network properties, and Help.
- With the initial defaults, you can interact directly with the UWP app running. For our example, click on the plus icon to add the default feed. This will add it to this app's favorites, making the article headlines available for reading. Clicking on the hamburger icon (three horizontal lines) in the top-left corner lets you experiment with closing and opening the navigation pane:
- Switch to the basic touch mode by selecting the icon on the simulator toolbar.
- As you move your mouse over the simulator, you will see that the cursor has now changed to a small crosshair in a circle icon.
- You can simulate scroll with touch by left-clicking and dragging upward or downward with your mouse to scroll the content pane. The cursor will change form while you are holding the mouse button to reflect that touch input is being simulated.
- Touch mode is very similar to receiving mouse input, so let's now try some simulator-specific functionality. Click on the Rotate clockwise (90 degrees) icon.
- The simulator will now reflect a change in orientation, as if you had physically turned your tablet clockwise. The following screenshot illustrates this change:

- When the simulator has focus, it will capture the keyboard and handle key combinations such as Alt + Tab or Alt + F4. Close the simulator using Ctrl + Alt + F4. You can stop the debugging process with Shift + F5.
- Now let's see how the simulator works with the debugger. Open the
FeedsArticlesViewModel.csfile, and locate theAddRssFeedmethod. - Set a breakpoint in the
AddRssFeedmethod by either pressing F9 on the declaration, or by clicking in the gutter to the left of the code. This method may be found easily by searching for its name in Quick Find (found approximately at line 229). Once located, set a breakpoint, as shown in the following screenshot:
- Restart the simulator and debug this app by pressing F5. The program will execute until it has two add feeds—so if you have previously added two feeds, it will stop at the breakpoint twice. Resume by clicking on Continue in the IDE or by pressing F5. After the app is fully loaded, try adding another feed, at which point the breakpoint will be immediately hit. Deleting an existing feed and then re-adding it will also demonstrate the effects of the breakpoint.
- Feel free to add breakpoints in other areas of the code to experiment with how the debugger will operate in conjunction with your app.
The Windows 10 app simulator actually connects to your local machine via a remote desktop connection, and this is why the start screen in the simulator looks the same as the start screen on your Windows 10 development machine, and the reason why you are signed in automatically.
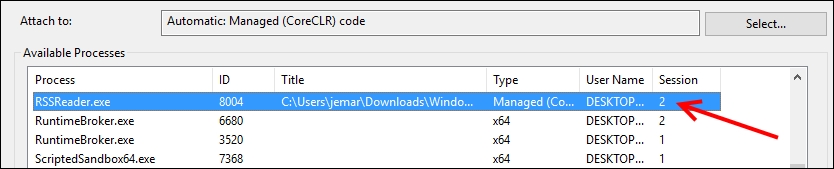
Since it's simply a remote desktop connection running on the local machine, the debugger is simply connecting to a local process running in a different session. If you open the Attach to Process window via the Debug | Attach to Process menu, you can see the details of the process that Visual Studio has connected to.
The following screenshot highlights the details of the running RSSReader.exe executable, and shows that it is in session 2, which is the Windows 10 app simulator session:
There are a few more things to note about the simulator that we didn't touch upon in the recipe, including some items that will make using it much more useful.
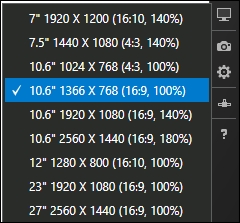
You can adjust the resolution the simulator is running at, allowing you to experience your app at different predefined resolutions and device sizes, as shown in the following screenshot:
Along with changing the resolution, you can also change the onscreen display size of the simulator by dragging the bottom-right corner of the simulator just like a normal desktop window. This can help if you are simulating a device on a high-resolution desktop, and you have the screen real estate to spare. It may also point out areas that are just too small for the end user and require a rework.
This dialog lets you set the simulator to use different network settings than what is actually being used by your development machine. This lets your app react to events such as roaming, data limits, and the cost of the network so that it behaves appropriately if the user is not on a no-limit network connection. A user near their wireless plan limits would be very upset if your app improperly used up all of their bandwidth, or causes them to incur unexpected charges.
Note that the icon on the simulator is titled Change network properties, while the dialog is labeled Set Network Properties.

You may have noticed that when you set the Debug option for using the simulator, there was also an option to use a Remote Machine as the target device. Remote debugging is straightforward under Visual Studio 2015 when developing UWP apps. For the Remote Machine option to work, you need to have Remote Debugging Monitor running on the remote machine; the firewall needs to allow connections, and you need a reasonable network connection between the two machines.
On your development machine, you simply specify the machine name of the remote machine you are targeting, and start debugging. Visual Studio connects to the remote machine, prompts for credentials if required, deploys the app, and connects the remote debugging monitor for you.
From that point forward, the debug experience is almost the same as if it were a local process. As long as you have a stable network connection, you should find the experience very useful.
When you want to take screenshots of your Windows Store apps for creating your store listing, for example, then you can do so via the simulator. Simply click on the copy screenshot button on the toolbar (represented by a camera icon), and the screenshot will be placed on the clipboard, and optionally, in a file on your hard drive. You can control this behavior using the screenshot settings button (represented by a gear icon below the camera icon) on the toolbar.
When a UWP app is running on your development workstation or the simulator, it will of course be saving files and settings on your system in its local storage area. While this is very useful to maintain state between app sessions, while debugging you may find it necessary to run your app as though it has been freshly installed, without any existing settings.
The following start option under the project's properties lets you do this. As a reminder, properties for your project are found in the Properties window located under the Project menu:

Tip
How to find locally stored app data:
When your app uses a StorageFolder object as RSSReader does, it is storing data on the system for which the app is installed. For a Windows 10 system, this information is typically stored under the directory C:UsersUSERNAMEAppDataLocalPackages, where each installed app will have its own subdirectory that is based on its official package name. The app's package name is defined in Package.appxmanifest, and additionally, viewable under the Packaging tab in the manifest editor.