
In Visual Studio 2013, Microsoft debuted a new set of tools called the Performance and Diagnostics hub. With VS2015, these tools have revised further, and in the case of Diagnostic Tools, promoted to a central presence on the main IDE window, and is displayed, by default, during debugging sessions. This is great for us as developers, because now it is easier than ever to troubleshoot and improve our code. In this recipe, we will explore how Diagnostic Tools can be used to explore our code, identify bottlenecks, and analyze memory usage.
The changes didn't stop when VS2015 was released, and succeeding updates to VS2015 have further refined the capabilities of these tools. So for this recipe, ensure that Update 2 has been installed on your copy of VS2015. We will be using Visual Studio Community 2015, but of course, you may use one of the premium editions too.
For this recipe, we will put together a short program that will generate some activity for us to analyze:
- Create a new C# console application, and give it a name of your choice.
- In your project's new
Program.csfile, add the following method, which will generate a large quantity of strings:static List<string> makeStrings() { List<string> stringList = new List<string>(); Random random = new Random(); for (int i = 0; i < 1000000; i++) { string x = "String details: " + (random.Next(1000, 100000)); stringList.Add(x); } return stringList; } - Next, we will add a second static method that produces an SHA256-calculated hash of each string that we generated. This method reads in each string that was previously generated, creates an SHA256 hash for it, and returns the list of computed hashes in hex format:
static List<string> hashStrings(List<string> srcStrings) { List<string> hashedStrings = new List<string>(); SHA256 mySHA256 = SHA256Managed.Create(); StringBuilder hash = new StringBuilder(); foreach (string str in srcStrings) { byte[] srcBytes = mySHA256.ComputeHash(Encoding.UTF8.GetBytes(str), 0, Encoding.UTF8.GetByteCount(str)); foreach (byte theByte in srcBytes) { hash.Append(theByte.ToString("x2")); } hashedStrings.Add(hash.ToString()); hash.Clear(); } mySHA256.Clear(); return hashedStrings; } - After adding these methods, you may be prompted to add
usingstatements forSystem.TextandSystem.Security.Cryptography. These are definitely needed, so go ahead and take Visual Studio's recommendation to have them added. - Now we need to update our
Mainmethod to bring this all together. Update yourMainmethod to contain the following code:static void Main(string[] args) { Console.WriteLine("Ready to create strings"); Console.ReadKey(true); List<string> results = makeStrings(); Console.WriteLine("Ready to Hash " + results.Count() + " strings "); //Console.ReadKey(true); List<string> strings = hashStrings(results); Console.ReadKey(true); } - Before proceeding, build your solution to ensure everything is in working order.
- Now run the application in Debug mode (F5), and watch how our program operates.
- When you first launch the program, you will see the Diagnostic Tools window appear. Its initial display resembles the following screenshot. Thanks to the first
ReadKeymethod, the program will wait for us to proceed, so we can easily see the initial state. Note that CPU usage is minimal, and memory usage holds constant.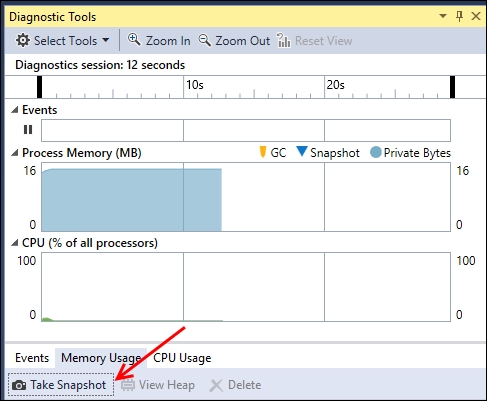
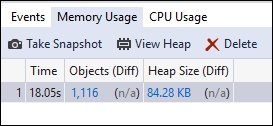
- Before going any further, click on the Memory Usage tab, and then the Take Snapshot command as indicated in the preceding screenshot. This will record the current state of memory usage by our program, and will be a useful comparison point later on. Once a snapshot is taken, your Memory Usage tab should resemble the following screenshot:
- Having a forced pause through our
ReadKey()method is nice, but when working with real-world programs, we will not always have this luxury. Breakpoints are typically used for situations where it is not always possible to wait for user input, so let's take advantage of the program's current state, and set two of them. We will put one to the secondWriteLinemethod, and one to the lastReadKeymethod, as shown in the following screenshot: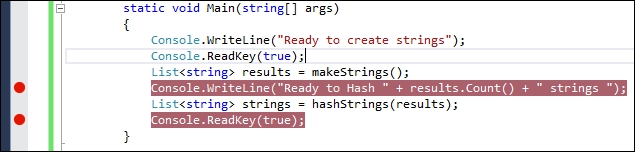
- Now return to the open application window, and press a key so that execution continues.
- The program will stop at the first break point, which is right after it has generated a bunch of strings and added them to our
Listobject. Let's take another snapshot of the memory usage using the same manner given in Step 9. You may also notice that the memory usage displayed in the Process Memory gauge has increased significantly, as shown in this screenshot:
- Now that we have completed our second snapshot, click on Continue in Visual Studio, and proceed to the next breakpoint.
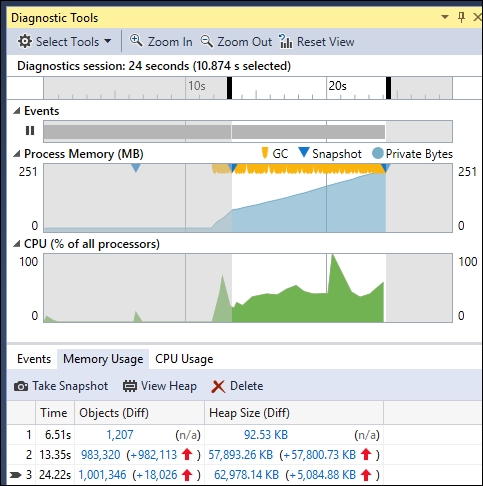
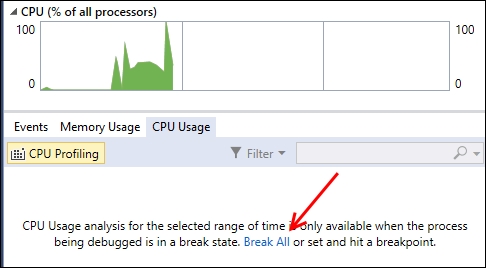
- The program will then calculate hashes for all of the generated strings, and when this has finished, it will stop at our last breakpoint. Take another snapshot of the memory usage. Also take notice of how the CPU usage spiked as the hashes were being calculated:
- Now that we have these three memory snapshots, we will examine how they can help us. You may notice how memory usage increases during execution, especially from the initial snapshot to the second. Click on the second snapshot's object delta, as shown in the following screenshot:

- On clicking, this will open the snapshot details in a new editor window. Click on the Size (Bytes) column to sort by size, and as you may suspect, our List<String> object is indeed the largest object in our program. Of course, given the nature of our sample program, this is fairly obvious, but when dealing with more complex code bases, being able to utilize this type of investigation is very helpful. The following screenshot shows the results of our filter:
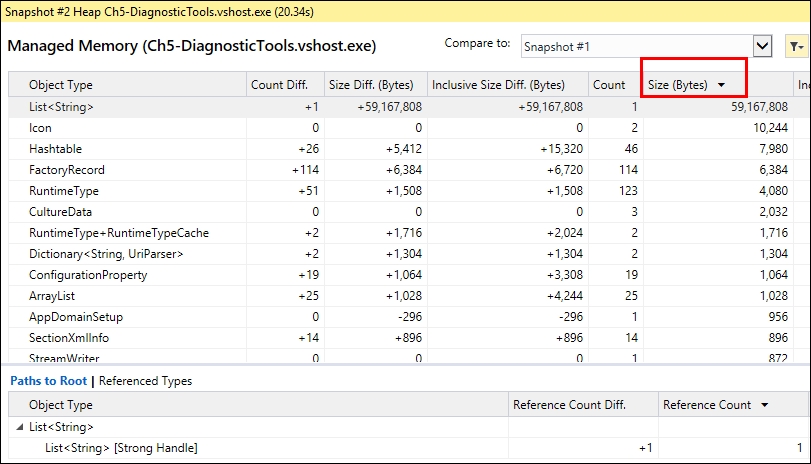
Note
If you would like to know more about the object itself (perhaps there are multiple objects of the same type), you can use the Referenced Types option as indicated in the preceding screenshot. If you would like to try this out on the sample program, be sure to set a smaller number in the
makeStrings()loop, otherwise you will run the risk of overloading your system. - Returning to the main Diagnostic Tools window, we will now examine CPU utilization. While the program is executing the hashes (feel free to restart the debugging session if necessary), you can observe where the program spends most of its time:
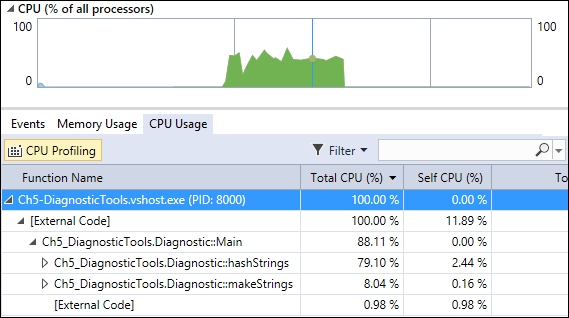
Again, it is probably no surprise that most of the hard work was done in the hashStrings() method. But when dealing with real-world code, it will not always be so obvious where the slowdowns are, and having this type of insight into your program's execution will make it easier to find areas requiring further improvement.
Microsoft wanted more developers to be able to take advantage of their improved technology, so they have increased its availability beyond the Professional and Enterprise editions to also include Community. Running your program within VS2015 with the Diagnostic Tools window open lets you examine your program's performance in great detail.
By using memory snapshots and breakpoints, VS2015 provides you with the tools needed to analyze your program's operation, and determine where you should spend your time making optimizations.
Our sample program does not perform a wide variety of tasks, but of course, more complex programs usually perform well. To further assist with analyzing those programs, there is a third option available to you beyond CPU Usage and Memory Usage: the Events tab. As shown in the following screenshot, the Events tab also provides the ability to search events for interesting (or long-running) activities.

Different event types include file activity, gestures (for touch-based apps), and program modules being loaded or unloaded.