
Chapter 11
QD Theory
Mechanics of Reflected and Diffracted Wave Groups
Abstract
An exceptionally large wave at some distance off a long vertical breakwater, most probably, is due to the collision of two wave groups: one going back seawards after having been reflected and one approaching the breakwater. An exceptionally large wave at the lee side of a breakwater, most likely, is due to a wave group that strikes the tip of the breakwater, and is broken into two halves, one of which penetrates the sheltered area, by diffraction. These are two of the predictions of the QD theory for what concerns random waves interacting with vertical breakwaters. The chapter shows these predictions, as well as the results of a verification by means of a small-scale field experiment.
Keywords
Long vertical breakwater; Nonhomogeneous wave field; Quasi-determinism theory (QD); Semi-infinite vertical breakwater; Small-scale field experiment (SSFE); Wave group11.1. Before a Breakwater
11.1.1. Equations of Deterministic Waves before an Upright Breakwater
The deterministic surface elevation before a long breakwater, provided that a very large wave of given height H occurs at some given point xo,yo, is given by Eqn (8.83) with Eqn (7.29) of Ψ:
 (11.1)
As to T∗, it is the lag of the minimum of
 (11.2)
 (11.3)
The deterministic wave pressure  proceeds on differentiating
  with respect to time T, and multiplying by (−ρ). The result is
 (11.4)
The horizontal particle velocity and acceleration proceed on differentiating with respect to X or Y, and with respect to T and X or Y. The result is
 (11.5)
 (11.6)
 (11.7)
 (11.8)
11.1.2. Occurrence of Exceptionally Large Waves before an Upright Breakwater
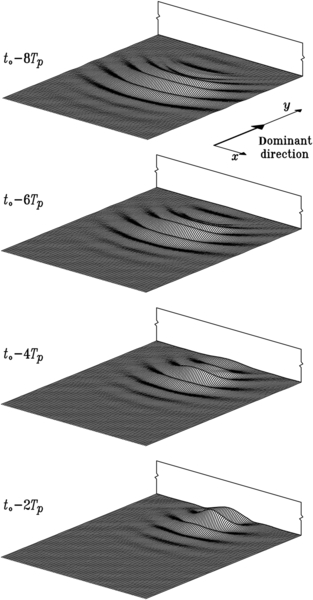
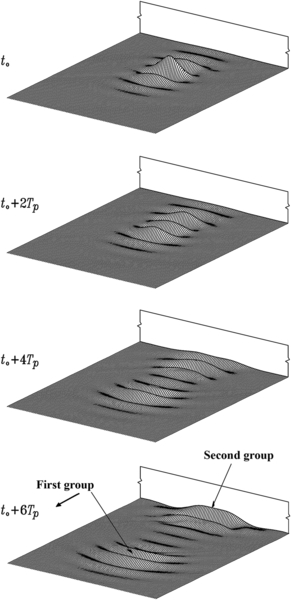
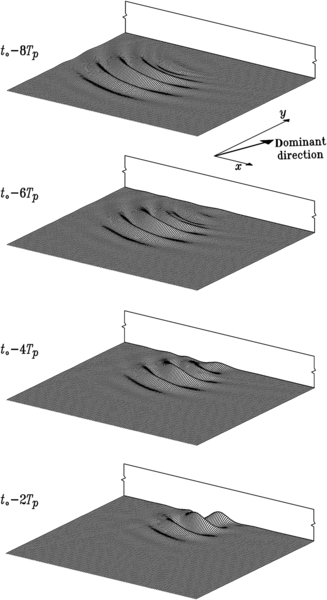
Figure 11.1 answers the question “what happens if a wave of a given, exceptionally large height, occurs at a point xo,yo at the breakwater?” This point is at the center of the framed part of the breakwater. The figure was obtained with Eqn (11.1), with the input data: deep water; spectrum: mean JONSWAP; directional distribution: Mitsuyasu et al. with np = 20. We see a wave group that approaches the breakwater, hits it, is reflected, and goes back seawards. It will have been noted that, while the wave group is approaching the wall, its envelope gradually shrinks, and, on the contrary, while the wave group goes back seawards, the envelope stretches. This means that the wave group is at the apex of its development stage when it arrives at the breakwater. In short, the answer is: if you record an exceptionally high wave at the wall, most probably, it is the central wave of a group hitting the breakwater, at the apex of its development stage.
Let us pass to a new question: what happens if a wave of a given, exceptionally large height, occurs at a point xo,yo, which is 3Lp before the breakwater? The answer is given in Fig. 11.2, which shows a big novelty: two groups! The first wave group hits the breakwater at time T = −6Tp, is reflected, goes back seawards, and collides with the second wave group approaching the breakwater.
The central waves of the two groups strike each other at the fixed point xo,yo, yielding the given, exceptionally large wave height. This wave height is very large because both wave groups reach the apex of their development when they come into collision. Thus, we realize why the maximum expected wave height far from the breakwater is smaller than the maximum expected wave height at the breakwater (on applying Eqn (7.49) one finds that Hmax at any point distant from the wall more than 2Lp is about  times smaller than Hmax at a point at the breakwater). The reason is that an exceptionally large wave far from the breakwater calls for an event that has a probability to occur, which is small in comparison to the probability of the event yielding an exceptionally large wave at the breakwater.
Finally, Fig. 11.3 shows what we may expect to happen if a wave of a given, exceptionally large height should occur at some given point of a breakwater, if the dominant wave direction of the incident waves makes a 20° angle with the wall-orthogonal. We see that the wave group travels in the dominant direction of the spectrum, hits the wall at the apex of the development stage, is subjected to specular reflection, and returns seawards.

11.1.3. Wave Loads on Structures
When an exceptionally large wave occurs at some point xo,yo of a breakwater, the segment of breakwater loaded by the wave crest will be particularly short, as we may see in Figs 11.1 and 11.3. The QD theory shows that the wave crest of an exceptionally large wave must be particularly short, given that an exceptionally large wave is yielded by a progressive focusing of the three-dimensional envelope, as it is evident in the two aforementioned figures. As a consequence, the effect of an exceptionally large wave on a breakwater is somewhat like the effect of a weapon fired from offshore.
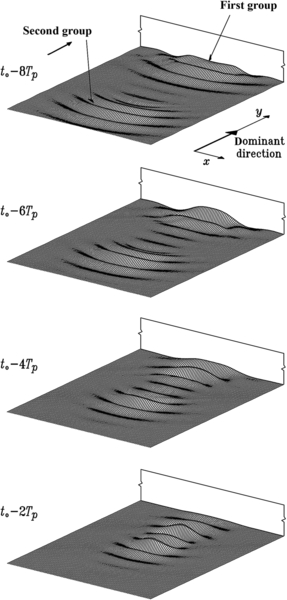

Equations (11.5)–(11.8) may be applied for estimating extreme wave loads on various kinds of structures that may be in the sea area before a breakwater (e.g., mooring points, conduits). As an example, let us consider the loads on a vertical pile off a vertical breakwater. An exceptionally large wave at this pile most probably is due to the collision of two wave groups, as we have seen in Fig. 11.2. This exceptionally large wave is a standing wave being yielded by the overlap of the central wave of the first group traveling seawards and the central wave of the second group traveling landwards. Point xo,yo is an isolated offshore antinode. Since the horizontal particle velocity and acceleration is zero at an antinode, if xo,yo is at the location of the pile, the pile is not loaded. Then we let vary xo,yo in a neighborhood of the location of the pile. If the dominant direction of the incident waves is orthogonal to the breakwater, the xo,yo for which we shall find the heaviest load on the pile is
![]() (11.9)
(11.9)
where  are the coordinates of the pile. In this case, the pile will be at the location of an isolated offshore node. The wave forces on the pile will be calculated with the Morison equation, with the particle velocities and accelerations being given by Eqns (11.5)–(11.8). Of course, H in these equations will be the maximum expected wave height in the design sea state at point xo,yo, which is dealt with in Section 7.4.
11.2. In the Lee of a Breakwater
11.2.1. Equations of Deterministic Waves in the Lee of a Breakwater
With a semi-infinite breakwater the deterministic surface elevation, provided that a very large wave of given height H occurs at some given point xo,yo, is given by Eqn (8.83) with Eqn (7.41) of Ψ:
 (11.10)
As to T∗, it is the lag of the minimum of
 (11.11)
11.2.2. Occurrence of Exceptionally Large Waves in the Lee of a Breakwater
The Cd (and consequently the maximum expected wave height) is surprisingly high in the dark area of Fig. 7.2. On the other hand, the Cd in the more sheltered area is practically the same as the Cd of the periodic waves. What is the reason for this? To answer this question, let us see what we may expect to happen when the maximum expected wave height in a design sea state occurs at a point xo,yo of the more sheltered area; and what we may expect to happen when the maximum expected wave height occurs at a point xo,yo of the “dark area.”
As to the point of the more sheltered area, we fix
![]()
where 0+ means “in contact with the lee wall.” Figure 11.4 shows what happens when the maximum expected wave height occurs at this point: a wave group strikes the breakwater's tip in full; thus, one half of the wave crest hits the wall and one half enters the sheltered area and produces the exceptionally large wave height at the fixed point. As to the point of the “dark area,” we fix
![]()
Figure 11.5 shows what happens when the maximum expected wave height occurs at this point. Here, we see a novelty: for the first time, the QD theory shows a wave group that does not travel in the dominant direction of the spectrum: the dominant direction is wall-orthogonal, whereas the group attacks from the left side. This wave group only grazes the tip of the breakwater with its right wing. The conclusion is evident: some wave groups with a direction slightly different from the dominant direction of the spectrum can nearly strike home the dark area. This is the reason why the maximum expected wave height in the dark area of the geometric shadow proves to be unexpectedly large. This possibility does not exist with the periodic waves, which are strictly unidirectional.
11.3. Experimental Verification
All that has been said in Section 9.4 re field verification of the QD theory holds for every configuration of the solid boundary. In 2011, an SSFE was performed with an array of 24 gauges along the y-axis orthogonal to a vertical breakwater—see Fig. 11.6. Figure 11.7 compares the random waves to the deterministic waves, in a case of H/σ = 9.90. It was the largest value of this ratio in the whole experiment. As we may see, the overall agreement between the deterministic waves and the random waves is strong even if we are dealing with a case of a nonhomogeneous wave field, which is more complex than a wave field in an open sea. Figure 11.7 proves that the interaction of wave group and breakwater described by the QD theory occurs in the field. Specifically, the figure shows the occurrence of an exceptionally large wave height at the second antinode (at one-half wave length from the breakwater). According to the QD theory, this is due to a wave group that strikes the breakwater, when at the center of the envelope, there are two waves of nearly the same height: the first one that has just left the center of the group and the next one that is going to replace the first one at the center of the group. The wave of exceptionally large height at one-half wave length from the wall has its crest at instant to and the trough at instant to + 1.5 s. The two consecutive waves of nearly the same large height at the breakwater are: that with crest at to − 1.4 s and trough at to + 0.1 s, and that with crest at to + 1.6 s and trough at to + 3.1 1s.
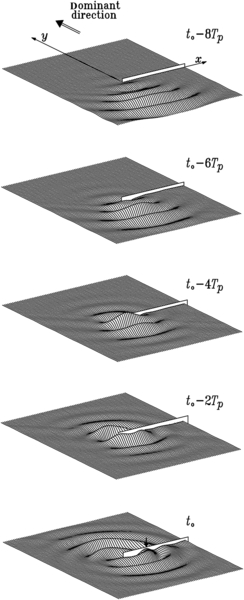
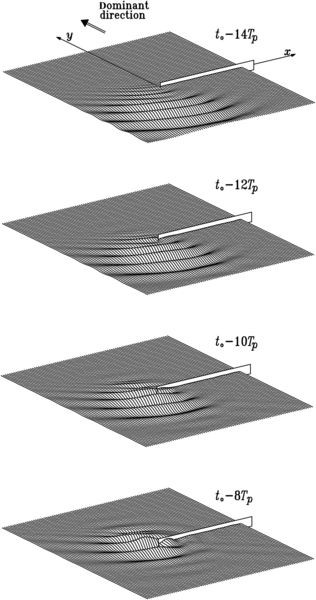
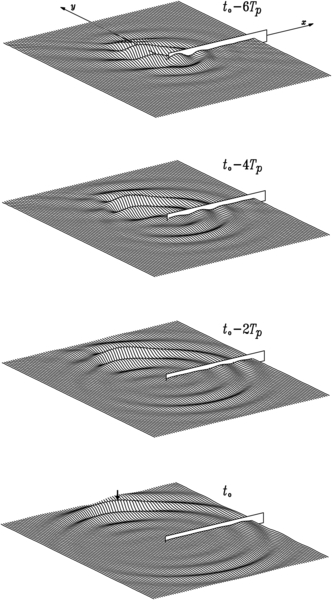
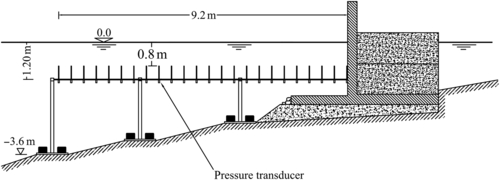
FIGURE 11.6 The gauges of a recent small-scale field experiment (2011) aimed to verify the QD theory.
There was an array of 24 pressure transducers, each of which is being connected with a small vertical tube with a bending section (like a small periscope). Pressure head waves were measured 0.80 m beneath the MWL.
11.4. Conclusion
This part of the QD theory was disclosed by the author (1988). A first SSFE to verify the part of the QD theory concerning interactions between wind seas and vertical breakwaters was performed in 1991, and was described by the author (1997). It provided a confirmation that an exceptionally large wave off a vertical breakwater is yielded by the collision of two wave groups. However, that early experiment enabled only to test the predictions of the theory in the time domain at a discrete number of points. The SSFE of 2011, with its test of the theory in the space domain, was described by the author (2013). Some nonlinearity effects on the QD theory for what concerns interactions with vertical breakwaters have been dealt with by Romolo and Arena (2008, 2013).
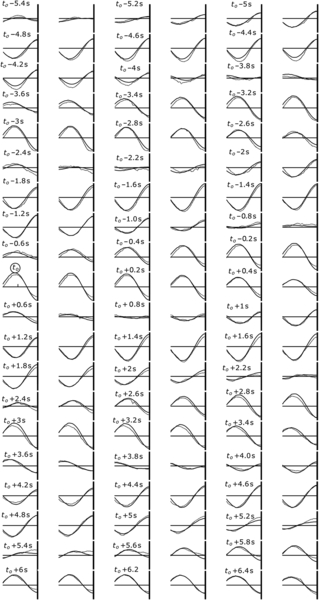
What happened when a zero up-crossing wave of H/σ = 9.90 was recorded by gauge no. 16 (the location of this gauge is shown by a small vertical segment in the picture relevant to time instant to). Dashed line: actual (random) wave. Continuous line: deterministic wave.
..................Content has been hidden....................
You can't read the all page of ebook, please click here login for view all page.