
DOCUMENTING PROCESSES AND SYSTEMS (STUDY OBJECTIVE 9)
Systems professionals and accountants must understand the documentation and charts that describe accounting systems. Such documentation allows the accountant to analyze and understand the procedures and processes of a business process and the systems that capture and record accounting data. The old adage that a picture is worth a thousand words is true for users documenting processes and systems. A picture, or chart, of the system is a concise, complete, and easy-to-understand way to analyze a process or system. The various types of popular pictorial representations of processes and systems used in businesses today include the following:
- Process maps
- System flowcharts
- Document flowcharts
- Data flow diagrams
- Entity relationship diagrams (ER diagrams)
PROCESS MAPS
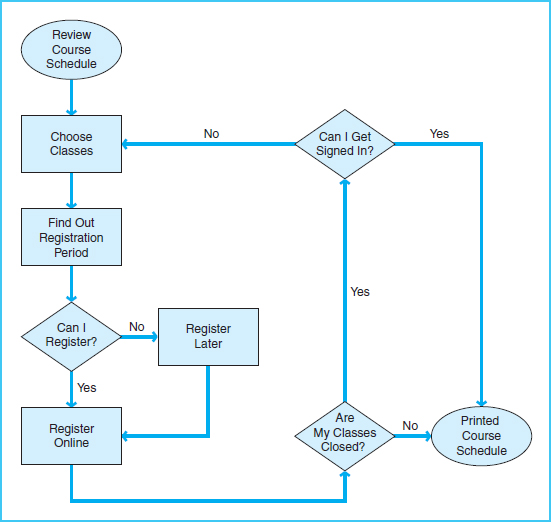
Process maps are pictorial representations of business processes in which the actual flow and sequence of events in the process are presented in diagram form—the start of a process, the steps within the process, and a finish of the process. Process maps are becoming a popular way to represent business processes, particularly as organizations undergo business process reengineering. Five symbols are used in process maps, as shown in Exhibit 2-6.
Exhibit 2-6 Process Map Symbols

With these five symbols, any business process can be depicted. Exhibit 2-7 is a sample process map that depicts a typical course-registration process for college classes. This process map is easy to comprehend because the underlying process is fairly simplistic. For some processes, however, where numerous activities may be performed in multiple departments or functional areas throughout the organization, process maps may be enhanced to depict varying levels of complexity. Each activity or department within a business process may be presented in either a horizontal or a vertical format.
In later chapters, process maps are presented as pictorial representations of the business and accounting processes. Some of these examples are horizontally formatted process maps, while others are shown in a vertical format.
Exhibit 2-7 Process Map of Class Registration
SYSTEM FLOWCHARTS
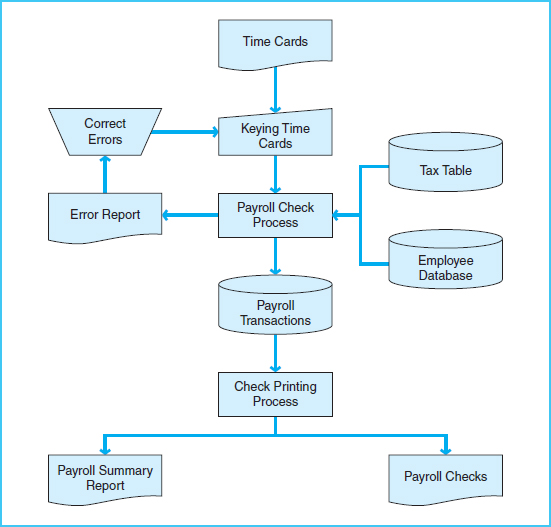
A system flowchart is intended to depict the entire system, including inputs, manual and computerized processes, and outputs. System flowcharts do not necessarily show details of each process, but display the overall sequence of processes and the media used for processing and storage. Processing and storage are shown as manual or computerized. Inputs can be documents, keying of input, electronic input, or processes that feed data to other processes. Outputs may be documents, statements, reports, data stored in files, or data fed into other processes. The symbols used in system flowcharts appear in Exhibit 2-8. An example of a system flowchart appears in Exhibit 2-9.
System flowcharts are used by systems professionals in the design and maintenance of IT systems. In general, accountants and auditors do not use system flowcharts extensively. Accountants and auditors are more likely to use process maps, data flow diagrams, and document flowcharts.
Exhibit 2-8 Common System Flowchart Symbols
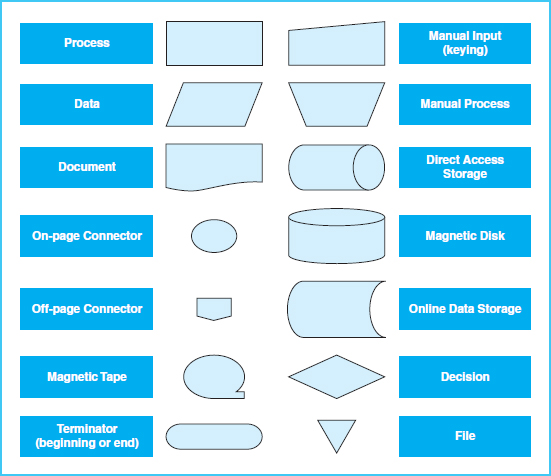
Exhibit 2-9 Payroll System Flowchart
DOCUMENT FLOWCHARTS
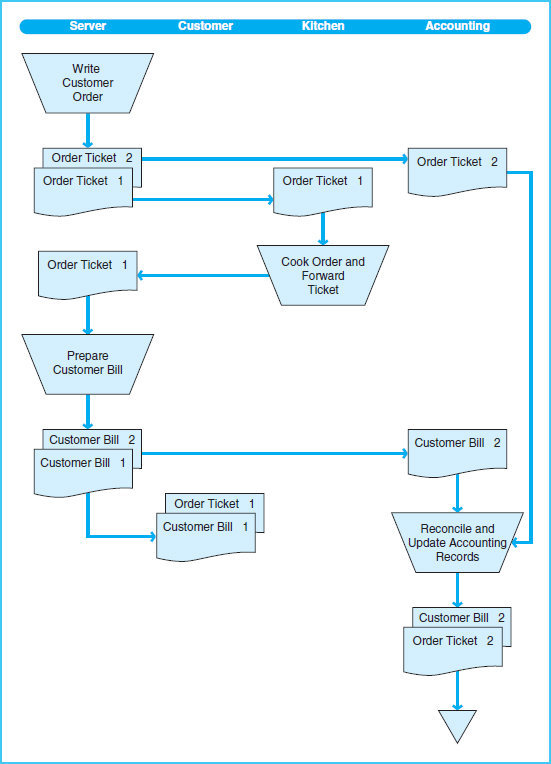
A document flowchart shows the flow of documents and information among departments or units within an organization. Document flowcharts are usually divided into columns, each representing a department or unit of the organization. Document flowcharts trace each document in a process from its origin to its final destination. Thus, the document flowchart shows the origin of a document, the units to which it is distributed, the ultimate disposition of the document, and everything that happens as it flows through the system. For documents prepared in duplicate, the document flowchart shows the flow for each copy of the document.
A document flowchart is a special kind of system flowchart that depicts only document flows. However, document flowcharts do not necessarily show all the related business processes. Document flowcharts are useful for not only understanding the flow of documents, but also in understanding internal controls. The symbols used in documents flowcharts are similar to those used for system flowcharts, as presented in Exhibit 2-8.
Document flowcharts, data flow diagrams, and process maps will be used in selected chapters of this book to illustrate business processes. The next three exhibits are examples of how these methods of documenting systems are used to illustrate processes for a small, local restaurant. Exhibit 2-10 is a process map in which the system for processing records and documents is manual rather than computerized. Exhibit 2-11 shows the corresponding document flowchart, and Exhibit 2-12 shows the corresponding data flow diagram. Data flow diagrams are explained in the next section.
Exhibit 2-10 Restaurant Process Map

Exhibit 2-11 Restaurant Document Flowchart
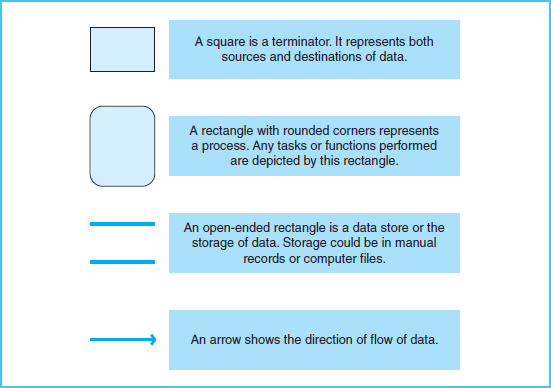
DATA FLOW DIAGRAMS
A data flow diagram, or DFD, is used by systems professionals to show the logical design of a system. The advantage of DFDs is that they use only four symbols and are simple to read and understand. (See Exhibit 2-13.) Exhibit 2-12 is a sample data flow diagram of the restaurant process shown in Exhibits 2-10 and 2-11.
Exhibit 2-12 Restaurant Data Flow Diagram

Exhibit 2-13 Data Flow Diagram Symbols
Data flow diagrams are shown in many of the chapters that follow. Systems professionals use data flow diagrams in structured system design, a process wherein the logical system is diagrammed at a high, conceptual level first. In succeeding steps, the data flow diagrams are exploded into more levels of detail until the logical structures of all detailed tasks have been shown in successive data flow diagrams. “Exploding” means that each individual process is shown in progressively more detail in a subsequent diagram. Although data flow diagrams are easy to read, accountants and business consultants more frequently use process maps.
ENTITY RELATIONSHIP DIAGRAMS
Entity relationship diagrams, or ER diagrams, are pictorial representations of the logical structure of databases. An ER diagram identifies the entities, the attributes of entities, and the relationship between entities. Some accountants find ER diagrams to be an excellent tool to represent the accounting data and entities in accounting systems because ER diagrams are a simple way to analyze the complex relationships between entities in an accounting system.
Entities can be thought of as the nouns that represent items in the accounting system. Employees, customers, vendors, and inventory items are examples of entities. Each entity has attributes, or characteristics of the entity. For example, employees have attributes such as last name, first name, pay rate, and number of withholdings. ER diagrams identify the entities, which become the records in a database, and attributes of entities, which become the fields of those records.
Database structures tend to be complex because entities are related to each other, and these relationships can be complex. For example, vendors and inventory items are two sets of entities that are related because the business buys inventory items from vendors. Any individual inventory item could be purchased from many vendors, and any single vendor could sell many different items to the business. Another example is the relationship between customers and orders. Each customer can have many orders, but any one order belongs to only one customer. The relationships between entities in ER diagrams are depicted by a concept called cardinality. Cardinality refers to how many instances of an entity relate to each instance of another entity. Cardinality describes each of the following three manners in which entities relate to each other:
- One to one: Each employee has one personnel file. Likewise, each personnel file belongs to only one employee.
- One to many: One supervisor has many employees. Each employee has only one supervisor.
- Many to many: Each vendor can sell many items, and each item can be purchased from many vendors.
Using symbols for entities, attributes, relationships, and cardinality, ER diagrams provide a pictorial representation of the database. The symbols used in entity relationship diagrams appear in Exhibit 2-14. Exhibit 2-15 (on page 69) presents an example of an entity relationship diagram for a sales database.
ER diagrams are tools to assist users in the understanding of complex database systems and the relationships between data items; however, they are not used in the chapters that follow. Although they are currently not widely used in accounting practice, you may find them employed at some point in your future. They are a useful learning tool in some approaches to understanding accounting information system concepts.
Exhibit 2-14 Entity Relationship Diagram Symbols Adapted from examples at www.smartdraw.com


Exhibit 2-15 Entity Relationship Diagram of Internet Sales Adapted from examples at www.smartdraw.com