
Chapter 7
Military and Big Data Revolution
Jean Brunet, and Nicolas Claudon
Abstract
The digitization of the battlefield and the world generates a huge amount of specific data. The physical environment of a conflict, even in remote areas, has never generated so much data. Is it, however, possible to analyze it? The task has rarely been so difficult, because most classical analysis systems are overwhelmed by the amount of data. The military are aware of the problem and know that a revolution has to happen, if the military potential is to be exploited effectively. Reports have already been written about the impact of Big Data on the military profession. In this chapter, we take into account what has been found by synthesizing it to go further with a new perspective on need analysis and the use of new architectures, as well as real-time processing technologies. As a result, new opportunities appear, unexpected until now. The more structuring aspects of their impact and advantages for the military are described and highlighted by focusing on intelligence requirements: Other uses can be derived. We then introduce the outline of an operational system capable of meeting these expectations. Military leaders and IT professionals involved in research or working for the private sector will be able to develop an operational solution within 18 months.
Keywords
Adaptation; Analytics; Battle; Military; Real-time; SecurityRisk of Collapse
For a number of countries, military forces could miss out and be left unable to meet the ambitions of their mission. The armed forces know how essential their intelligence agencies are to the preparation and success in a battle. Today, any action or decision is preceded by intelligence action. However, the more data you have, the more difficult it is to extract useful information from it. As this book is being written, most intelligence services are struggling with the capabilities required to collect, filter, aggregate, archive, compute, correlate, and analyze the tremendous quantity of data available. The only solution is often a choice between an arbitrary sub-set of data or ignoring some essential business rules. If the human intelligence gathered by a single individual in a location deemed dangerous is still decisive for the success of an operation, the digging and analyzing of the dust of data is secretly done by ordinary citizens assisted by an exponentially growing number of computers. These “armies of the shadow” have become the formidable tool of intelligence services.
Requests for “actionable information1” are recurrent. Actionable information is required at every level by military forces, so that well-informed decisions can be made. However, these requests are difficult to meet within a suitable timeframe, and the information often arrives too late for the execution of specific missions, which are defined by speed, lack of casualties, clear and instant information on the battle field, and a restricted budget. Maximizing and optimizing a mission requires additional and efficient data processing. The data processing chain consists, at first sight, of simple operations: filtering, merging, aggregating, and simple correlation of data. These are simple processing operations, but have to be applied on a different scale with low latency to achieve the level of intelligence required by today’s missions.
Beyond intelligence requirements, the huge quantity of data available on a battlefield is a consequence of the ever increasing use of sensors, technologies essential in warfare such as nano network sensors, tactical sensors, global positioning systems for vehicles and men, and tags/codes and communications.
The military looks for an agile, responsive, and swift reaction, because this is usually a decisive element for victory. But that is not all. A battlefield is not isolated from its geopolitical, social, and cultural environment. The preparation of military action is based on thorough intelligence groundwork requiring the gathering of a large quantity of data from the environment surrounding the battlefield. Asymmetrical wars have reinforced these links. It is therefore also a matter of processing data originating worldwide: from the web, social networks, communication flows; i.e., from a “sea of data,” which provides a digital picture of the world updated every second with hundreds of thousands of events. The COP2—a tool favored by the military when making decisions, giving orders or taking action—is a snapshot that is valued only because it is up-to-date. Such a snapshot is even more difficult to obtain due to primary event flows that are rocketing in terms of quantity and speed.
Even if the Big Data field brings solutions to this new situation, the military knows that technology cannot solve everything on its own. A major risk arises if the data is analyzed by people without experience of analyzing 3’Vs data3 or without the right tools and modes of data visualization. The human factor is crucial when interpreting complex data structures (see also Chapters 17 and 18). Let us imagine that instead of handling a few hundreds or thousands of lines in an Excel spreadsheet with sorting macros and filters, it is necessary to analyze manually several thousand Excel spreadsheets with hundreds of thousands of lines. For instance, a paper by the UK’s Government Business Council estimates that the number of unmanned aerial systems (UAS) in use has risen from 50 a decade ago to “thousands” now, with spending on them increasing from less than $300 million in 2002 to more than $4 billion in 2011. These UAS, it is estimated, have flown more than one million combat hours during this period.
At the more global level, it took years of effort to set up “network centric warfare” (NCW). It is a concept popularized under the name of networked warfare, which appeared in military doctrines at the end of the 20th century. As a term of American origin, it describes a way to conduct military operations by using the capabilities of the information systems and networks available at the time. The main evolution in relation to the prior doctrines concerns the sharing of information. It is about the capacity to link together the different armed forces (Army, Air Force, Navy), as well as armed forces of allied countries, to gather information using drones or satellites and to disseminate it to units in real-time so as to strike quicker and more efficiently. During the past few years, the network centric concept has expanded into the civil and business sector in the United States, and today, it supports the US influence in large companies and international organizations.
Unfortunately, the twilight of the concept began in 2010 for several reasons: the cost of such a system, the complexity of its implementation, and, finally, the nature of complex threats that do not seem, at first sight, to be consistent with the concept. However, a large amount of military needs have been formalized in NCW, and today some elements are extracted by armed forces. These armed forces are also, by indirect means, in possession of a light version of NCW. We feel that the advent of Big Data updates NCW under new auspices. Our objectives are more specifically to allow the rapid rise of networked warfare best practices, at a low cost and adapted to the new threats: agility, swift reaction, and short loops between sensors and effectors.
Into the Big Data Arena
The General Atomics MQ-9 Reaper is a surveillance and combat drone built by General Atomics for the US Air Force, the US Navy, the Aeronautica Militare, the Royal Air Force, and the French Air Force. During a mission, the MQ-9 Reaper generates the equivalent of 20 Tbytes of data. A report by former processing officers reveals that 95% of the videos are never viewed. The continuous rise of connected objects worldwide and on the battlefield is going to increase the gap between an abundance of data and the ability to use this information. It becomes obvious then, that for the armed forces, the risk of errors has to be taken into consideration.
In this chapter, instead of focusing only on Big Data’s theoretical capacity to meet needs or on evaluating the positive impact of technology on the military profession, we will focus on a very specific vision of a Big Data system rendered usable by integrating use cases and construction within the same thinking process. This chapter proposes a solution, aiming for quick implementation and immediate cost-effective benefits. In a time of austerity in military budgets, it becomes even more interesting to set priorities with results achievable in less than 18 months and then evolve in increments without forgetting the long-term vision. Wanting to design a full Big Data system can be extremely expensive. It is preferable to set priorities and implement them in stages. For example, it is better to make concessions on precision/accuracy rather than computation time, and then with longer calculation time to increase the result’s degree of accuracy. Actions on the ground require a short loop of less than 2 minutes. In that case, any result, however partial, is meaningful, as long as it is delivered swiftly. This is the reason why we are looking to use Big Data systems, which are presently capable of providing results in quasi real-time, and then gradually improve either the precision or the richness of the results.
We will explain how to create a system capable of processing around 10,000 to 1 million events per second. Processing means to filter, enrich, and correlate data sufficiently to obtain results useful on the battlefield. With 3’Vs flows, this system is designed to process an event with a low latency, of about a few seconds, to execute simple or complex business rules, and run machine learning on the fly. We will also explain how to make the system flexible, fault tolerant, and capable of evolving. We shall give a few examples highlighting the advantages of the type of architecture, which will be developed.
In its final stage, a Big Data solution has to be compared to a reactive weapon system that has flexibility and adaptability when faced with rapid threat. It is modular, and it grows incrementally in power and service. The implementation and configuration of thousands of computer nodes is not trivial, but it is possible today. A soldier still finds it difficult to compare the value of a fighter plane and that of a superscalar Big Data datacenter. It is an old debate, illustrated during past conflicts such as World War II, when the tenacious work of a British team of cryptanalysts averted two years of war.
Finally, it is to be noticed that police force intelligence and military intelligence tend to work more closely together than before. In this time of austerity, it is reasonable to assume that the sharing of means and sources of intelligence will become more common within the same country, while agreements with allied private operators will continue to increase. In other words, what we describe here can also be implemented for police intelligence or for the collaboration of both.
Simple to Complex Use Cases
To provide the military with the benefits of an intelligence system based on Big Data, one of the main difficulties is the need for diverse information. It is almost limitless in its form and expression, because it is changing constantly. There are two main classes of use cases, which can be differentiated mostly by their processing time/latency and their accuracy/quality. We aim to capture these use cases by means of a classification, which matches with different capabilities and capacities of Big Data systems.
The first class (class I) consists of the use cases already known and implemented in conventional applications that are struggling with the amount of data. It is a matter of adapting these applications or running them after applying some other treatments first, so as to reduce the magnitude with different processing treatments. It is also through Big Data batch processing that it is possible to rewrite part of these applications. These technologies are well known in the Big Data field, and a part of them are described later in the technical chapters (see Chapters 9–14).
As noted, the ability to process Big Data opens horizons inaccessible until now. Information, which used to be hidden in the sea of data, becomes accessible thanks to simple or complex treatments run mostly in MapReduce. This first class is well known, and the “conventional” Big Data systems based on large warehouses and batch processing are fairly well mastered. It is, nevertheless, necessary to review the algorithms to recode them in parallel mode. The infrastructures also need to be fully reviewed and resized to receive Big Data treatments.
The increasing number of events (data points) provided by sensors and other means, which describe individuals and their environment improves the digital version of the world. The challenge is to exploit it through Big Data. The different stages of the processing chain decrease the magnitude of the information along with the enrichment process, so that once it has reached the user’s desk, it can be handled, analyzed, and interpreted. This first stage already allows, for instance, the analyst to take all the videos recorded during the MQ-9 Reaper’s flight (not just 5%) and to apply treatments for filtering, shape recognition, analysis of differences between two missions, etc. The treatments, applied to each image of the video, are parallelized. For each image, the results are compared with the subsequent computation cycle, until they provide information of interest for the analyst. Although the treatments do not replace the human eyes and brain, they can highlight specific sequences containing relevant elements. To summarize, only a minute fraction of the video will be viewed by the analyst, but it will be the right one. Nonetheless, these treatments are applied after the flight, with batch processing with a duration that will vary from a few minutes to several hours.
Use cases in class II attempt to exploit the sea of available data within a fixed period. This second class regroups use cases that were inaccessible until now, thanks to technologies able to process flows “on the fly,” i.e., streaming processing. These use cases are characterized by short processing time and short latency. The computation is applied on a subset of data: The most recent data is used in streaming processing. They are kept within a time window that moves continuously, defined by the current time T and T-delta. Delta can vary from a few minutes to a few hours.
Let us return to the video recording of the MQ-9 Reaper’s mission. Imagine that a radio channel enables the retrieval of the images in streaming mode. This flow of images is analyzed in real-time. Each image injected in the Big Data system is processed immediately. As the images are being processed, the results are compared with each previous image. The algorithms of the image analysis are prioritized according to operational priorities: Which strategic information, even incomplete, does the soldier need before taking action? Is it enough to r-program the flight of the drone?
“On the fly” processing provides tactical information, which is at the heart of what is happening on the battlefield and to the action. You need to know about it is at the time the event occurs. Big Data are progressively building up toward the real-time analysis of data. Since 2007, Big Data technologies and systems allow the processing of all data over periods that vary from a few minutes to several hours. Over the past three years, with ever increasing volumes of data, the need of the market is moving toward a demand for reactive systems and short processing times. A need for interactivity with the data is growing beyond batch treatments, because these are not in the “battle rhythm.” This requires system architectures and new technologies, which are gradually emerging, to:
• Treat flows before archiving them in a warehouse;
• Maximize the use of servers’ RAM;
• Create capacity to trigger treatments on event arrival;
• Optimize the recognition of required treatments and data;
• Transform specific analysis algorithms, so as to deliver useful information as soon as possible;
• Create specific analysis algorithms, which produce increasing accuracy as the computation time increases.
To make the most of real-time mass processing, the implementation of Big Data causes a radical change in the way a need is expressed. This change seems close to the military’s operational concerns.
The more data you have, the more difficult it is to extract specific information.
The collection of structured and unstructured datasets involves reconsidering the way data are gradually distilled through several stages, until information for decision-making is produced. To benefit better from it, it is always important to know whether all the data is necessary. A particular organization of the data in RAM could provide useful results with a sufficient degree of accuracy and quality.
Sacrificing accuracy for actionable information to stay in the battle rhythm.
Depending on the case, it is not always necessary to obtain maximum accuracy for “actionable information.” The needs should be recorded and then prioritized.
Waiting too long sometimes means being too late.
It is possible to obtain an interesting result without realizing all iterations of the calculation on the whole data. This is why it is desirable to determine and prioritize the needs according to the objective to be achieved.
The better Big Data is explained and used, the more effective is the response to military requirements.
Faced with the Big Data phenomenon, we are trying to build systems, methods, and processes at the crossroad of the constraints of the military profession and the constraints of the computer systems.
The subclasses in Figure 7.1 are now described from a different angle:
• “Global analytic vision” subclass: This subclass brings together the needs for a global vision of intelligence, of a clarified situation, directions to follow, trends, or behaviors. The results are sufficiently informative. They rely on a large sub-set of data, but computations can be improved, for instance by sampling, to reduce processing time and by reducing the reading time if the data can fit in the RAM. The use of machine learning algorithms can detect information by relying on this sampling.
• “Deep analytics vision” subclass: This subclass brings together the needs for an in-depth and detailed vision of intelligence. All requested data are involved in producing the result. The reports are full and detailed, and the analyses are accurate and 100% reliable. The computations are made, if necessary, over the whole set of data. The accuracy and quality of the results are maximized. It usually takes several hours to get them. The treatments are usually of the batch type.
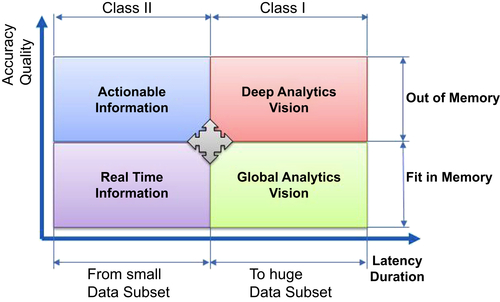
• “Real-time information” subclass: This subclass brings together the needs for instantly useable information. The processing time is short (from a few milliseconds to a few tens of seconds), and the latency is very low (once collected, the data are processed immediately) and guaranteed. Each fraction of time saved is important when extracting urgent information needed to guide future decisions. The data used are the most recent ones (within a range of a few minutes to a few hours); the algorithms are not always deterministic, insofar as all data are not available. The algorithms are simple, or they are designed to provide a result that is less accurate, but useable nevertheless by setting, if possible, a confidence interval. It often concerns individual, specific information, such as the geographical position of an entity on the ground at a specific time whose identity needs to be confirmed within a few minutes of identification.
• “Actionable information” subclass: This subclass brings together the needs associated with the “actionable information” type: high accuracy and quality with short response times (i.e., latency <100 ms). This can be done by simple filtering, merging, or enrichment operations, and by complex algorithms such as space–time correlation or machine learning in streaming mode.
In Figure 7.1, we also note that the separation into subclasses is linked to the localization of the data either in RAM or externally, i.e., stored on disk or accessible through the network on another physical server. The larger the amount of data used for processing located in memory, the quicker the treatments. Conversely, the larger the amount of data stored on disk or remotely, the longer it takes to access it. Depending on this localization, we can notice that the accessible subclasses are different. The size of the data sets used also determines which subclasses are accessible. Obviously, the larger the set, the slower the treatments on a Big Data scale.
Canonic Use Cases
Hundreds of use cases have been analyzed. Here are some of the categories:
• International common operational picture;
• Troop movements, terror movements;
• Terror threat, terror cells;
• Defense of own troops, protection;
• Prediction of abnormal situation, change detection;
• Local and international media context color detection;
• Mission preparation.
A vast majority of these cases has been collected into 20 canonic cases. These 20 cases determine the architecture and the function of components of the system to be built. They are divided into the classes and subclasses described above.
The system we describe later is capable of handling these canonic use cases (see Table 7.1). It is highly likely that more than 80% of a military intelligence agency’s needs can be met by this system. The rest can be met by additional applications included in this system.
In the remaining part of the chapter, we present several canonic use cases to highlight the importance of some components.
Table 7.1
Canonic Use Cases to Gather Constraints on the Real-Time Big Data System
| No. | Canonic Use Cases |
| 1 | Correlation on the fly in a sliding window |
| 2 | Correlation of data over space and time |
| 3 | Simple filtering of events with black or white lists |
| 4 | Enrichment of content on the fly and immediate notification |
| 5 | Enrichment of content on the fly with past knowledge and immediately notification |
| 6 | Spread of an interesting result in all the grid computing |
| 7 | Notify-alert based on an event with few criteria |
| 8 | Notify-alert based on abnormal reality (machine learning) on the fly |
| 9 | Numbers called by an identifier in the last hours |
| 10 | Numbers called by an identifier over 1 year without the last hours |
| 11 | Numbers called by an identifier over 1 year including the last hours |
| 12 | Top 50 of called numbers for any identifier over one year including the last hours |
| 13 | Provide for one identifier all the communications in the last 3 weeks |
| 14 | Provide all identifier in a location at time t |
| 15 | Audit why the systems fails to extract information |
| 16 | Request: Quality = F(duration) |
| 17 | Geo fencing |
| 18 | Ad-hoc interactivity request on a sub-set of data |
| 19 | Query = F(all data) |
| 20 | Read a big graph and relations |
Filtering
Governments have to implement democratic rules regarding the protection of their citizens’ private data. To do so, they need to be able to filter any data protected by specific rules. The excluded data must be destroyed even before they are archived on disk. Military interventions proceed in the same way, but with rules specific to the conflict and to international or strategic agreements. For instance, during an intervention by NATO forces in a conflict, diplomatic relations and agreements between involved forces necessitate filtering the data with the appropriate security mechanisms.
When an event is captured, it can be filtered by applying more or less complex filtering rules. No delay is allowed for the processing; i.e., the processing latency is very low, and no event can be left waiting. In case of the breakdown of one of the system’s components, the recovery should be quasi-immediate. It is therefore necessary to include regular checkpoints. The treatments do not need to use past events.
Remember that the flow of events to be filtered ranges from approximately 10,000 events/sec to 1,000,000 events/sec. Over 24 h, the number can be as high as 100 billion events per day, while the volume to be stored is 30 Terabytes approximately. These are quantities large enough to explain the fact that solutions are still rare. The system we are describing for these new needs is scalable. The building concepts and principles are all the more valid for a system 1000 times smaller.
Correlation of Data Over Space and Time
As explained above, time is critical, and it is not acceptable for a query to take minutes or even hours. Two approaches are possible to query all data with an almost instant response. The first approach is to answer the query globally. This means that for a query, the computation will be done over the whole data, and the results will be published for all the possible queries. For example, to answer the request of someone’s top 50 called numbers, for each individual number a computation will be done and the result will be stored.
• Benefits: Best response time to a query.
• Concerns: Each query must be programmed.
The second approach is to prepare the result over all the data, but not to get the final answer. The ideal is to compute a grouping that will get answers to many queries. The final answer will be a fast computation on a small sub-set of the data by making operations on the grouping. For example, if you need to create a top 50 of numbers called by a person, the computation over all the data would be to group all numbers that have been called by this person and only store this result. The final answer would be a computation summing each called number only for the person you are interested in, then to order and select only the top 50.
• Benefits: The schema is adaptable to queries, so you can answer another query with such a model.
• Concerns: A small computation must be done before returning results. It could be difficult to find a global schema to answer many questions.
Query = F(All data) refers literally to making an arbitrary query involving all the data. This is how Nathan Marz (author of “Storm a Big Data Event Processing Technology,” 2012) depicts the capabilities of a Real-Time Big Data system such as we describe later. This theoretical capability is actually achievable. Large companies such as Twitter, Facebook, LinkedIn, Google, and others already implement the capability that we are developing and adapting to meet military requirements.
More on the Digital Version of the Real World (See the World as Events)
In the last decades, increasingly sophisticated calculations have allowed the growth of reading, interpreting and forecasting capabilities. Although the calculations are still useful, the systems are faced with an explosion of 3’Vs data. They are either unable to perform, or it is necessary to choose a sampling mode, which allows a reduction in the number of events on entry—a difficult operation in itself.
One has to consider that this data explosion is also an opportunity, because the world has never been digitalized to such an extent. To mention only one sub-set, our communications and movements, as well as the behaviors of the connected objects that we use, all generate a constantly updated digital image of the world. Not only is the volume of data huge, but reconstituting the real world is difficult; because event sources are diverse, some of those captured are of an uneven quality, are captured with a time lag, or come from different geographical locations.
We have identified an intermediary stage, which consists in rebuilding a coherent digital version of the real world. The construction of a digital version of the world is feasible, if we consider that:
• The digital version can be effective without being complete,
• It specializes in a specific domain such as military intelligence,
• It is based on data, which should be captured with a specific intent/for a specific aim,
• It is based on algorithms ranging from the simplest to the most complex, which—once they have been parallelized—are capable of partially reconstructing a digital version closely resembling the real world for military requirements, and
• The minimal digital version of the world is shared by all downstream processing. All analytical processing, from the simplest to the most complex, aims to gain a better knowledge of reality.
The soldier of today and tomorrow uses more and more connected objects and sensors. Soldiers are now able to shoot at enemies without seeing them directly by using augmented reality glasses connected to his or her viewfinder. It is conceivable that part of the augmented digital world could be superimposed onto these glasses. Within a few seconds, it is possible to provide additional information in the viewfinder by using massive real-time processing to clarify images of newly discovered enemy positions.
The sensors of the soldier’s Nano network not only inform the soldier directly, but they also provide data about the environment that could only be correlated by central systems. From a more thorough perspective:
• The world is considered as a set of events.
• Parts of these events are included in the digital version of the world.
There are some paradoxes, which are not only constraints but also strengths:
• The more numerous, specific, and powerful the sensors are, the closer to the real world will be the data collected by these sensors.
• As the 3’Vs data increase in volume, it becomes more difficult to build systems capable of supporting the processing.
To address these paradoxes, we use a building device. “On the fly” processing or streaming allows the launch of immediate processing on the flow of events describing one part of the real world. The resulting information may be partial or complete, partially reliable or totally reliable. However, at the time, it may prove vital to the success of an operation. Indeed, the early emergence of a piece of tactical information enables the early preparation of the means, of the decision to open fire or not, the prepositioning of forces, the selection of targets, etc. It is therefore natural to design processing, which ranges from the simplest to the most complex and from the quickest to the slowest. For example, upstream of the processing, the data are purged by filtering the nonuseful events, sorting or counting them. By examining only a few fields of the event, it is possible to quickly identify the useful events, so as to regroup and correlate them. At every stage, added value appears, which brings more elements to support the decision.
Quality of Data, Metadata, and Content
Originating for the most part from varied sources (sensors, Open Source Intelligence (OSINT),4 websites, social media, communications, SMS, etc.), the data is extremely diverse. It usually takes the form of several streams of files from which the intercepted events are extracted. These events consist of metadata and content. For instance, a communication consists of, on one hand, the sender, the receiver, the start and end dates of the communication, geographical details, etc. On the other hand, there is the content of the communication. Some events contain only metadata. Metadata is small in size (a few hundreds of bytes), whereas the content can reach several tens or hundreds of megabytes in size.
It is important to take into account this difference in size, because the mixing of metadata and content within the same pipeline is to be avoided, because the processes to be applied differ in nature.
To give an idea of the range, the system studied in this chapter is able to process hundreds of thousands of events per second. The average size of an event is in the 500-byte range. This system is mainly concerned with problems related to the processing of metadata. The processing chain for content contains other difficulties, which can be handled by mechanisms already designed within the metadata processing system and by the mechanisms of more conventional systems.
Data sources are imperfect, sensors have limited capabilities, and data transmission can be random. Between the source of the generated event and the data center, it is therefore not unusual for the data to be incomplete, partial, damaged, lost, badly coded, imperfectly decrypted, unsynchronized, or delayed. It is an illusion to want to build a Real-Time Big Data system without taking this situation into account. This is the reason why the concept of constructing a digital image of the world that is being continuously updated is of particular importance. The architecture has to include the different cases of damage to the data, some mechanisms to partially remedy it, and some rules to rectify the situation logically and progressively to improve the digital world used as a unique source for the processing. The impact on the profession is patent: A method of reflection should be established so as to evaluate how analysts at their desks and soldiers on the ground learn to deal with quantified uncertainty and possible damage to the digital image.
Real-Time Big Data Systems
Application Principles and Constraints
The concepts and constraints originate from the needs and use cases described above, namely:
• The digital version of the real world is built in real-time. The necessary and sufficient digital version is formed progressively.
• The continuous digitalization of the world produces new data in real-time, immediately available for real-time enrichment processing.
• As soon as an event is collected, it is processed before being archived.
• The processing time is guaranteed. The latency is as low as possible.
• An immediate partial result is often more interesting than the full result, which requires more calculation time.
• It implements the canonic use cases.
• It contributes highly to the “battle rhythm” by means of reducing the computation time in the same scale as the communication components.
It is a “Real-Time Big Data System” because:
• Events originating from the world and the battlefield are processed immediately. One level of real-time analysis should cover 80% of needs. (It is an approximation, which is to be adjusted according to the operational contexts.)
• It integrates data sources such as geographical data systems, weather forecast services, and civilian or military databases.
• The system is scalable; it increases or reduces in size based on the amount of data, the latency, and the processing times required.
• Within the intelligence chain, it is located between the event sources and the data analysis applications. It is a subsystem of the global system.
• A short loop is available thanks to the “real-time” component of the system.
• It can be highly available (option of a total 24/24 availability).
• In case of recovery, there is no loss of data (option depending on the financial investment).
Each component of the system is justified by:
• The generic use cases;
• The processing time constraints, volume of data, and diverse nature of the data;
• The architectural principles of Big Data computer systems.
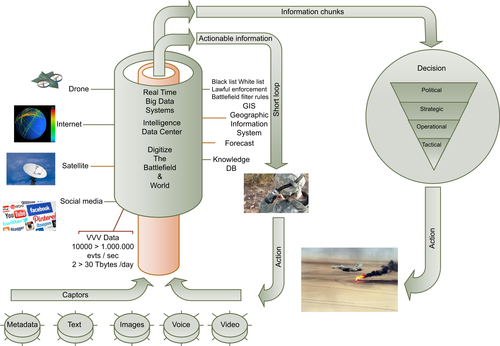
In Figure 7.2, which is inspired by the centric warfare concept, sensors generate events consisting in metadata and structured and unstructured contents of varied nature. Sources can also include satellite or ground communication networks, as well as OSINT. Social networks are rich in data, which are useful for preparing missions and for the “battle rhythm.” Military data repositories are also used in combination with other sources such as weather stations or airline or Geographic Information System (GIS) data.
Logical View
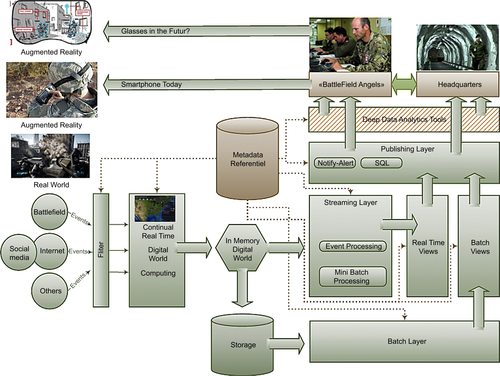
The macro logical view gives an overview of a viable real-time Big Data system. The diagram in Figure 7.3 is split into large logical components to get closer to the real system, which is to be built with the relevant technologies. The system is scalable and modular by nature. It is strongly advised that the system be developed in successive increments. It is possible to start by processing a sub-set of data in streaming mode. This, for example, represents about 10% of the proposed system. And yet, it contains all the basic principles, which will allow the system to be developed in several stages. For instance, results are at first accessible only in the form of predetermined alerts. It is possible to program as many alerts as necessary from queries with a shorter or longer response time according to the confidence interval that is to be obtained.
From the left side, accessible data sources generate a few thousand to several millions events per second. They depict the real world, but some of them are polluters or background noise. Others have not been used, or a rule prevents them from being used. The filtering and elimination processing of data has to be updated to a scale suitable to their number, their diversity, and their immediate or delayed use.
In the next stage, these events, still mostly unusable, are transformed into a unique format while retaining their diversity and content. As sources or sensors produce, albeit at different speeds and different places, events describing the same phenomenon (e.g., a communication or an entity’s movements), it is necessary to resynchronize, correlate, and aggregate them to reconstruct a coherent image of the real world. This component continuously computes the world in real-time. The digital world is constantly updated by sources and sensors. Only the most recent part is stored in memory, within what is called “the stream of coherent and rectified events,” which is then injected in real-time processing and stored on disk. From storage on disk, it is always possible to extract any images from the past. Events are immutable. and they are never deleted.
The “streaming layer” component performs real-time processing triggered on receipt of new events originating from the digital world. Two types of engines are required to meet different needs. The first one is a “pure event processor” engine, able to trigger processing for each event received. The second engine proceeds by aggregating a relatively small number of events to apply the same processing to all of them simultaneously. The latency is potentially higher, but among the use cases “machine learning” is particularly suitable for this engine. The “streaming layer” immediately transfers the results into “real-time views,” which index them. These results can be accessed via the “publishing results layer.” The “subscribing layers” are notified, and alerts are then dispatched under different forms to terminals such as workstations, tablets, mobile phones, or effectors.
While the “streaming layer” deals only with the latest updates of the digital world, the “batch layer” covers the whole history. This capability is essential when wanting to apply deterministic processing. Class I of the generic use cases is based on batch processing. These types of processing are batch-related, because they last from several minutes to several hours. Thanks to this layer, it is always possible to reconstruct all results from the repository containing the event history. Results produced by the “batch layer” are indexed in batch views accessible via the “publishing layer.” The digital world is fully accessible through the “publishing layer” by reuniting the history accessible through the “batch views” and the most recent events, which are flowing into the “streaming layer” via the “real-time views.”
Implementing the Real-Time Big Data System
In the following, we explain how and with which technology such a system can be built. We chose the open-source option, but other solutions exist, supplied by publishers such as IBM, HP, Oracle, etc. Our system is a true real-time system. The coupling of three layers (streaming, batch, and publishing) ensures a wider range than what real-time allows in terms of results and access to all data. This range is expressed by the need equation analyzed previously: Query = Function(All Data). In the following, we introduce the optimum choices based on open-source software. The open-source option is a realistic choice also made by the biggest social media and internet players, such as Twitter, Facebook, Netflix, LinkedIn, and others for their own real-time Big Data systems.
The batch, streaming, and publishing layers are loosely coupled with strong coherency between updating and data timeline coverage. Beyond the field of streaming capabilities, all layers give access to the 20 canonic uses cases over the whole data. The most generic of capabilities is contained in the equation: Query = F(All Data). We explain hereafter the optimum choices for the layers with the best Big Data open-source software.
Batch Processing (into the “Batch Layer”)
Today, “Big Data” is a trending term associated with the idea that it will solve recurrent problems of existing systems: data warehouse approach brings high maintenance, too much time spent on ETL, increased loading time, etc. Behind the concept, the reality is a little different. The volume, variety, and velocity illustrate what Big Data means: a lot of sensors bringing too much data in a wide range of nonstandardized formats within a few seconds. If making sense of all this data is impossible using a classical approach, because of the long processing time and large data volumes to store, a batch-oriented architecture should be considered.
The storage layer must be able to store petabytes of data effectively under the constraint that costs and performance should stay linear. Instead of using a storage area network, the cost of which will grow exponentially until it has reached a set limit, a distributed file system offers a substantial benefit by only adding servers to a cluster and using their disks as a distributed storage. The storage layer is mostly based on the Hadoop distributed file system (HDFS). The benefits of HDFSs are: they are cheap to maintain; data is replicated and stored in blocks to limit overhead; and access is I/O parallel.
Processing Layer (into the “Batch Layer”)
Two main open-source solutions exist today to process large batches of data: Hadoop with MapReduce and Spark. Hadoop has been on the market for a few years. The Apache Software Foundation released the second version of Hadoop during summer 2013. The major improvement has been to split the Job Tracker into two different daemons: the resource manager and the job scheduling/monitoring. This approach, called YARN, allows the resource manager to dedicate resources to application managers that can be a simple MapReduce job or a more complicated DAG job. This has led to the rise of multiple frameworks.
In a Hadoop cluster, data are distributed over all nodes. A MapReduce job is defined as a mapper operation, sometimes a combiner, and finally a reducer, which processes the job result. Ideally, the mapper is executed on each node with the data stored locally on the node. The mapper is a parallel operation, which will produce a tuple with a key and value. The combiner operation happens at the end of the mapper operation. It is also parallelized and in general used to precompute intermediate results. Finally, the reducer will sort the data on the grouped key and will process it.
A MapReduce job is a bit tedious to write. Therefore frameworks have been developed to facilitate this step. Three frameworks should be considered. The first is Apache Pig, which is a logical expression of the data pipeline to be created for a job. The Pig execution engine will transform a Pig script as a sequence of M/R jobs.5 The processing is expressed in the Pig Latin language, and extensions needed such as custom reader or writer must be expressed in a user defined function. (Since the release, 0.12 users can write them in Java (preferred choice), Python (for Hadoop 1.0), Jython, Ruby (experimental), or Javascript (experimental).)
Another approach is to use Cascalog, which is similar to Apache Pig, because it enables the developer to express jobs in terms of logical blocks. The processing can be expressed using Clojure or Java.
Apache Hive, as the third framework, is a better approach for non-developers, because it enables users to express queries in a language close to SQL. The purpose of the Stinger initiative, which came out in Hive version 0.13, is to have a full SQL support, meaning that existing SQL applications could be plugged over Hive, and thus accelerate queries by a factor of 100. To do so, queries are now running in memory with Tez.
Tez is an extension to Hadoop developed and supported by Hortonworks. The purpose of Tez is to accelerate and break constraints of the MapReduce by eliminating constraints such as synchronization and read and write to HDFS between jobs. It is an execution engine that can process complex DAG that will be submitted to YARN for resources allocation. Therefore it is highly suitable for Apache Pig and Apache Hive. First results show an improvement by almost 100 times on HiveQL queries (see Stinger initiative from Hortonworks).
Another framework that is getting much attention in the last few months is Spark. Spark is an open source project developed by the Apache Software Foundation.
Spark
Spark is a distributed execution engine, which works with HDFS to load data and store results. It allows the developer to express a pipeline of instructions easily in Java, Scala, or Python that will be transformed into a DAG job by the execution engine. It is similar to what can be done with Hadoop, but its mechanism of caching the data significantly increases the performance of iterative algorithms. The pipeline of instructions is made possible by the RDD structure. RDD stands for “resilient distributed dataset” and defines an object as a distributed collection over the cluster with operations and actions, which can be applied to the RDD to filter or act on each element (see the operation and actions list in spark.apache.org/docs). The first operation is to load data to an RDD. The easiest way is to use the HadoopRDD that has a method to parse lines from a text file. Once this is done, many operations can be applied, such as a map that means a function will transform each data inside the collection, a filter that also takes a function to keep only the interesting data for the algorithm, a group by key that will help group data according to a field, a join that will help joining two RDD collection on a key, etc.
Spark internals
Spark works with three main components. The Spark master manages the cluster made of Spark workers, which are executing a program driven by an application master called the driver. The role of the driver is to submit jobs to the cluster, so if a job fails it will not interfere with other submitted jobs to the cluster from different drivers.
The driver is built with four main components: RDD graph, scheduler, block tracker, and shuffle tracker.
• The RDD graph is the representation of operators applied to data in RDD.
• The schedulers for DAG and tasks in charge of DAG creation and tasks execution.
• The block manager is a “write-once” key-value stored on each worker, which serves shuffle data and cached RDD.
• The shuffle tracker enables retry from shuffle outputs written to RAM/disk.
Once built, the application is executed on the master node in charge to manage the application execution on the Spark cluster. The execution follows a scheduling process in four steps: the DAG scheduler is the component that will interpret the program and create a DAG job that will be split into stages of tasks and then submit each stage as ready. It knows dependencies between operations at the partition level. A partition is a set of tasks defined by an operation on each data element. Its roles are to do the pipelining of partition operations and turn partitions into tasks. Tasks are then grouped into stages for optimization and synchronization. An example of stages is to wait for the map to finish before starting the reduce side. Each stage will be submitted to the task scheduler. The task scheduler’s job is to get tasks done. It takes the independent tasks of a stage and submits them to the worker, which will return a failed task if something goes wrong, such as an unavailable or too slow node. The workers have multiples threads to execute the given tasks and a block manager to store and serve blocks to different machines.
Spark stack
The company Databricks is behind the development of the Spark stack. The purpose of Spark stack is to bring many transformation bricks to perform data analysis in a faster way than Hadoop MapReduce. In May 2014, the Spark engine reached its maturity, as the version 1.0.0 was released. Now Spark is also an ecosystem with the help of Spark Streaming, which is able to process streams of data. Spark SQL allows relational queries expressed in SQL, HiveQL, or Scala to be executed using the Spark engine. The machine learning library provides the common implementation of algorithms such as clustering, collaborative filtering, classification, etc. Finally, the stack includes GraphX for graph processing. A resilient distributed property graph extends the abstract RDD, which represents an oriented graph with properties attached to each vertex and edges. The RDD supports fundamental operations to perform graph analysis like reversion, subgraph, and join on vertices.
Data Stream Processing (into the “Streaming Layer”)
Storm—a pure complex event processing
Storm is a distributed streaming engine that could be considered as a pure complex event processing framework, since computing starts when events happen. A Spout that will emit tuples to computing units called Bolts reads data representing events. A streaming workflow in Storm is called a topology. A topology is described as a set of Spouts reading events and sets of Bolts that can subscribe to events emitted by Spout and other Bolts. The fault tolerance mechanism is based on the Spout behavior that flags emitted tuples. Each Bolt will acknowledge each received tuple once it has been processed. The DAG job is considered completed once each Bolt has acknowledged the tuple. Then the Spout will consider the events as treated. After a certain timeout, the Spout will emit again the tuple for processing and retry a defined number of times.
Trident over storm
Trident is a logical layer based on the Spouts and Bolts mechanisms described above. Using Trident, the developer expresses the processing based on logical instructions instead of a streaming workflow. Trident is equivalent to Apache Pig for Storm. Tuples are treated in a batch manner inducing a bit of processing latency. It is important to understand that if a tuple fails, the whole batch the tuple belongs to will be replayed by the fault tolerant mechanism. Furthermore, the stream is made up of multiple batches that are sequentially ordered. If a batch fails, it will not be possible to process the subsequent batches. Storm is part of the Apache Software Foundation as an incubating project. The current version is Apache Storm 0.9.1. It has been tested and considered as very stable.
Spark streaming simulating real-time with mini-batches
As a new candidate, Spark Streaming seems promising, because it builds over the Spark engine. The approach is the opposite of the Storm processing, because events are not brought to the processing. Rather they are aggregated in small batches that will last at least for a second. The processing then happens inside a mini-batch in the same way it would happen inside a regular Spark code application. Instead of manipulating an RDD directly, a structure called a DStream (districtized stream) is used, which is a succession of RDD that can be access using a special operation called foreachRDD. Each RDD in a DStream represents data from a certain interval of time. Any operation done on the DStream will be executed on all the RDD composing it by the Spark engine. Operations on a DStream are very similar to the regular Spark API, but can use an updateByKey, which will take a function to update each key. Finally an interesting feature of Spark Streaming is the ability to use sliding windows that will help compute results over several mini-batches (count, reduce, reducebykey).
Alerts and Notifications (into the “Publishing Layer”)
As soon as a result is available, users are notified via subscribed applications: popup, graphic alerts in a window, an additional line on a dashboard, a signal over a map, etc. This component must be able to notify a number of results, not only to the end user, but also to other analytics applications in real-time. Between computing an event and the notification on a screen the latency should be less than a second. To ensure the transfer from computing nodes dealing with up to one million of events per second to the users, the “publishing layer” must convert speed and throughput for the slower applications and users.
Filtering Processing Fitting in Memory (into the “Streaming Layer”)
Input data should be injected into a messaging queue. Apache Kafka is perfect for the role, because it is a distributed messaging queue serving messages from memory that will fall back to disk storage and cached data. Messages are published to a topic that is distributed to Kafka servers called brokers. A topic is made of multiple partitions that are each sequentially ordered and to which only data can be append. Reading from Kafka brokers is fast, because it reads from all available partitions. It is the job of the consumer to keep track of what has been read. This helps the broker to keep a low load. The producer, as the name suggests, reads data from a source and then produces messages to a topic. For parallelization, the producer will use all available partitions.
Filtering of stream jobs consists of reading from a Kafka source representing the most recent events and reacting to them. Usually a filtering job will have a collection such as a HashMap that will know, which data should be filtered and which tags should be added to the event that will be distributed across all computing nodes. Once the event matches the filtering map, it will be processed accordingly, which can mean adding tags, transforming the events, and finally publishing it to a Kafka topic called alerts or sending an email if the number of matches is reasonable.
The interesting fact is that, once an event is filtered, it could trigger other processing steps just by being read from the alert topic. This setup provides a true event processing model inside the “streaming layer.”
Machine Learning and Filtering (into the “Batch and Streaming Layers”)
Let us consider distributed denial of service attacks as a use case. A list of vital interest organizations must be monitored for national security purposes, and we are going to describe a basic approach using open-source software instead of network devices to illustrate a possible setup to protect such organizations. This example is to illustrate the filtering method, but would not be as efficient as a specific DDOS6 network device. A sensor is plugged-in on the national network backbone that delivers Internet traffic to national providers, which are routing it to the vital interest organizations. The sensor is acting as a deep packet inspection and will deliver meta-information and content to our filtering system. Meta-information is small datasets that describe the content that has been generated. Meta-information will provide at least a source IP-address representing the potential threat and a destination IP-address representing our national organization we need to protect.
The first step consists of filtering the massive traffic, i.e., dropping everything that does not target our limited destination IP-address. Using Storm, we are implementing a topology with a spout that will read a Kafka topic with the meta-information. The topology contains three Bolts:
• Destination filtering Bolt, which knows the destination IP-address;
• Request filtering;
• Results write to Kafka Bolt.
The only treatment of the filtering destination Bolt is to look for the destination IP-address. If it is known, it will send a tuple to the filtering request Bolt. Two interesting implementations are worth mentioning. First, if there are a lot of IP-addresses to monitor, it might be interesting to use a bloom filter instead of a HashMap for better performance. Second, if there is a dynamic list of IP-addresses to monitor, it might be interesting to implement a second spout that will read a Kafka topic, which is hosting add and delete actions for monitored IP-addresses. The destination-filtering Bolt will subscribe to the monitored IP-addresses spout and will update its reference table accordingly. The request-filtering job will only look for request types and will drop anything that is not request related. If this is the case, then it will send a tuple to the final Bolt for writing to Kafka. The result Bolt to Kafka exists only because we do not want the request Bolt to wait for a replication acknowledgment from Kafka to be able to process more incoming tuples (events).
To filter the number of requests made by an IP-address, we are going to implement a frequency requests monitoring algorithm. The algorithm will learn from the context. For each mini-batch (lasting a second), the request frequency is calculated for each IP-address, similarly to a word-count. The IP-address will serve as a key, and a tuple will be emitted for each request. The tuple is reduced by the IP-address, and then each bucket is counted. Once the IP-address count is known, it is divided by the number of batches since the beginning or since a specific period to be monitored (sliding window of time), which results in the frequency. The last step is to compare the frequency to the threshold. If it is higher, the requests will be dropped. Such an algorithm should be implemented before the filtering method described above, because it will drop unnecessary traffic to be processed by the Storm topology.
Using the Spark streaming, you are reading a Kafka topic with a Kafka input stream receiver, which provides a DStream of events. We are going to split the events on the separator and drop everything else than our column of interest, the source IP-address. Next we are grouping all events by IP-address and reduce on it. Spark streaming already has implemented a reducekey operation, which takes a function. This function should be associative for parallel computation. We are transforming our DStream with the use of the reduceykey using the addition function, which will give us a new DStream providing a count per IP-address. The frequency is then calculated by dividing it with the number of batches. Finally, we are filtering the DStream with a function that compares the frequency with the threshold. This gives us the final DStream. On the final DStream, we are going to act on each element to produce a Kafka topic. We can make this algorithm “stateful” by remembering the frequency each time or “forgetful” by recomputing it each time.
Online Clustering (into the “Streaming Layer”)
The online KMeans, which allows clustering data on the fly by reading a stream, is a technique that should be explored. Currently in Spark, the machine learning library is not compatible with the Spark Streaming. Here is an explanation of how to use it.
Data are read from a Kafka topic and then split into different events. These events are dealt with in mini-batches; i.e., each batch will cluster its events and then update the centroids. Events are considered as vectors inside a DStream. For each mini-batch, vectors are broken down into k clusters by a function that computes the average distance between a vector and the centroids. Once all vectors are assigned to a cluster, we proceed to compute the intermediate centroid for each cluster. Finally, to get the new centroids, we compute for each cluster the new centroid by weighting the intermediate centroid by the number of vectors that were used to compute it, then add it to the weighted old centroid with the total number of vectors that were used to compute it divided by the total weight of old centroid and intermediate centroid.
Results Publication
Top 50 source IP-addresses for a destination IP-address in 1 year without the last hour
Top 50 source IP-addresses for a destination IP-address in the last hour
To build on our example, the batch view has been computed, but it missed the last hour. Therefore the publication system needs to query the last hour of the streaming, view results, and return the result to the user.
Top 50 source IP-addresses for a destination IP-address in 1 year including the last hour
Finally, if the user wants the result to a query, which requires the whole history including the last hour, the publication system should be able to aggregate the results of both views produced above.
Build the Layers
As we have seen over the previous pages, the “batch layer” is a collection of events from a large period. In contrast, the data “stream layer” is a collection of events, which are acted on in near real-time (a few milliseconds to a few seconds maximum). For each processing, results are lying in each layer. At times, it will be enough to just query one layer; at others, it may be better to query both layers. If we build on the filtering example, analysts may want to query the top 50 source IP-addresses that have queried one particular host in the last three months, including today and current events that have just happened when the query was made.
The first step is to query the batch layer with Apache Pig. For this, you will load the events stored in HDFS with a load instruction in a relation. Then every field not needed is dropped to keep only the important ones, such as the IP-address (our key), the date of the event, etc. This will limit the size of the data going through the pipeline and will significantly accelerate our Pig script. This is done with the help of the foreach instruction for each relation, which generates a list of fields separated by commas. The next step is to group the data by source IP-address. The relation will then contain bags of events, in which the key is the source IP-address. For each bag, we will then count the number of elements. Finally, the list is ordered by count and filtered for the 50 first results. Because the code is pretty simple and can be written in less than 10 lines of Pig script, we added it below as a reference:
rawdata = LOAD ‘myhdfsevent’ AS (srcip, evtdate,dstip);
ipaddresses = FOREACH rawdata GENERATE srcip, evtdate;
grps = GROUP ipaddresses BY srcip;
count = FOREACH grps GENERATE count(ipadresses) as frequency, ipaddresses.srcip;
order = ORDER count BY frequency DESC;
result = LIMIT order 50

STORE result INTO ‘output’ USING PigStorage(‘;’);
Depending on the amount of data stored in HDFS and the number of nodes in a cluster, the batch processing time could exceed hours. Therefore a query regarding past and today’s events will not be accurate only using results processed by the batch; i.e., the batch view is only accurate during the processing of a batch, and for the time the views are published to a database. To respect the CAP theorem, the database needs to be available and partition tolerant to user requests. Therefore a batch view will replace an older batch view and switch only when it is absolutely certain that it has been totally uploaded. An important feature for such databases is that they must be able to do random reads, once writable, as well as be scalable and fault tolerant.
In case of a DDOS attack, the source IP-address might change during the attack. If this is happening, the top 50 might change radically. Therefore a topology or a job is needed that will compute the same results, but for the last hours including only events since the last batch starting time. With such an approach, there will be redundant algorithms expressed in different technologies. Efforts are being made to limit algorithm implementations.7
Such results should be stored in a database like Cassandra or HBase, which are capable of storing a large number of results and be queried very fast, if the schema is designed in accordance to the queries. In general, NoSQL databases like the ones mentioned previously are made to support large amounts of data, and contrary to the SQL model, “denormalization” is here the main principle. Therefore schemas for fast queries can be designed, which do not care about the amount of data stored in a system. Of course there should be a tradeoff between the number of times information is stored and the requests, which cannot wait for replies. The drawback of such a database is that it needs to retain indexes. Therefore appending is easy, but updating and removing is dangerous.
When a top-50 request is made, the system will ask the batch view and the data stream view for the top 50 results since the last batch start time. The system will then compare the last entry of the batch view results and the first results of the data stream view. If the data stream results do not differ, it will return the response directly; otherwise, it will recompute the new response before returning it back to the user.
Another approach would be to use only the Spark stack with a Spark Streaming and to join them with a Spark Batch to publish the results. At the time of writing, this setup has not yet been tested, but this should be done soon.
Insight Into Deep Data Analytics Tools and Real-Time Big Data Systems
The best intelligence systems are very sophisticated. Many highly performing analytics or data-mining engines are used: correlation engines, predictive analytics, or monitored machine learning algorithms. SAAS, SPSS, KXen, Cognos, and numerous other tools have been used over the years to perform complex data analyses to produce results. I2 Analyst’s Notebook and Palantir are also used to handle and visualize information. We are not questioning these tools and their necessity. On the contrary, they belong to the tools located downstream of the system proposed in this book. Still, none of them can handle one-thousandth of the flows considered. Moreover, they are also not designed to operate in a “streaming” mode, which consists in executing algorithms iteratively on part of the data while taking earlier computations into account. Generally, to execute analyses or classification algorithms, these tools require all the data on entry. It is only recently that several new open-source projects have started to bring batch algorithms into new frameworks to process in streaming mode. This computation mode is essential, and we shall see how it is implemented later.
For these tools to support the heavy load of these data, three options are available:
1. The publishers transform part of the software to adapt them to Big Data using NoSQL data bases, streaming mode, parallelism, and scalability. This is a real challenge, presently not sufficiently met in roadmaps.
2. Only part of the data flow is accessible through the tools, the rest is sacrificed. The tool’s role is restricted/limited, and the analyst’s field is reduced in the case of correlation or obtaining specific query results. The results are partial or not reliable due to a lack of original/primary data.
3. Upstream enrichment processing is performed in Big Data to reduce the cardinality of the data injected in the tools.
We recommend option 3. It is necessary to apply part of the business rules upstream in the Big Data system. For conventional data mining tools, this option presents some difficulties on entry with regard to the integration and understanding of the added value and use of intermediate results.
Add Fault Tolerance
Each technology mentioned above has its own mechanism of fault tolerance that will replay data if a node fails. But what if your application is trying to aggregate events by time and by space—meaning you are not working anymore on a single event, but rather are waiting for multiple events to happen before getting a result? In this case you will have to keep the data until each event happened or before a timeout occurred. This timeout should be tuned to the algorithm. Such algorithms require a system that supports random reads and random write updates and deletes data very fast. At the same time, it should not keep data very long. A good candidate is Memcached, a distributed key-value store with load-balancing capacities. Because the open-source community lacks such solutions, we can mention commercial solutions such as VoltDB and SQL Fire.
In a time and space aggregation algorithm, you will store in Memcached the bucket (usually a Hashmap), which stores the waiting events. In case of a node failure, buckets will not be lost; instead they would simply be reloaded into a new node. To reload the bucket, the newly started node should request the key at initialization from Memcached, which will return the bucket list. The drawback of this method is that the bucket list should be serializable. Clearly, there is a trade-off between performance and missing elements. If you want best performance you will use an asynchronization client for Memcached. In this case, if a node fails, the most recent events would not be in sync. Therefore, when a node starts again you might have lost some information. In contrast, if 100% recovery is required, performance will be impacted.
Security
The Big Data world is still recent, and as such, technologies are not focusing their main efforts on the security aspects. Currently, the batch processing view supports communication security. Hadoop v2 Hbase and Cassandra have implemented encrypted communication with the help of certificates and Kerberos realm. However, looking at the streaming view, technologies are not security mature. Apache Kafka has just released a specification for the security aspect, but does not include it yet in the roadmap. Apache Storm and Spark do not include communication security. Therefore, security should be implemented at organizational level and technical level focusing on network security, isolation, and operating system hardening.
Adding Flexibility and Adaptation
When working with a large stack of middleware, there is a need to react quickly when facing event overloads. As cloud solutions are adopted more and more, such tools now exist, and it should be easy to obtain at least a configured operating system on demand. It is important to build the cloud catalogue services, because this will help provisioning snapshots in a short period. For each Big Data technology in a cluster, all nodes’ hostnames must be held in a configuration file. With the help of suites such as Chef, Puppet, and even Salt, it becomes increasingly easier to deploy the software mentioned above, because most of them have existing contributed modules. Therefore the combination of a cloudstack and a puppet suite helps the provisioning and reconfiguration of a cluster. The cluster orchestration should be developed according to procedures. It should support start, stop, and update at any time without impacting the production of Cloud and SaaS added values.
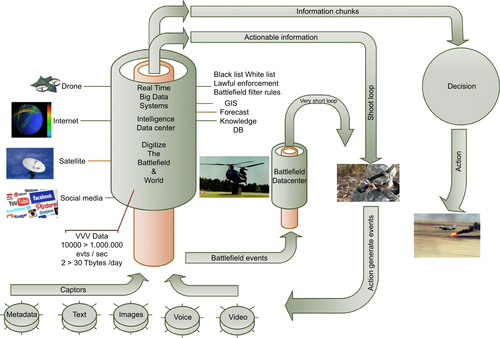
Very Short Loop and Battlefield Big Data Datacenters
It is likely that the digitalization of the battlefield will lead armed forces to install, in the field, computational means and devices powerful enough to meet the requirements and the data flow generated by all sources present on the battlefield. The anticipation of means/devices, which will allow a better view of the hidden reality through the digital world, more accurate predictions of movements, a monitoring of the operational level of fuel, batteries, remaining ammunition, as well as of the troops’ state of health and fatigue in real-time, will result in improved leadership in battle, improved conduct of operations, reduced loss of life, less disrupted supply chains, etc.
This is the reason why it is recommended that a superscalar datacenter (see Figure 7.4) be made available on the battlefield to drastically shorten the loop between sensors and users and to obtain real-time results with very low latency. Services rendered by the datacenter are so important that any break in the link with a central level becomes critical. Consequently, a loose cooperative mode is envisaged between the main datacenter and the battlefield datacenter, as well as a disconnected operational mode. In that case, there is an impact on the use: any user should be informed of the operational status of the systems used for the conduct of operations.
Conclusions
The Big Data field includes 3’Vs data, technologies and systems built with these technologies, and a specific architecture. To fully exploit the data, we have shown that the military can greatly benefit from reconsidering the quality and accuracy of the results according to the type of requirements. It is not a weakness, but a different relationship with time, space, and the digital world. Knowing how to obtain instantaneous results that are immediately useable from so much data becomes a strength. Then, as the duration of computation lengthens, the results increase in richness and accuracy, and they progressively enrich decisions and actions without any wasted time. There is no longer any waiting at the end of a long tunnel of computation, but a number of stages in step with the battle rhythm. The military analyst in his or her office and the troops on the ground penetrate more deeply into the digital world for a sharper view of the battlefield and its surroundings.
The Big Data technologies we have briefly described are operational. The architecture of the proposed system combine these technologies to bring them to the attention of our readers and provide pointers on how to build the new generation of Big Data systems, capable of processing the large quantities of data available within a time scale ranging from tenths of a second to several minutes. This chapter opens the way to quickly implemented solutions, sometimes breaking away from the traditional approaches of military intelligence, command systems, and logistics systems.
Breaking away does not mean throwing out existing applications, but rather replacing or building some radically different links, as well as dealing with the change in the approach to the battlefield. This change of approach has the support of the younger soldiers, who are familiar with the digital world and fully used to superposing it onto the real world of action and the triggering of fire. It is also certain that the multiplication of data sources—as previously described—is accompanied by a multiplication of ways to use the results of Big Data processing at all levels in the armed forces. The mobility of sources and terminals is an essential element, which should be factored into the impact of Big Data when exploiting results. Thanks to its potential capability for zero latency, the real-time Big Data system, as described in this chapter, adds decisive sharpness and augmented reality to the battlefield if, but only if, the information is instantly exploited by military analysts in an operation center and by troops close to the frontline.
..................Content has been hidden....................
You can't read the all page of ebook, please click here login for view all page.