

11.1 Comparative Data
The data presented in this chapter is intended to demonstrate the assets and liabilities of NEC-2 in practical applications to AM broadcast directional arrays. In addition to comparing some calculated and measured data, this chapter gives a few general opinions and suggestions that may be useful to increase the utility of NEC-2 for broadcast work.
11.2 Case Study 1: Three-Tower Array
The measured data on this three-tower, 850-kHz, 5 Kw-array was furnished by Jack Sellmeyer of Sellmeyer Engineering, McKinney, Texas. The NEC-2 calculations were done by the author.
11.2.1 Array Description: Three-Tower Array
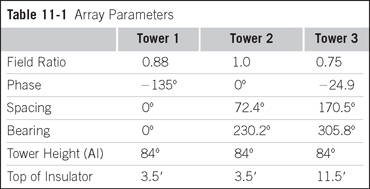
The array considered in this study has the parameters that are shown in Table 11-1.
11.2.2 Self-Impedance: Three-Tower Array
The towers were modeled using the simple single-pole configuration of Figure 3-1(c) with an estimated 20-pf capacity across the base insulator. As the data will show, reasonable agreement was obtained with this simple tower model.
NEC-2 runs were made to determine the passive self-impedance of each tower both with the companion towers open at the base and with the companion towers shorted at the base. In time, the self-impedance of each tower was measured under conditions similar to those used in the NEC-2 analysis.
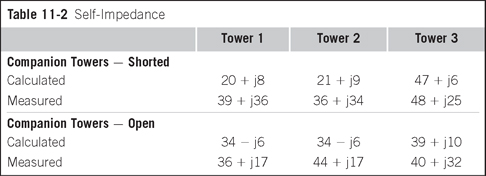
The calculated and measured self-impedances are tabulated in Table 11-2. While no attempt was made to modify the NEC-2 model to match the measured self-impedances, some analytical investigation was done in an attempt to learn more about the difference between measured and calculated self-impedances.
Table 11-2 shows that the self-impedance, as calculated with the companion towers open, are reasonably close to measured values except for tower 2. However, the self-impedance as calculated with the companion towers shorted differs significantly from the measured values.
Because towers 1 and 2 are closely spaced (72.4°) and tower 3 is further away (170.5°), we can expect the similarity that is shown in the impedances of towers 1 and 2 because the two towers are closely spaced and symmetrical in the tower layout. This similarity is quite obvious in the calculated results (20 + j8 and 21 + j9) and it is observable in the measured data (39 + j36 and 36 + j34).
We might also anticipate that the widely spaced tower 3 would measure close to its isolated self-impedance (38 + j40) either with the companion towers open or shorted, and it does that. It is not clear, however, why the closer spacing of towers 1 and 2 does not act to lower their measured impedance more dramatically when the companion towers are shorted, as it does in the calculated data. No reasonable model was found that duplicated those measured impedances.
11.2.3 Antenna Monitor Reading: Three-Tower Array
In this array, antenna monitor samples are taken from a toroid transformer at the output of the ATU. NEC-2 gives magnitude and phase of the current at that location. Thus, the expected antenna monitor readings can be estimated.
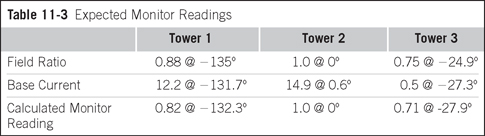
The current through a particular toroid can be normalized to the current through the reference tower toroid (which is tower 2 in this case) to yield the expected antenna monitor reading for that tower. In this instance, the data are shown in Table 11-3.
In the table, the expected monitor readings are listed along with the desired field ratios for reference.
11.2.4 Array Data: Three-Tower Array
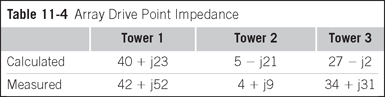
At initial tune-up of the array, the parameters were set such that the antenna monitor read the calculated values shown in Table 11-3 and the array drive point impedances were measured with results as shown in Table 11-4. Under these conditions, field pattern measurements revealed that only one specified radial was out of tolerance by about 7.5 percent. This out-of-tolerance condition was remedied by changing the phase of tower 3 by −7.5° (from a monitor reading of −27.9° to −35.4°).
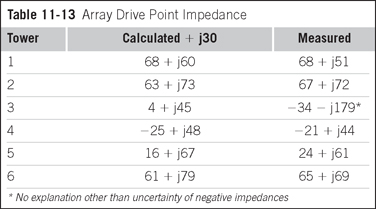
The resistive component of the drive point impedance shows reasonable agreement between calculated and measured with the major deviation being the 7-ohm differential of tower 3. The calculated reactive component is consistently low, however, and appears to follow the trend shown in earlier chapters. If this trend to be low is accepted as a characteristic of NEC-2, then one might define a rule-of-thumb that arbitrarily adds a positive reactance to the calculated result. And, based not only on this example but on the results shown in previous chapters, that reactance can be in the order of +j30 for towers near 90°
That rule-of-thumb is supported by the recognition that both the measured reactance and the reactance modeled at the tower base include the shunt reactance as imposed by the network of Figure 5-2(c). However, the measured values also included the series reactance leading to the base of the tower, whereas the model did not. The rule-of-thumb might be justified by considering that the +j30 rightfully adds the series reactance of the lead and any other series reactance that might appear in the measurement path. Applying that rule-of-thumb to this example yields the data shown in Table 11-5.
Designing to the calculated operating array drive point impedances even without the +j30 rule-of-thumb correction still led to networks that were close enough to the final requirement so as to allow a tune-up free of local minima problems.
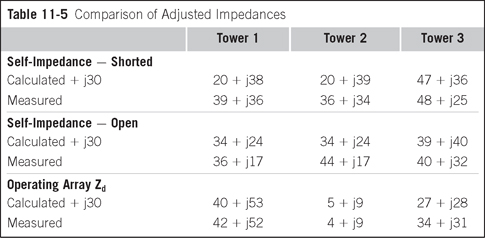
Although not absolutely essential, the correction factor appears to contribute a bit to make the calculated impedances better match the measured impedances and thus is a worthwhile addition.
11.2.5 Discussion: Three-Tower Array
Notwithstanding the lack of agreement between calculated and measured self-impedance, the calculated and measured array drive point impedances are in relatively good agreement. It is reasonable, then, to recognize that the drive point impedances are controlled more by the mutual coupling between radiators than they are by the modeling details of the individual radiators. That being the case, simple models might be used for the individual radiators and thus greatly simplify the NEC-2 input file.
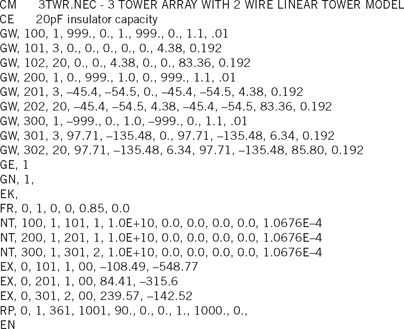
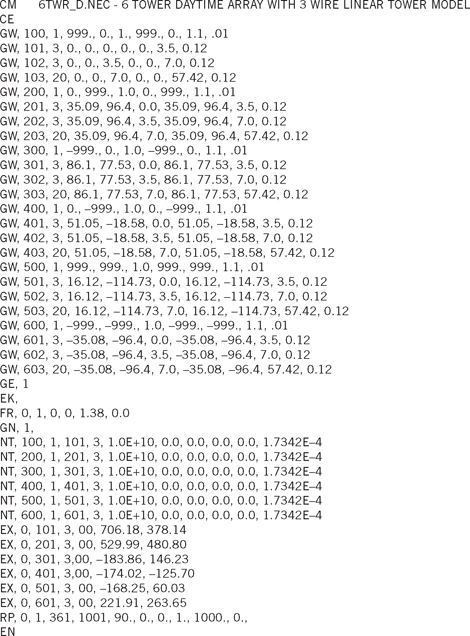
11.2.6 NEC-2 Input File: Three-Tower Array
Listing 11-1 is the input file used to generate the data presented in this study.
11.3 Case Study 2: Six-Tower Array, Day Pattern
The following measured data on a six-tower, 1380-kHz array was furnished by Jack Sellmeyer of Sellmeyer Engineering in McKinney Texas. The NEC-2 calculations were done by the author.
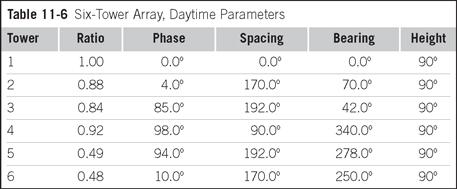
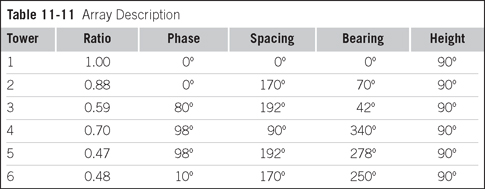
11.3.1 Array Description: Six-Tower Array, Day Pattern
The array discussed in this section has the parameters shown in Table 11-6 plus the following: frequency = 1380 kHz, power = 7000 watts, base insulator capacity = 20 pf.
11.3.2 Self-Impedance: Six-Tower Array, Day Pattern
The towers were modeled using the configuration shown in Figure 3-1(c) and taking 20 pf as the base insulator capacity
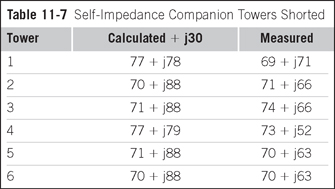
The self-impedance with companion towers open was not calculated for this case history. However, the tower self-impedance with the companion towers shorted is given as a by-product of calculating the drive voltages, so that data is available without further effort. Therefore, the calculated self-impedance with companion towers shorted, along with the corresponding measured values, are shown in Table 11-7. The arbitrary +j30 applied by rule-of-thumb as discussed earlier, has been included in these calculated values.
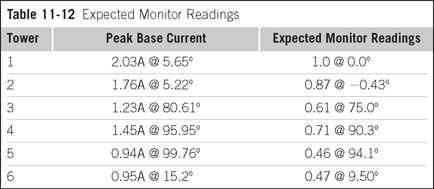
11.3.3 Antenna Monitor Reading: Six-Tower Array, Day Pattern
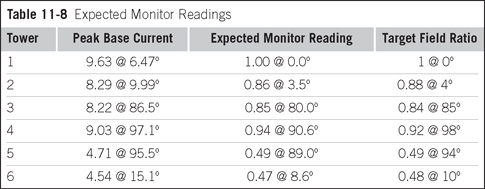
As in the preceding case study, this array takes its antenna monitor samples from toroid transformers at the output of each ATU. Also, as before, the calculated base currents are taken from the NEC-2 output file and normalized to the reference tower to obtain the expected antenna monitor readings. These are shown in Table 11-8 along with the target field ratios for comparison.
11.3.4 Array Data: Six-Tower Array, Day Pattern
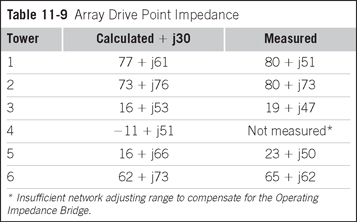
The initial adjustments set the array parameters to give the expected antenna monitor readings shown in Table 11-8. The array drive point impedances were then measured with the results shown in Table 11-9. The +j30 rule-of-thumb has been applied to the calculated values.
Table 11-9 gives a comparison of calculated and measured drive point impedances.
11.3.5 Discussion: Six-Tower Array, Day Pattern
Field measurements were made with the initial array adjustments as above. Three out of four specified radials were above the standard pattern. In addition, two radials were abnormally low. Upon review, it was recognized that another station operating on 1430 kHz had a four-tower array located only 3.54 km from the six-tower array at a bearing of 156.3° and that array had not been included in the NEC-2 analysis. This four-tower array was almost directly in the main lobe of the six-tower's radiation pattern thus the re-radiation from the four-tower array was indeed significant.
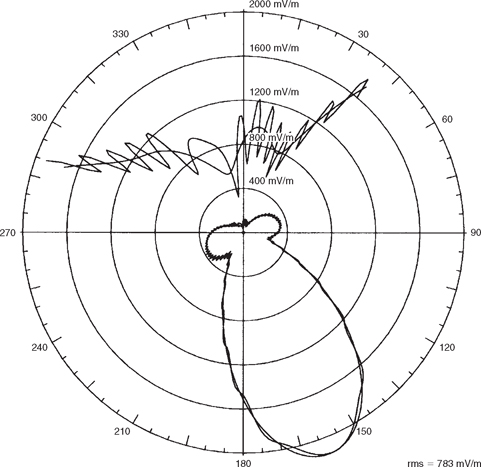
FIGURE 11-1![]()
Effect of parasitic radiation from remote four-tower array, daytime pattern.
The NEC-2 input file was modified to include all ten towers with the four towers of the 1430-kHz array terminated in the 1430-kHz conjugate drive point impedances as translated to the operating frequency of the six-tower array.
A theoretical pattern including all ten towers was plotted. This is shown as the undulating line in Figure 11-1 on the previous page.
The smooth line is the standard pattern of the six-tower array in the absence of the four-tower array. Notice that the undulating pattern is contained within the standard pattern of the six-tower array in all directions except for the northerly directions. From bearings of about 285° to 45°, the undulating pattern falls both above and below the six-tower standard pattern which suggests support for the measured field observations.
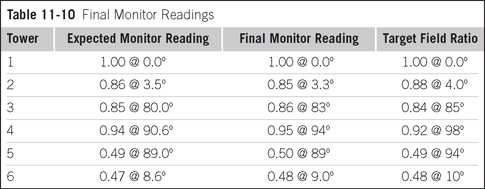
The pattern was “walked in” from these initial settings with a satisfactory adjustment being obtained on the second trial. Final monitor readings are listed in Table 11-10.
11.3.6 NEC-2 Input File
Listing 11-2 is the input file used to generate the six-tower NEC-2 data shown previously.
11.4 Case Study 3: Six-Tower Array, Night Pattern
The following measured data on a six-tower, 1380-kHz array was furnished by Jack Sellmeyer of Sellmeyer Engineering in McKinney Texas, and is companion data to the six-tower daytime array discussed in Section 11.3. The NEC-2 calculations were made by the author.
11.4.1 Array Description: Six-Tower, Night Pattern
This array is the same array discussed in the previous section with the exception that this array is operating with the night-time pattern and power. Frequency = 1380 kHz, power = 250 watts. Insulator capacity continues to be 20 pf. The array parameters are given in Table 11-11.
11.4.2 Self-Impedance: Six-Tower Array, Night Pattern
Because this is the same physical tower plant and self-impedances are measured with no drive signals, the self-impedances are not changed from those presented in Section 11.3.2.
11.4.3 Antenna Monitor Readings: Six-Tower Array, Night Pattern
Expected monitor readings are calculated as done in the preceding study. The results are tabulated in Table 11-12.
11.4.4 Array Data: Six-Tower Array, Night Pattern
During initial adjustments, the array parameters were set to give the expected antenna monitor readings shown in Table 11-12. With this adjustment, drive point impedances were measured as listed in Table 11-13, together with the calculated values for comparison. Following the rule-of-thumb established previously, a reactance of +j30 has been added to the calculated values with the results shown in Table 11-13.
11.4.5 Discussion: Six-Tower Array, Night Pattern
With the initial adjustment, the field strength at three of the twelve radials measured greater than the standard pattern with the worst being 34 percent high. Also, the field strength on another radial measured low, being approximately 66 percent of the standard value.
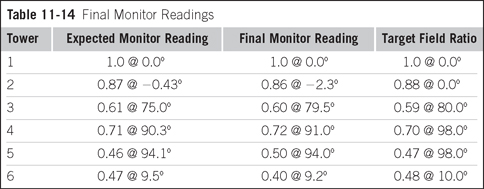
The pattern was “walked in” from these initial settings. Final monitor readings are listed in Table 11-14. The small changes that were necessary to the monitor readings could well be small shifts that moved the undulations caused by the re-radiation from the existing four-tower array, thus correcting the desired pattern as appropriate.
Being aware that the existing four-tower array influenced the day pattern, the nighttime theoretical pattern resulting from all ten towers was calculated and compared to the nighttime standard pattern. This is shown in Figure 11-2.
The undulations are most prominent in the third quadrant, but for the most part, the undulating pattern is contained within the standard pattern.
Detailed Measurements
To determine if the undulations actually occurred in the pattern as measured in the field, additional observations were made in the region of the 212° radial.
At a location 4.6 km out on the 212° radial, several field measurements were made transverse to the radial at 15-meter increments. This resulted in field measurements being made at approximately 0.2° increments, giving a detailed view of the measured pattern in that region. To obtain a comparison of measured and calculated data, a theoretical pattern was calculated at a distance of 4.6 km out the 212° radial. This gave the shape of the theoretical pattern in the vicinity of interest.
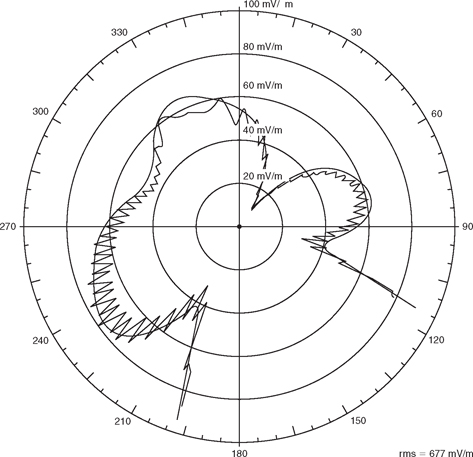
FIGURE 11-2![]()
Effect of parasitic radiation from remote four-tower array, night pattern.
However, the calculated pattern was made assuming a perfectly conducting ground, whereas the measured data was over a finitely conducting ground. Therefore, to correctly superimpose the calculated pattern upon the measured pattern, the calculated data was scaled by the ratio of measured data and calculated data at the 212° radial. These results are plotted in Figure 11-3.
It appears that a partial cycle of undulation is indeed superimposed upon the undistorted pattern in this region, suggesting that the four-tower array does influence the radiation pattern of the subject six-tower array.
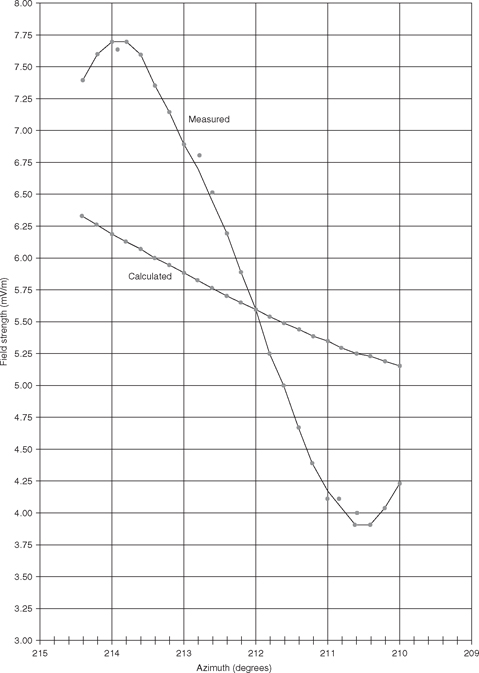
FIGURE 11-3![]()
Detail of measured and calculated fields near the 212° radial.
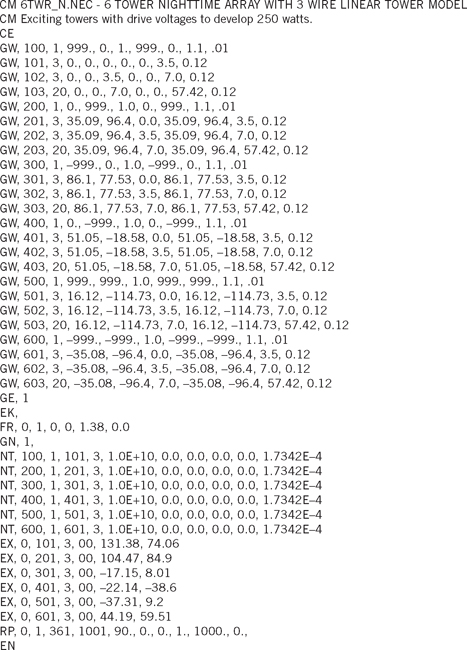
11.4.6 NEC-2 Input File: Six-Tower Array, Night Pattern
Listing 11-3 is the NEC-2 input file used to generate the six-tower data.
11.5 Case Study 4: Tall-Tower Array
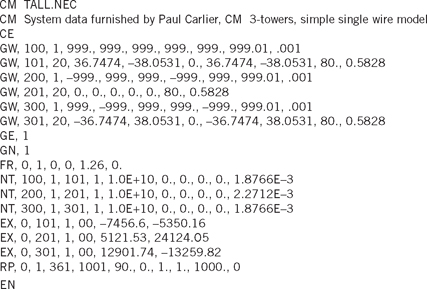
The measured data shown in this study was furnished by Paul Carlier of FanField, Ltd, in the United Kingdom. The NEC-2 calculations were done by the author. The NEC-2 analysis was done after the fact with limited measured data furnished to contrast with the calculations.
11.5.1 Array Description: Tall Towers
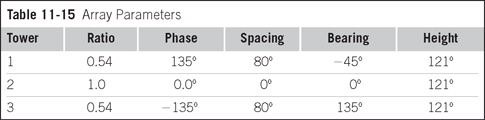
This is a 500-kw high-power array operating at 1260 kHz with 121° towers. The array parameters are given in Table 11-15.
Each tower base insulator is shunted by a sample line isolation choke whose calculated inductance is 253.25 μH (XL = j2005) plus a ring lighting transformer whose capacity, plus the stray capacity was estimated to be 300 pf (Xc = − j421). Tower 2 uses a rain shield on the lighting transformer, so its total capacity was increased to 350 pf (Xc = − j361).
The tower 2 matching network is located inside the transmitter building, so the drive point impedance of tower 2 was actually measured at a point inside the building.
The towers were modeled using the simple single wire configuration of Figure 3-1(c). The parallel L-C combination at the base of towers 1 and 3 has a net calculated reactance of −j532.89 and the net base reactance at tower 2 is −j440.29.
11.5.2 Self-Impedance: Tall Towers
No self-impedance calculations were made on this array.
11.5.3 Antenna Monitor Readings: Tall Towers
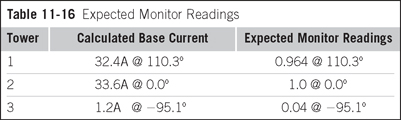
The actual height of the sample loops and the associated antenna monitor readings were not included in the measured data furnished to this study. The NEC-2 output file indicates that the antenna monitor readings will closely indicate representative field values if the loops are placed a distance of 80 feet above ground. On the other hand, if it had been elected to use current transformers to monitor the current at the output of the matching network, the monitor readings would have been significantly different. Table 11-16 lists the expected monitor readings; although with relatively tall towers and only estimated values for the base shunting reactance, the calculated monitor readings are of questionable accuracy.
11.5.4 Array Data: Tall Towers
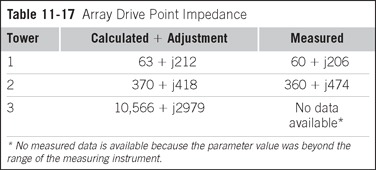
Because the operating impedance was measured through the long lead-in (into the transmitter building in the case of tower 2), the rule-of-thumb correction was modified to a calculated value determined by the estimated length of each lead-in including its lightning arrestor choke. This resulted in a correction of +j22 for towers 1 and 3 and a correction of +j53 for tower 2 instead of the general +j30. The resulting NEC-2 calculated drive point impedances as adjusted, together with measured values are as shown in Table 11-17.
Notice that the impedance of tower 3 and its associated shunt reactances formed a parallel resonant circuit, which resulted in the extremely high base impedance.
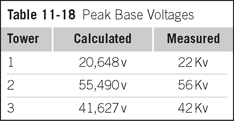
The base voltages were calculated by NEC-2 using the power budget as calculated for each tower of the operating array. The table lists peak values adjusted for 125 percent modulation.
11.5.5 Discussion: Tall Towers
A complete set of descriptive data was not available for this case study so a number of assumptions and approximations were necessary in making this analysis. However, notwithstanding these shortcomings, it appears that the calculated results are a usable approximation of the actual results and gives a worthwhile demonstration of NEC-2's capability.
11.5.6 NEC-2 Input File: Tall Towers
The complete input file used in the calculations of this section is shown as Listing 11-4.