3.11. Review: Another Event-Response
Sample Event-Response Model for Event 1
Our physical event-response model is shown in Figure 3.11.1, which you should compare with your own.
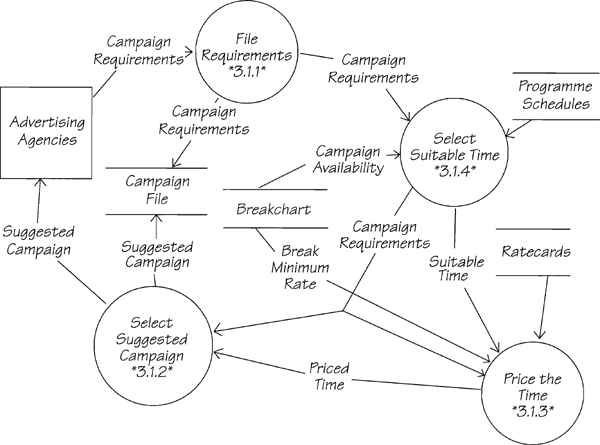
Figure 3.11.1: The current physical response to the event Agency wants to run a campaign. The data stores in this model are physical data stores in the current Piccadilly system. Eventually, you will refine the model and replace these physical stores with their essential equivalents.
The response to event 1 involves four processes and touches several data stores before delivering its final output data flow to the terminator ADVERTISING AGENCIES. If you didn’t have all these processes in your model, remember the rule that the processing for an event-response is continuous until the data flows concerned with that event reach either a terminator or a data store.
The model as it appears here is quite physical. It shows, as much as possible, the method that sales executives use to plan campaigns, and it’s what you’d see if you were standing in the Piccadilly offices. This is a cautious approach. First, build a physical view of the event-response and then, having confirmed it with the users, advance to the essential view.
If you’re satisfied with your model, and have resolved all differences with ours, reread “Your Strategy” in Chapter 1.12 Another Event-Response for advice on building the essential view of this event-response. If your model is already in an essential state (because you started with an essential viewpoint and used essential data instead of the current physical files), jump over the ![]() Ski Patrol section to the next section.
Ski Patrol section to the next section.
 Ski Patrol
One of the main problems with building event-response models is knowing when to stop. Think of the event-response as being surrounded by terminators and data stores. When the boundary data flow enters, the system spreads out like an octopus—the data flow tentacles reach out to entangle processes and are stopped only by the barriers of data stores and terminators. Read through the interview in Chapter 1.12 again and this time whenever Dollis mentions a process, ask yourself, “Does this process send any data flows to other processes?” If the answer to the question is yes, you know the response is not yet over. Follow each flow to the next process and ask the question again.
If a data flow leads to a store or terminator, you have finished tracking that part of the event-response. Go back over the event-response model, and the interviews, and the current physical models, until you understand why these processes and data stores make up this event-response. After doing that, check out the idea of linking the processes in Chapter 2.11 Event-Response Models.
In any case, make sure that you are comfortable that the sample answer is an accurate representation of what happens inside Piccadilly when an agency wants to run a new campaign. The next step is making the essential version of the event-response model. If you aren’t feeling confident about your essential skills, review Chapter 2.10 Essential Viewpoint before returning to the Project.
Ignoring Physical Details
We suggested that a way to turn the physical model into an essential one is to replace all the current physical files with essential entities from the preliminary data model. First, you need to look at the content of the data flows to know what data are being accessed. Figure 3.11.2 shows the physical processes accessing stores of the equivalent essential data entities from Figure 3.6.10.
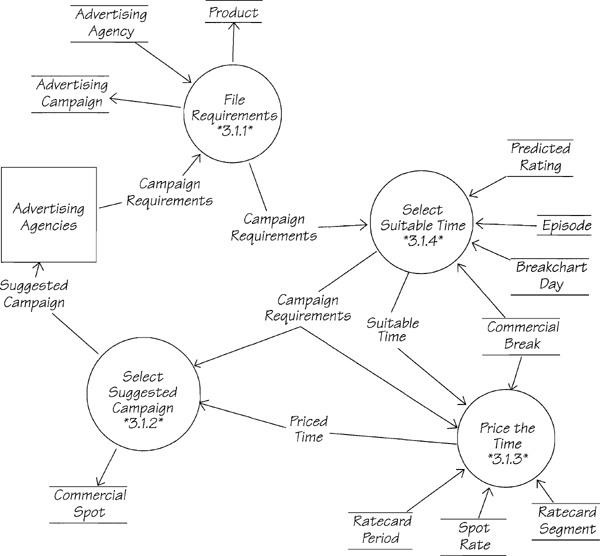
Figure 3.11.2: The first modification to the current physical event-response model. The files have been replaced with entities from the data model.
Be aware that as we look more closely at the processing for this event-response, we may need to make corrections to the preliminary data model. Your first question may be, “How did we select these entities to replace the physical files?” The event-response needed to react to the incoming data flow that triggered the processing. The data dictionary definition for this flow gave us
Campaign Requirements = * Data flow. An agency’s description of requirements for an advertising campaign. *
Agency Name + Product Name + Campaign Budget Total
+ Piccadilly Budget Amount + Target Audience
+ Target Rating Percentage + Campaign Duration
+ Campaign Start Date + Campaign End Date
+ {Required Spot Duration}
Each of these elements must be stored or used. For each of the processes, we determined what data they needed. We then looked for a suitable entity in the data model. If one was not available, we created one and noted its attributes. The first bubble was fairly easy: AGENCY NAME from the data flow was used to reference AGENCY NAME from the ADVERTISING AGENCY entity, PRODUCT NAME was stored in the PRODUCT entity, and the remainder of the flow was stored in ADVERTISING CAMPAIGN.
The process SELECT SUITABLE TIME needed to match the CAMPAIGN REQUIREMENTS with the entities that are the logical equivalent of BREAKCHART and PROGRAMME SCHEDULES. The stores that we show in Figure 3.11.2 are the entities from the preliminary data model that provided the needed data. If this seems as if it is being done with smoke and mirrors, go through the dictionary definition of these entities, and check for yourself that they reconcile with all the elements of the data flow.
Before going on, make sure that you can justify the selection of the entities that we have used to replace the files. Once the essential data are incorporated into the model, the processes can be examined to determine if they are essential or are dependent on the implementation.
In Figure 3.11.2, consider why the sales executive records the campaign requirements in the file before selecting and pricing the time. The reason is that it takes the executive a period of time, sometimes several days, before he finishes planning the campaign and then advises the agency of his suggestions. Since every executive is busy and is interrupted frequently and doesn’t want to risk forgetting the agency’s requirements, he writes them in the campaign file. But isn’t that to do with the implementation, which is a relatively slow, fallible human? If the system doesn’t have to be concerned with the limitations of a processor, things would be different.
Also consider that if there were no available airtime or if the agency’s budget were insufficient, there would be no campaign and no need to record the campaign requirements. So, essentially, the campaign requirements do not have to be recorded until a campaign has been arranged. Take the FILE REQUIREMENTS bubble off the model for the moment. You can reintroduce the necessary process after the campaign is selected.
The physical model shows us that the campaign requirements are used to select the suitable time. What happens if no time is available? If the executive cannot find enough time for the campaign, there must be some communication with the agency. After all, the executive can’t just walk away and forget the campaign. So there must be some rejection flow; let’s call it UNAVAILABLE CAMPAIGN and show it from SELECT SUITABLE TIME to ADVERTISING AGENCIES.
The current physical model misses this flow. Dollis Hill forgot to tell you what happens when things don’t go as planned. This kind of thing happens all the time in systems analysis. If you missed it here, you would have picked it up when you wrote the mini specification.
The process PRICE THE TIME is essential. Before the final suggestions of the campaign can be formulated, the system must be able to append a price to each of the suitable time slots. Although you could have an essential model that combined SELECT SUITABLE TIME and PRICE THE TIME into one bubble, the complexity of the piece will help you make this decision. If the resulting mini specification is too complex, you must break the process into two.
What about the requirement to record the campaign requirements? The answer must now be that the requirements will be committed to the system’s memory only when the system is certain that it is able to offer the agency a campaign. So it is appropriate to record the campaign requirements along with the suggested campaign as part of the final process of the event-response. We call this process CREATE SUGGESTED CAMPAIGN.
The resulting model is shown in Figure 3.11.3. The data flow CAMPAIGN REQUIREMENTS flows to 1.1 SELECT SUITABLE TIME and 1.2 CREATE SUGGESTED CAMPAIGN because all the data in the flow are needed by both processes. However, the data are not needed by 1.3 PRICE THE TIME. The physical model showed CAMPAIGN REQUIREMENTS traveling to every process because the executives carried the agency’s letter around with them. In the essential model, each process obeys the Rule of Data Conservation and only receives the data that are necessary for it to carry out its policy. In this case, 1.3 PRICE THE TIME only needs the SUITABLE TIME to do its essential task.
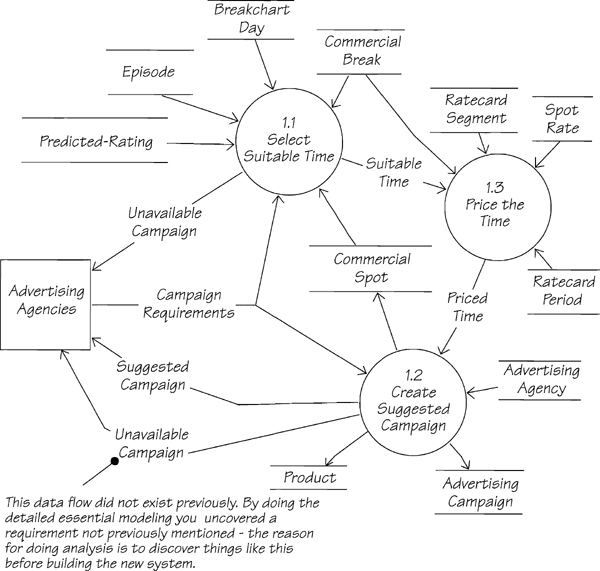
Figure 3.11.3: This refined version of the event-response process model shows only essential processes and essential data. Note that the three bubbles have been renumbered to indicate they are part of the response to event 1.
Note the new data flow UNAVAILABLE CAMPAIGN being generated by two bubbles. It can occur first when there is no available time for the campaign, and later when the suggested campaign is being created if the executive discovers that the budgets and targets cannot be met by the price and ratings of the time Piccadilly can make available.
The flows to and from the entity data stores are unnamed as a way of minimizing the complexity of the model. The informative, subject-specific names that you have given to the entity stores make the model’s purpose understandable. The mini specifications will specify exactly which data elements are used by each process.
Make sure you can reconcile all the data stores and flows before proceeding.
Connecting to the Data Model
In this refined model (Figure 3.11.3), each access to a physical file was replaced by the essential data entities and relationships used by that access. You can see the essential data in a different way.
In the unrefined event-response model in Figure 3.11.1, the process SELECT SUITABLE TIME is using two physical files: PROGRAMME SCHEDULES and BREAKCHART. Does the bubble really need all the data in both those files to do its job? No, but the current design of the files provides all the data, whether the process needs it or not. Essentially, the bubble is looking at each EPISODE that is associated with a BREAKCHART DAY within the proposed campaign period. The PREDICTED RATINGS for the EPISODE are used to decide whether the COMMERCIAL BREAKS during the programme suit the CAMPAIGN REQUIREMENTS. The bubble determines how much time is available in each COMMERCIAL BREAK by deducting the duration of each COMMERCIAL SPOT that is currently OCCUPYING the break.
By looking outward from the process to the stored data, we can determine all of the essential data for the process. To do it this way, you need to have the data already rationalized into entities and to know the attributes of the entities. We used the data model and data dictionary from Chapter 3.6 to help us with our task. If you had not built a first-cut data model, you would start from scratch and build a data model that is solely concerned with this event’s data. Figure 3.11.4 is the event-response data model for this event.
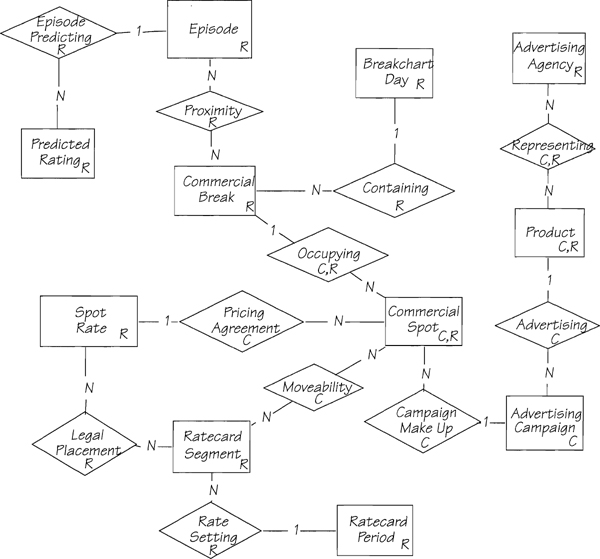
Figure 3.11.4: The event-response data model for event 1. Due to the size of most system data models, we find it easier to focus on the details if we build a separate data model for each event-response. Later, you can combine all the event-response data models to form a system data model.
If you haven’t already done so, complete your essential event-response process model by ensuring that each of its data stores is equivalent to a data entity or a data-bearing relationship in the event-response data model.
The event-response data model is an accurate representation of only some of the system’s essential stored data. This means that you must now reexamine your system data model to ensure that it harmonizes with the smaller event-response version. If you find a difference between them, the event-response model is the correct one. Eventually the combination of all your event-response data models will provide an accurate system data model.
Conversely, the system data model is an aid in building your event-response data models. Use it to get an idea of what data the event needs, and then refine your ideas by asking detailed questions about the real policy of the system. With the distraction of the implementation out of the way, you can concentrate on the essential processes and data needed by the system.
Defining the Essential Activity
An essential activity model is a one-bubble event-response process model. Figure 3.11.5 shows the essential activity model for event 1.
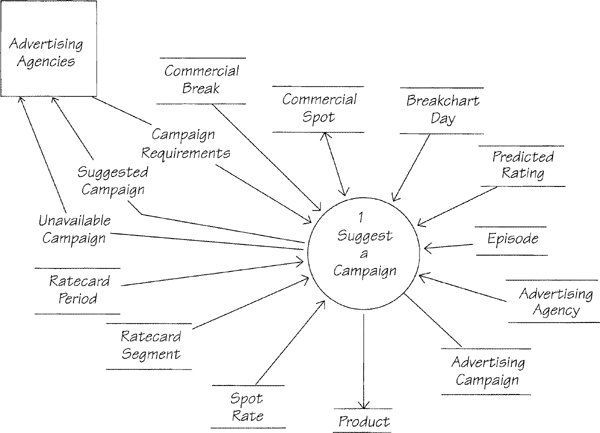
Figure 3.11.5: The essential activity model for event 1. This model was produced by leveling the event-response process model upward and showing it as one essential activity. The numbering of the process ties this model to event 1.
Analysts use essential activity models because they are more manageable, and are quicker to build than a detailed event-response model. You will find that you can often specify event-responses with one process. Try starting each of your event-response models by drawing this one-bubble model. It should show all the essential data needed by the activity, but the details of the processing may remain hidden for a while. You can level downward as you need to.
This top-down approach lets you see an overview of the event-response before plunging into the details. When you have an essential activity model, consider if it is possible to write a suitable mini specification for it. What looks like a complex physical model, may, in fact, turn out to be a simple essential process and can be specified without any further partitioning.
Speaking of mini specifications, we asked you to write a mini specification for the processes in your essential event-response model. Here are the ones we wrote.
Mini specification 1.1 Select Suitable Time
Input: CAMPAIGN REQUIREMENTS
With reference to the event-response data model
Find the COMMERCIAL BREAKs with a CONTAINING relationship to BREAKCHART
DAYs that lie within the CAMPAIGN START DATE and the CAMPAIGN END DATE
For each COMMERCIAL BREAK
Derive AVAILABLE SECONDS
If AVAILABLE SECONDS > 0
Derive AVERAGE BREAK PREDICTED RATING
If AVERAGE BREAK PREDICTED RATING >= TARGET RATING
PERCENTAGE
Add defined data to SUITABLE TIME
If > 1 break has been added to SUITABLE TIME
Issue SUITABLE TIME
Otherwise
Issue UNAVAILABLE CAMPAIGN
Output: SUITABLE TIME, UNAVAILABLE CAMPAIGN
Mini specification 1.2 Create Suggested Campaign
Input: CAMPAIGN REQUIREMENTS, PRICED TIME
With reference to the event-response data model
Select SUGGESTED CAMPAIGN from PRICED TIME according to CAMPAIGN REQUIREMENTS * This job relies on the skill and experience of the sales executive *
If a SUGGESTED CAMPAIGN can be built
Create an instance of ADVERTISING CAMPAIGN
If PRODUCT NAME does not match an existing PRODUCT
Create an instance of PRODUCT
Create a REFRESENTING relationship between PRODUCT and
ADVERTISING AGENCY
Create an ADVERTISING relationship between PRODUCT and ADVERTISING CAMPAIGN
For each SPOT DURATION added to the SUGGESTED CAMPAIGN
Create an instance of COMMERCIAL SPOT
Create a CAMPAIGN MAKE UP relationship between COMMERCIAL SPOT and
ADVERTISING CAMPAIGN
Create a PRICING AGREEMENT relationship between COMMERCIAL SPOT and
each RATECARD SEGMENT that matches the RATE MOVEABILITY of that
COMMERCIAL SPOT
Issue SUGGESTED CAMPAIGN
Otherwise
Issue UNAVAILABLE CAMPAIGN
Output: SUGGESTED CAMPAIGN, UNAVAILABLE CAMPAIGN
Mini specification 1.3 Price the Time
Input: SUITABLE TIME
With reference to the event-response data model
For each BREAK START TIME
Match the BREAKCHART DATE and BREAK START TIME and CURRENT RATE
with the RATECARD PERIOD and RATECARD SEGMENT and SPOT RATE
Derive TOTAL AVAILABLE PRICE for CURRENT RATE
Output: PRICED TIME
Ski Patrol
The hardest part of this exercise is recognizing what is essential, and what is implementation dependent. This is also probably the hardest thing to do in analysis, and where analysts make most of their errors. Time and experience will be valuable in helping you to avoid errors. After all, essential modeling is not something that you can learn in a day. Also keep in mind that when you are doing this on your own projects, you have the opportunity to discuss the essence with your fellow analysts and users. (Don’t forget the users. They are often very good at separating essence from implementation.)
We’ve given you a detailed description of how we derived the essence of this event. At this stage, if you are not satisfied with your ability to identify the essential processes and data, review the models and the description. Evaluate each stage of the refinement, with the aim of understanding why each component is essential. We hesitate to send you elsewhere, but Chapter 2.10 Essential Viewpoint may be of some help here.
If data models are bothering you, try some remedial action, returning to Chapters 2.4 Data Viewpoint and 2.5 Data Models for a quick review. Since you are no longer bothered by why you want them, now you are learning how to build them.
Whatever you do, hang in there. There will be many more opportunities to practice working with this kind of model, and lots more examples to learn from.
Trail Guide
![]() Easiest,
Easiest, ![]() More Difficult, and
More Difficult, and ![]() Most Difficult: Go to Chapter 1.13 More Events, where you will model the remaining events for the Piccadilly system.
Most Difficult: Go to Chapter 1.13 More Events, where you will model the remaining events for the Piccadilly system.
![]() Promenade: The other trails lead to a lot of work. If you are a genuine promenader, you have just come here for a stroll through the subject, and are probably not interested in doing that much work. As you have already seen the essential models, Chapter 2.13 Modeling New Requirements is an appropriate destination.
Promenade: The other trails lead to a lot of work. If you are a genuine promenader, you have just come here for a stroll through the subject, and are probably not interested in doing that much work. As you have already seen the essential models, Chapter 2.13 Modeling New Requirements is an appropriate destination.