Health Center/Health Monitor Tool
With v8, DB2 UDB introduces the Health Center, which replaces the performance monitor capability of the Control Center.
The Health Center is simply a tool to monitor the health of your system. It is used to monitor the state of the database environment and make any necessary changes to address health issues before they become real problems that affect your system's performance.
The Health Monitor is a server-side tool that constantly monitors the health of the instance, even without user interaction. If the Health Monitor finds that a defined threshold has been exceeded (for example, the available log space is not sufficient), or if it detects an abnormal state for an object (for example, an instance is down), the Health Monitor raises an alert. Depending on the configuration of the DB2 instance, the following actions can occur when the Health Monitor generates an alert:
An entry is written in the administration notification log, which you can read from the Journal.
The health center status beacon appears in the lower-right corner of the DB2 graphical user interface (GUI) Tools window.
A script or task is executed.
An email or pager message is sent to the contacts that you specify for this instance.
NEW
DB2 UDB v8 introduces two new features to help you monitor the health of your DB2 systems: the Health Monitor with the Health Center, and the Web Health Center.
DB2 comes with a set of predefined threshold values, which you can later customize. For example, you can customize the alarm and warning thresholds for the amount of space used in a table space. The following are some of the key tasks that you can perform with the Health Center:
View the status of the database environment. Beside each object in the navigation tree, an icon indicates the most severe alert for the object (or for any objects contained by that object). For example, a green diamond icon beside an instance means that the instance and the databases contained in the instance do not have any alerts.
View the alerts for an instance or a database. When you select an object in the navigation tree, the alerts for that object are shown in the pane to the right.
View detailed information about an alert and the recommended actions. When you double-click an alert, a notebook appears. The first page shows the details for the alert. The second page shows any recommended actions.
Configure the Health Monitor settings for a specific object, and the default settings for an object type or for all objects within an instance.
Select which contacts will be notified of alerts with an email or pager message.
Review the history of alerts for an instance.
Display only alarms (the most severe type of alert).
Display alarms and warnings.
Display alarms, warnings, and attentions.
Display all alerts.
NOTE
The Web version of the Health Center, “Web Health Center,” includes a subset of these features and it can be used to access the Health Monitor information from a Web browser or PDA.
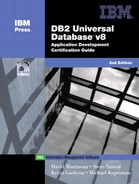
In the example shown in Figure 2.5, the Database Sample was configured with a low warning value of 30 for the “Percentage of Sorts that Overflowed” in the Health Indicator Settings.
Figure 2.5. Health Indicator Settings.

After issuing an SQL command that required extensive sorting against the Sample database, an alarm was recorded in the Health center, as shown in Figure 2.6. If the alert, in the Health Indicator pane of the Health Center is expanded, the tool will provide the user with further information about the alert and recommended actions.
Figure 2.6. DB2 Health Center.
