C h a p t e r 1 4
Module 6—The Analytic
Process: Narrowing
Down the Options
Module 6 focuses on gathering information to make an effective decision. It should be used with programs of a half-day or longer (except the half-day program for managers and supervisors).
Training Objectives
After completing this module, the participants should be able to
- identify significant sources of data for decision-making analysis
- determine the value of collecting additional information
- explain and use the concept of Pareto analysis.
 Module 6 Time
- Approximately 1 hour
Note: This schedule includes time for a quick review at the start and a learning check at the end.
Materials
- Attendance list
- Pencils, pens, and paper for each participant
- Whiteboard or flipchart and markers
- Name tags or name tents for each participant
- Worksheet 14–1: Sources of Information
- Computer, screen, and projector for displaying PowerPoint slides; alternatively, overhead projector and overhead transparencies
- PowerPoint slide program (slides 14–1 through 14–12)
- This chapter for reference or detailed facilitator notes
- Optional: music, coffee or other refreshments.
Module Preparation
Arrive ahead of time to greet the participants and make sure materials are available and laid out for the way you want to run the class.
Sample Agenda
| 0:00 | Welcome class. |
| Have slide 14–1 on the screen as participants arrive. | |
| 0:05 | PPT presentation. |
| Begin with slide 14–2 (objectives) and proceed through slide 14–9. See notes on PowerPoint file and in the trainer’s notes (below). | |
| 0:35 | Worksheet. |
| Distribute Worksheet 14–1: Sources of Information. | |
| Show slide 14–10 as the participants work on worksheet. | |
| Move among participants to keep them on task. | |
| Have the participants discuss answers with others in the class. | |
| 0:55 | Wrap-up. |
| Show slide 14–11. Review the objectives with participants. | |
| Ask for questions. | |
| Check for learning (questions can be in oral or printed format). | |
| Show slide 14–12. Dismiss the class. |
Trainer’s Notes
8:00 a.m. Welcome (5 minutes).
Show slide 14–1 as participants arrive.
Take care of any review and housekeeping items.
8:05 a.m. Gathering Information (15 minutes).
Show slide 14–2 and quickly preview the module topics.
Show slide 14–3. Tell the learners that this section is on gathering information; then provide the following overview: You will usually be aware of the obvious sources of information that will inform your options in decision making. The sources are often unique to the nature of the problem you’re trying to solve. The information may be internal to your organization, but sometimes you may need to go to sources outside your department, company, or industry. You will use both primary and secondary data to make your decisions.
Whether internal or external, all information comes from some form of “research.” In some cases, you may need to create and collect primary data. Primary data comes from basic experimentation. Primary data should be tested, and you must judge performance before you use it. Quality control testing is one example of collecting primary data. So is designing and conducting a survey.
Much of our decision-making information, however, comes from secondary data, or data collected by someone else, often for some other purpose, but that is usable for our decision. Examples of secondary data include information from catalogs, census reports, directories, and so on.
For example, for buying a car, we would probably gather both primary and secondary data. For secondary data, we would look up information in publications such as Consumer Reports or Car and Driver. For primary data, we’d probably visit a showroom for a test drive and to get other sensory perceptions. Obviously the sources we use for the data depend on what we need to know, what’s available in secondary sources, how easily and inexpensively we can get it, among other factors.
What do we really need to know in order to make a decision? On most decisions, there will be many pieces of information that we could collect. But generally we will want to collect only data that’s going to be of use to us.
For example, if you’re ready to buy the car, you could check hundreds of things about each option, including fuel tank capacity, length of the windshield-wiper blades, and many other obscure criteria. But why? We want to get only enough information to make a good decision, but not so much as to overwhelm us or cloud the issue.
Experts tell us that one major reason for poor decisions is too much data. This is particularly true since the advent of the computer. It’s now possible to analyze information easily and report it quickly; however, it may still not all be good information or information we need to make a decision. (Reportedly, one of the major reasons U.S. Defense Intelligence people missed some of the weapons development in North Korea was “data pollution.” They had too much information to sort out what they really needed to know. That’s often the case, and we must take care to sort out what’s really important.)
Secondary data is nearly always cheaper than doing testing on your own. If secondary data is available in a form that applies to your decision, take advantage of it.
If we’re buying a new piece of equipment, secondary data sources would include promotional literature from the manufacturer. We expect this to be biased, and if we’re looking at several pieces of equipment, the promotional information from each manufacturer might not allow us to make a clear comparison with other products. Perhaps we can find some objective comparison published in a periodical. Consumer Reports is a well-known publication that does this, but it only covers merchandise of interest to the general public. This is not much help when we want to compare commercial or industrial equipment options.
Once upon a time, finding information in periodicals meant going to the library and either thumbing through the tables of contents of issues on file or finding the annual index. Today, the search of these references is largely done through hundreds of commercially available online databases and websites that quickly help find information on any topic imaginable. Detailing the use of these resources is beyond the scope of this course. We say that with a note of caution, however, because although the Internet has become an amazing resource for research, it requires skill to separate the fact from the fiction in what we find there. The typical Internet search is confounded by two issues: volume and credibility. Enter a search term or question in most of the search engines and a typical inquiry may come back with thousands of references. Some may be very credible, but others have been posted by the 10-year-old kid down the street. It’s not enough to find information on the Internet; you must also be able to verify its accuracy. Most libraries can help you learn how to reach appropriate resources and minimize the volume issue through appropriate searching techniques.
8:20 a.m. How Much Information? (15 minutes).
Show slide 14–4. Point out to the participants that it is impossible to look at every possible car you could buy before you make your choice. Thus, part of the evaluation process is to decide “how much data is enough?”
Sometimes we can determine the exact number of available choices. When this happens, we have a known population or known universe. Most choices we make come from finite, rather than infinite, populations, but known populations of options can still be quite large.
In some decision-making exercises, we narrow down the population by putting increasingly restrictive limits on our options until we reach a small enough number or narrow enough focus that we can deal with it. In other cases, we may have to remove limits in order to increase the potential choices we have available.
For example, when we’re looking for a car to buy, we keep adding (or sometimes dropping) limits until we get to a reasonable number of cars available to consider. We probably start with price and style (sports model or minivan, and so forth), and then we further limit the number available by deciding we’ll only buy from certain dealers, and we must have certain options such as an automatic transmission or a cup holder. The effect is to reduce the number of available cars we’ll really consider. When we get the population of options down to a manageable number, then we really begin to compare.
Sometimes, though, when we’re gathering information for analysis, we can’t add limits to the population. For example, if we’re checking on quality control, we can’t decide to check parts from only one machine. On the other hand, we can’t check all parts from all machines, because that would be too time consuming and expensive … and sometimes impossible. Did you hear about the company that went out of business because the boss demanded 100-percent inspection and testing of every ink jet cartridge it produced?
So, when do we have enough information? The answer to this requires us to consider the amount of risk involved in the decision we must make.
Show slide 14–5.
Read the slide to the participants. Malcolm Gladwell, in his bestselling book Blink, tells us that even when we try to back up our decisions with research and expert opinion, we can still never be certain we have made the right choice. Most decisions are truly a matter of the “best guess.”
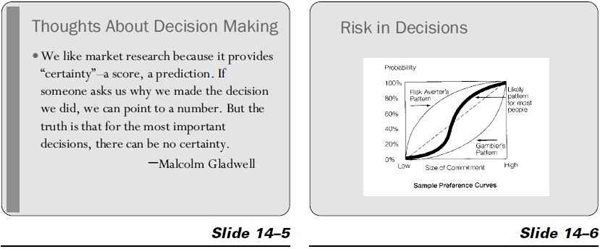
Show slide 14–6.
Note: This slide was used before in module 2 (slide 2–10). It is repeated here, and you may choose to use it or not. If participants have seen it recently and understood it, you should delete it or cover it very quickly.
How much risk are you willing to take? Are you a “risk averter” or a “gambler”? A key point in this module is to find ways to reduce the risk. We need to gather information to help us narrow down the options, but what information and how much information? One way to help narrow this down is through the use of Pareto analysis.
Show slide 14–7.
One way to evaluate the importance of a piece of data is a concept called Pareto analysis. Although it’s named after a mathematician (Vilfredo Pareto, a 19th-century Italian mathematician and philosopher), it’s not really a statistical analysis. You may know of Pareto analysis as “the 80-20 rule” and that it is often used in inventory planning and elsewhere.
Pareto suggests that typically about 80 percent of the activity comes in 20 percent of the participants, whereas about 20 percent of the activity comes in the other 80 percent of the participants.
To demonstrate this, consider the telephone calls you received last year: 80 percent of them may have come from 20 percent of your callers. The other 20 percent of the calls came from the 80 percent of the people who called you once or twice during the year. Is this precisely accurate? Of course not, but the generalized concept is probably true.
How do you spend time in the various rooms in your home? Probably a few rooms make up most of your time; and certain rooms you seldom visit. If you run a grocery store, a large part of your sales comes from a small part of your stock. Milk and bread may make up less than 1 percent of your stock in units or price, but 7 or 8 percent of your sales volume.
Pareto analysis, then, is looking at a collection of data and striving to distinguish the “significant few” from the “trivial many.” In this way, you are able to prioritize and focus on areas where your efforts can be most rewarded. For example, if you change phone numbers, notifying just a few key people will mean that most of your calls will be received correctly. If you don’t have time to clean the whole house, cleaning only the most used rooms will give you the greatest peace of mind. If you’re operating a convenience store, it will matter less if you run out of canned mushrooms than if you run out of two-percent milk, so you’ll focus on key needs as you make orders from suppliers.
To use this concept in decision making, just make a list of the data that you could collect, and then reorder that list in the order of each item’s importance to your decision.
When you’ve reordered the list, you’ll certainly collect data on the first item or two on the list. As you go down to each subsequent piece of information you might collect, ask yourself how valuable that information is to your decision and how much time and money it will take to collect it. If you predict that it will take a lot of time or cost a lot of money, ask yourself if the additional information will really be that helpful in making a good decision? Will it be cost effective or not? If not, don’t collect that information.
Show slide 14–8.
Tell the learners that once they have determined which data is important to have, they must collect and organize it. The organization is essential. For example, it is usually necessary to stratify data into proper groupings. Stratification means to divide or sort into two or more meaningful groups that can be examined separately.
If you don’t stratify the data, you end up like the audience when a sportscaster came in slightly under the influence one night. He reported the following to his confused audience: “And now, ladies and gentlemen, here are tonight’s scores: 37 to 41, 66 to 12, 39 to 22, 18 to 44, and, in a big upset, 52 to 33!” You know something, but it’s not all that clear or useful. The names of the teams and which sport he’s discussing would be helpful to know.
Stratification makes irregularities or relationships more readily stand out. It is, therefore, an essential aid to problem solving and decision making.
For example, if you’re gathering data to be used for quality control, and you have several possible sources of poor-quality production, be certain you can trace any problem to its cause. This may mean collecting data separately from each machine or each worker or each supplier. This will reduce difficulties during the problem-solving stage.
When you have a small population of options, you may want to get information on all of them. For example, if you’re trying to decide which among five computer systems to buy, you should get details on each.
Let’s say you want information on how your customers would react to a change in your product design. If you only have a few customers, you might ask them all. If you have thousands of customers, though, you’ll never get all of their opinions. If you did, it would be very expensive and time consuming.
For a large population, you can get reasonably reliable information by selecting a small, appropriate sample amount of that population to examine. Sampling is widely accepted in our culture in things such as TV Arbitron ratings, political polls, or free samples of food given in grocery stores. In a later session, we will present information on sampling techniques.
Show slide 14–9.
Read the John D. Turner quote and discuss its meaning with the class.
 8:35 a.m. Application Exercise (20 minutes).
Show slide 14–10. Distribute Worksheet 14-1: Sources of Information.
 Worksheet Instructions. This is the sixth worksheet in the series. Ask the trainees to reconsider the decision or problem they listed in the pretest and have been working with in each module so far. For that problem or decision, ask them to list what information they need to collect to make the decision. Then have them apply Pareto’s principle to the list, to choose the pieces of information that are most critical. Finally, ask the participants to make a list explaining how they intend to go about collecting the information. This may be a list of sources (individuals, records, websites, and so forth) or an explanation of a primary data collection process they will use. As in previous modules, participants may work individually or in groups.
8:55 a.m. Module 6 Summary (5 minutes).
Show slide 14–11. Review the key points of the module and use the learning check questions below as either an oral or printed learning check.
 LEARNING CHECK QUESTIONS
You can use the learning check questions and answers in oral or printed form.
Discussion Questions
- Define primary and secondary data
Answer: See slide 14–3. - What is the most practical way to use Pareto analysis?
Answer: First, list the information you could collect to help make a decision and then order it from most to least important. - List potential sources of primary and secondary information for a decision whether to move your company offices to another nearby city.
Answer: Primary information could include surveys of employees and customers, internal financial information, and so forth. Secondary information could include government information on the economy and labor market, real estate information, tax incentives available, quality-of-life surveys, and so forth. - In the next month, your company must develop its first-ever product catalog. How would Pareto analysis apply to this action?
Answer: Pareto analysis would help you focus on separating the significant few products from the trivial many, to focus attention on your key products.
Multiple Choice Questions
- Vilfredo Pareto is known for his contribution to
a. Creativity theory
b. Problem-solving technique
c. Analysis of priorities (answer)
d. Pasta sauce ingredients - Decision-making information found in a product review in Consumer Reports is always an example of ______________ information.
a. Quantitative
b. Qualitative
c. Secondary (answer)
d. Primary
9:00 a.m. Thank You for Your Attention.
Show slide 14–12 . Edit the slide to present information relevant to your class.
Worksheet 14–1
Instructions: Use this worksheet to identify sources of information to help you make your decision.
What primary or secondary sources of information are available to help you make this decision (people, records, documents, websites or other data sources, articles, books, consultants, and so forth)?
Plan for collecting the information.
How will you collect the information you need?
© 2010 Decision-Making Training, American Society for Training & Development