
Chapter 3. Creating Basic Reports with the SAP Query Tool
In this chapter
Creating a Basic List Query by Using the SAP Query Tool 24
Reviewing the Options on Each of the Five Basic Screens 30
This chapter describes how to create basic list SAP reports by using the SAP Query tool. It introduces everything you need to know to create basic list type reports in any application module of SAP. The step-by-step setup of this chapter makes it easy for any user, regardless of technical skill level, to create custom reports by using the SAP Query tool.
Helpful Hint
Although it is recommended that you create SAP query reports live in your production environment, while you are learning how to use SAP, it is important that you practice in your test quality assurance client so you do not cause any problems in your production environment.
The SAP Query Tool
The SAP Query tool, in its standard form, is designed so that an end user with no technical skills can create a report from scratch. It has five basic screens that an end user can go through to create a report. Each of the screens performs a function, and the end user can navigate between the screens by using navigational arrows on the Application toolbar. These are the five basic screens:
• Title, Format (Screen 1)—You use this screen to give a report a name.
• Select Field Group (Screen 2)—You use this screen to select the field groups that contain fields you want to include in your report.
• Select Field (Screen 3)—You use this screen to select the fields from the field groups you want to include in your report.
• Selections (Screen 4)—You use this screen to add any additional fields to your report’s selection screen to further specify your report output upon execution.
• Basic List Line Structure (Screen 5)—You use this screen to define what you want the report to look like.
Creating a Basic List Query by Using the SAP Query Tool
The most frequent comment I hear from fellow SAP customers is that they want the ability to extract their own information. It is empowering to know that you can go into SAP and select the data you want and have it come out formatted and sorted in the manner you choose. This section walks you through how to create a basic list report by using the SAP Query tool. The following sections explain all the options on the screens used to create the query report.
To create a basic list query by using the SAP Query tool, follow these steps:
1. Log in to your SAP client where your query reports will be created. (Best practice dictates that they be maintained in your live Production client.)
2. Navigate to the Maintain Queries Initial screen by using the transaction code /nSQ01. Beginning with R/3 release 4.6A, SAP offers a graphical version of the SAP Query tool, called the Graphical Query Painter; if you have not used the SAP Query tool, the Graphical Query Painter is set as your default. To turn off the Graphical Query Painter and learn to create easy step-by-step reports by using the SAP Query tool, select Settings, Settings and then deselect the Graphical Query Painter check box.
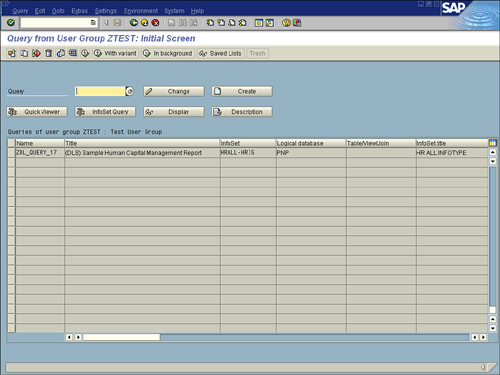
3. The title bar lists the query group you are currently in. For example, your title bar might read Query from User Group ZTEST: Initial Screen. If you are assigned to multiple query groups, press F7 to see a list of all of them.
4. As discussed in Chapter 1, “Getting Started with the SAP R/3 Query Reporting Tools,” it is recommended that you create your queries in the standard query area. Ensure that you are in the standard query area by selecting Environment, Query Areas and then selecting Standard Area.
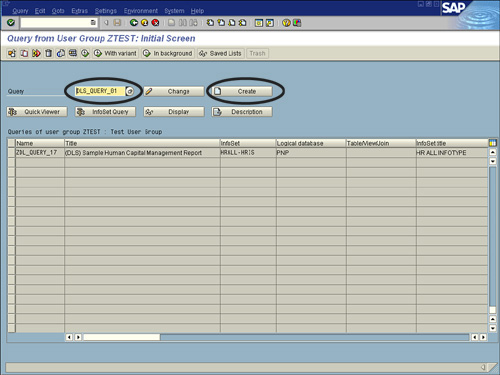
5. In the Query field, type DLS_QUERY_01 where DLS is your initials) as the name for the query you are creating, and then click the Create button (see Figure 3.1).
Figure 3.1. The main screen of the SAP Query tool lists all the queries available in the designated query group.
6. The InfoSets of User Group ZTEST window appears, listing all the available InfoSets (that is, data sources) for your query group. Because you created only one (in my example, I called it ZTEST), in Chapter 2, “One-Time Configuration for Query Tool Use,” it will be the only one listed. Select the InfoSet you created (ZTEST, in my example) and then click the green check mark button.
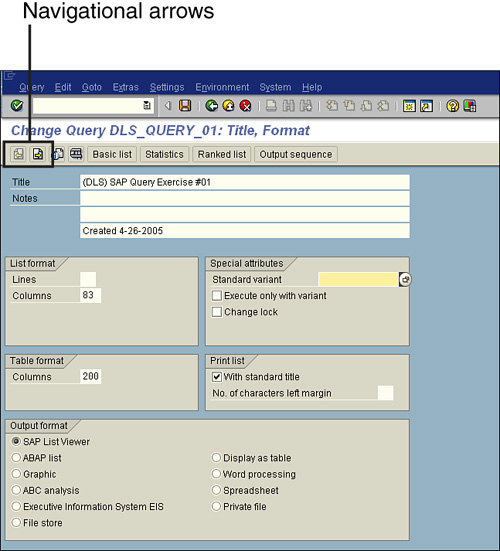
7. The Create Query Title Format screen appears. This screen allows you to save the basic formatting specifications for your query, including the name (title) and any notes you want to store for the query. The only required field is the Title (long report description). For this example, fill in only the Title field, as shown in Figure 3.2, and then click Save. (For my example, I used the title (DLS) SAP Query Exercise #01.)
Figure 3.2. The Application toolbar for the SAP Query tool contains navigational arrows that permit you to navigate between the screens of the query.
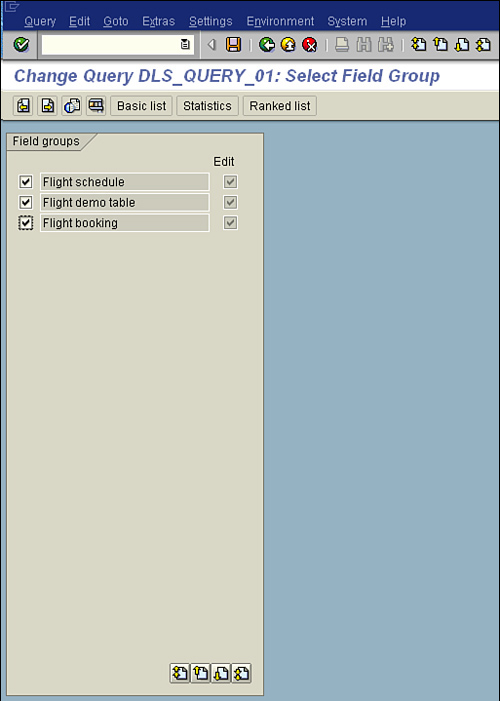
8. Navigate to the next screen in the SAP query creation process by selecting the Next Screen (white navigational arrow) button from the Application toolbar. (You can use the navigational arrows to navigate between the different screens of the SAP Query tool.) The Select Field Group screen appears, listing all the Field groups available within your InfoSet. Figure 3.3 shows this screen with the field groups Flight Schedule [SPFLI], Flight Demo Table [SFLIGHT], and Flight Booking [SBOOK] listed.
Figure 3.3. All the field groups listed at the top right of the InfoSet screen during configuration of the InfoSet are listed on this screen.
9. Place a check mark next to each field group from which you want to include fields in your report. Navigate to the next screen in the SAP query creation process by selecting the Next Screen (white navigational arrow) button on the Application toolbar. The Select Field screen appears, showing a list of all the available fields in the selected field groups.
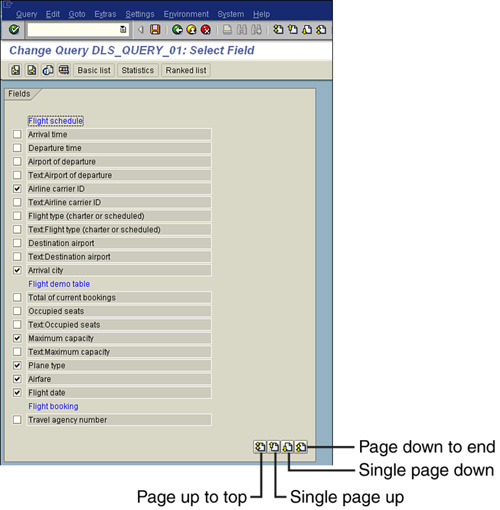
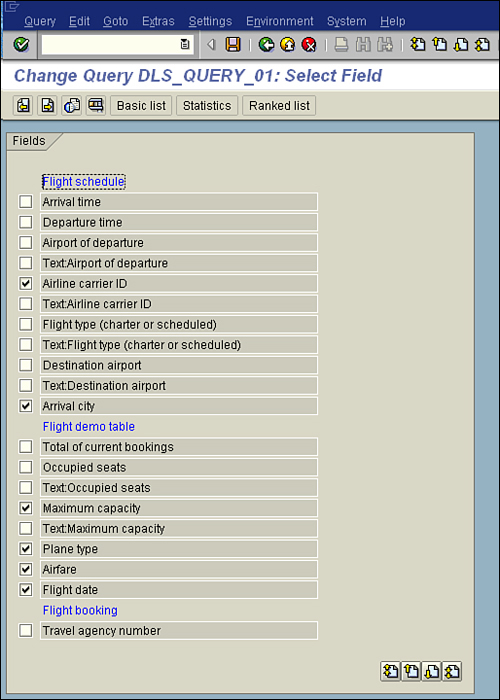
10. Place a check mark next to each field that you want to include in your report. You can use the Page Up and Page Down keys to navigate between all the fields (see Figure 3.4). Select the Next Screen (white navigational arrow) button from the Application toolbar to open the Selections screen, which lists all the fields you have selected.
Figure 3.4. All the fields listed in the field groups at the top right of the InfoSet screen during configuration are listed here.
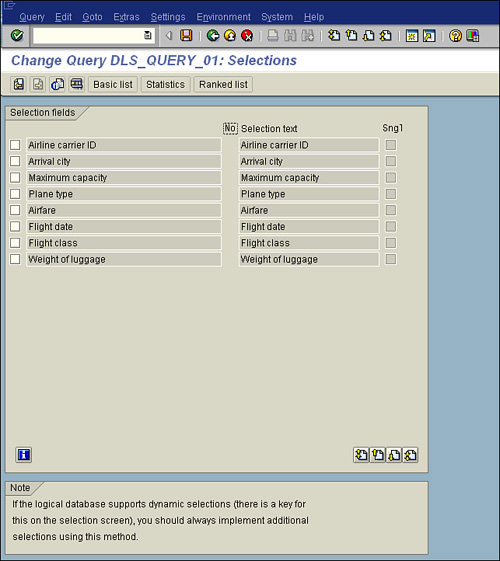
11. If desired, add any of the fields to the selection screen that will be presented when you execute your report. You can add a field to the Selections screen by placing a check mark next to each one (see Figure 3.5).
Figure 3.5. Having fields available on the report’s selection screen gives you the ability to specify your report output upon execution.
12. Click the Basic List button from the Application toolbar to create an SAP basic list query. The Basic List Line Structure screen appears, showing a list of the fields you selected to include in your report.
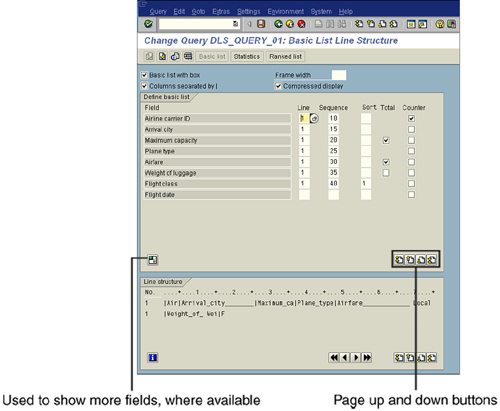
13. For each field, specify the line and sequence number as you want them to appear on your report. Also use this screen to indicate sort order, totals, and counts, if needed. Start by entering the line and sequence numbers, like the ones shown in Figure 3.6.
Figure 3.6. Basic output options are defined on the SAP Query tool Basic List Line Structure screen.
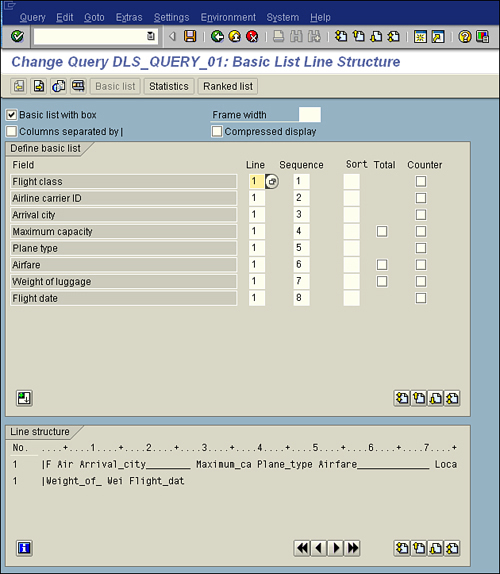
You can use Figure 3.6 as follows:
• Line column—The values in this column correspond to the line numbers the fields will appear on in the report.
• Sequence column—The numbers in this column determine the order of the fields for the line.
• Sort column—This column dictates the order in which the data will be sorted.
• Line Structure box—After you click the Save button, a preview of the format appears in the Line Structure box at the bottom of the screen.
14. For this example, proceed directly to the report by pressing F8, which causes the report to execute.
15. As with almost all other reports in SAP, when you execute this report, you see the report’s selection screen. Specify any criteria for the output of your report. Notice that any fields indicated on the Selections screen are included on your selection screen, under the heading Program Selections (see Figure 3.7).
Figure 3.7. Selection screens enable you to further specify report output.
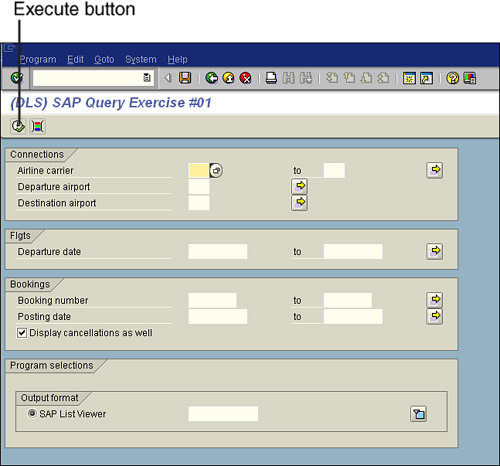
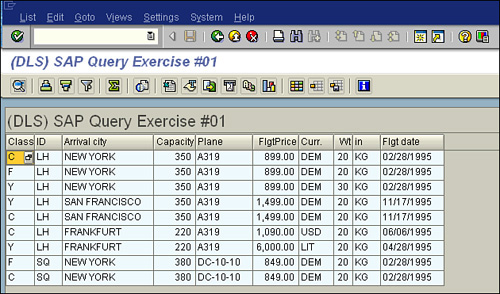
16. Select the F8 Execute button on your Application toolbar (it looks like a clock) to display your finished report. Your report output appears; it should look similar to what is shown in Figure 3.8. (Keep in mind that the actual values vary by organization: The output of the report corresponds to the specification entered on the Basic List Line Structure screen.)
Figure 3.8. In SAP 4.6 and higher, by default, your report displays in the SAP List Viewer.
Reviewing the Options on Each of the Five Basic Screens
The following sections serve as a reference of what options are available on each of the five basic screens of the SAP Query tool.
The Title, Format Screen
The Title, Format screen, shown in Figure 3.9, is where you insert the basic data about your report, including its title and the format in which you want it displayed. The Title, Format screen stores the basic report processing options for your report. For organizational purposes, it is a good idea to enter the name of the user who created the report in the Notes section of this screen. The following sections describe the options available on this screen.
Figure 3.9. The Title, Format screen.
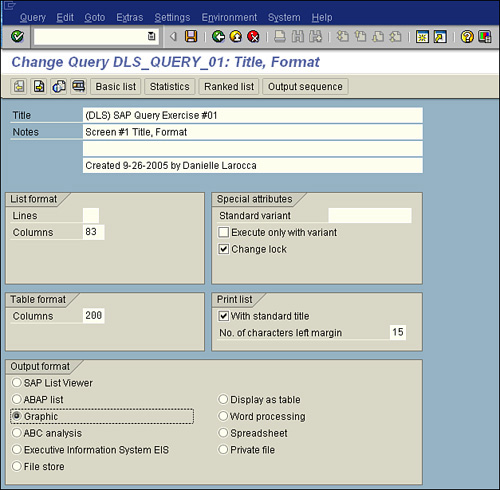
List Format
By default, on execution, a report is displayed in the SAP List Viewer (refer to Figure 3.8). The options listed in the List Format section apply only if you change the output format to appear in a text file or ABAP list. List Format options available on the Title, Format screen allow you to designate the line and column width of your report.
You use the Lines field to specify the number of lines to be output on one page for a list generated by the query. The default is blank, which outputs a continuous list on a single page. You can use the Lines field to enter the number of lines to be output on a single page. If you do not want page breaks, you should leave this field empty. The Columns field stores the number of columns per line. This field determines the maximum number of characters that can be displayed on one line of the list created by the query. Lines exceeding this length are broken. The maximum number permitted is 255. The number entered in the Columns field should be the closet estimation possible, because it helps determine the printed layout of the report. For example, if you set all reports to be the maximum of 255 so that all your columns fit on a single line, your printed report may contain very small text to accommodate all 255 columns. Again, these settings are required only if the output format is a text file or an ABAP list. (See the section “Output Format” on the next page.)
Special Attributes
The Special Attributes section allows you to specify whether the report should run with a variant. (Variants are introduced in Chapter 6, “Using Reporting Selection Screens: Advanced Skills.”) You use the Change Lock check box to indicate whether you want other users to be able to make changes to your query. By default, this check box is unmarked, indicating that any other user in your query group who has the appropriate authorizations can make changes to your report. To prevent this, select this check box for each new query you create.
Table Format
You use the options listed in the Table Format section only if you change the output format to appear in a table. (See the section “Output Format.”) You use the Columns field in the Table Format box to indicate the maximum number of characters for the width of a table view control if you select your data to be viewed as a table. You can use table view controls to display the data of single-line basic lists, statistics, and rankings in a special format. This specification affects only the visible width, and the table control may contain more data columns than are visible in a single R/3 window.
Print List
The Print List box includes the With Standard Title check box, which you use to indicate whether you want your output to include the standard title that you specified at top of the screen, in the Title field. By default, this box is selected. You use the No. of Characters Left Margin box to specify how many characters to save room for at the left side of the page in the printed report, in case you want to have room for binding or punched holes.
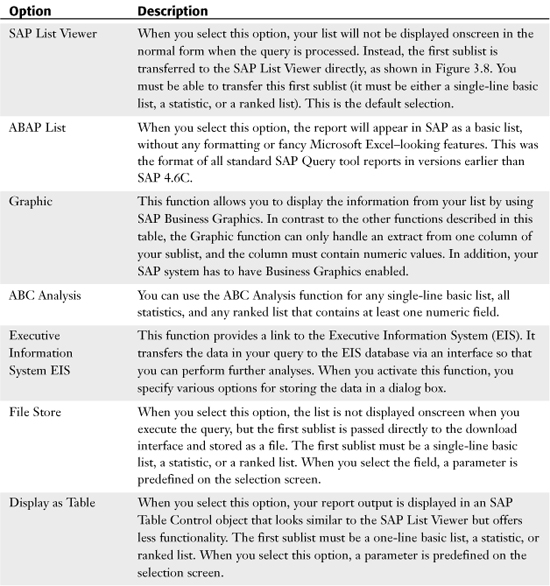
Output Format
Upon report execution, your report is displayed in the SAP List Viewer format (refer to Figure 3.8). The Output Format options allow you to have a report’s data output in different formats. The default setting is SAP List Viewer, which is a screen that appears very similar to a Microsoft Excel worksheet and is the standard for all reports in SAP version 4.6C and higher. The options available in this box are described in Table 3.1.
Specifying an output option on the Title, Format screen of the SAP Query tool ensures that when the report is executed, it will be displayed in the selected format. When you select an option on the Title, Format screen, it is set as a default parameter for the selection screen of that report only.
Table 3.1. SAP Query Tool Title, Format Screen Output Format Options
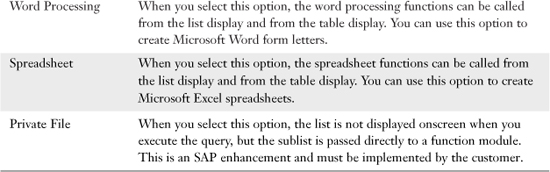
The Select Field Group Screen
In the Select Field Group screen, shown in Figure 3.10, a list of all the available field groups is populated during the creation of the InfoSet. (See Chapter 2 for more information.) This example has only three field groups; however, some logical databases contain hundreds. You place a check mark next to any field group that contains fields you want to include in your SAP query.
Figure 3.10. All the field groups listed at the top right of your InfoSet screen during configuration of the InfoSet are listed on this screen.
The Select Field Screen
In the Select Field screen, shown in Figure 3.11, a list of all the available field groups populated during the creation of the InfoSet is expanded to display all the fields contained within them. You place a check mark next to any field you want to include in your SAP query.
Figure 3.11. All the fields listed in the field groups at the top right of your InfoSet screen during configuration are listed here. This screen is also used for advanced functions covered later in this book.
The Selections Screen
In the Selections screen, shown in Figure 3.12, a list of all the previously selected fields appears. You place a check mark next to any field that you want to include on the Selections screen that appears upon report execution. This gives you the option to specify particular data.
Figure 3.12. Having fields available on your report’s selection screen gives you the ability to specify your report output by varying your input prior to report execution.
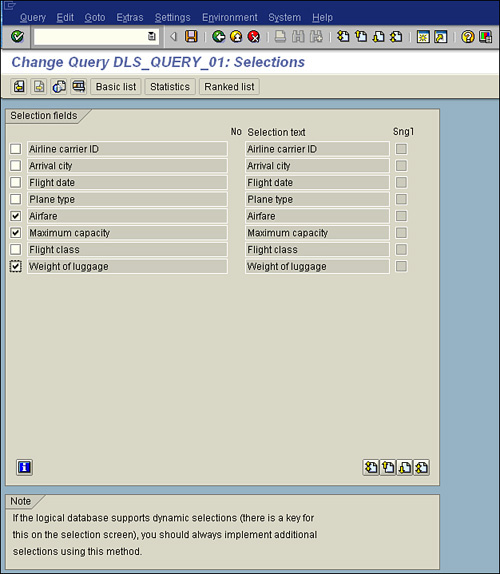
For example, in Figure 3.12, I selected that I wanted the Airfare, Maximum Capacity, and Weight of Luggage fields to appear on my report’s Selections screen. This means that when I execute my report and see the Selections screen, those three fields will be listed there, under the heading Program Selections. Having them there allows me to run the report based on specific airfares, maximum capacity, or weight of luggage. (For example, I could run a report that contains a list of flights between $50 and $200.)
The Basic List Line Structure Screen
By default, only the first few selected fields of your report appear on the Basic List Line Structure screen, shown in Figure 3.13. They are all there, but with the default view, they are not all visible. You can use the Page Up and Page Down buttons on the right side of the screen to navigate between them, or you can select the Without Explanation button (at the bottom left of the screen) to view more fields on a single screen. The Basic List Line Structure screen lists all the fields you want to include in your output. You can have fields listed here for sorting purposes but not included in the output by simply leaving the Line and Sequence fields blank.
Figure 3.13. This is the screen where you dictate how you want your report to appear, including sequence and sorting specifications.
The following sections describe the various options available in the Basic List Line Structure screen.
Basic List with Box
The Basic List with Box check box, which appears at the top of the screen, is used for basic ABAP lists. If you select for your report output to be an ABAP list, selecting this check box causes the basic list to display with lines separating the columns. It is used as a formatting preference only. The box is designed so that it encloses only the filled part of the basic list.
Columns Separated by |
The Columns Separated by | check box is available only if the Basic List with Box check box is selected. If you select for your report output to be an ABAP list, selecting this check box causes a vertical bar to be inserted after each field on a line except the last. An underscore is output before and after each control-level text (if sorting and subtotaling are used) and is inserted before and after each total. In addition, the individual columns in the standard header are separated by vertical bars. As with the previous option, this one is used as a formatting preference only.
Compressed Display
If you select the Compressed Display check box, the basic list is displayed in compressed format, provided that compressed display is possible.
Line
The Line column is where you specify the line number on which you want your output to appear. Specifying Line 1 for all fields will make them all appear as columns next to each other in the form of a standard report. Indicating multiple line numbers usually works only if you set your report output to be anything other than the SAP List Viewer or the table display. Multiple-line indicators are used most often for creating mailing labels or addressing envelopes, where the data output is on three or four sequential lines.
Helpful Hint
When entering the line numbers, keep in mind the database structure. Lines with fields from hierarchically superior tables must be output before lines with fields from hierarchically subordinate tables. Fields from hierarchically parallel tables may not be output on the same line. You might need help from your technical staff if your report does not output the way you hoped; it may be correctable by adjusting the line assignments on this screen.
The terms hierarchically superior and parallel are really fancy terms that just mean where the data resides in the database. Picture how a standard purchase order looks: At the top it has basic information (purchase order number, vendor name, account number, and so on), and in the middle are the line item details for each item ordered (for example, Qty 24 widgets blue $4.00, Qty 3 widgets green $5.00, Qty 134 widgets white $2.00). If you were to try to run a report off this data, you would not want it all along one line. Rather, you would want information from the top of the purchase order (the hierarchically superior fields for purchase order number, vendor name, and so on) to appear along one line and the information from the middle of the purchase order (the hierarchically inferior fields, such as the line item detail for each item ordered) to appear as individual (or parallel) lines in your report. If you are working with complex data such as financial purchase orders, invoices, or human capital management organizational charts, you need to be sure you understand the data before including it in your reports.
Sequence
You use the Sequence column to identify the order in which you want your data to appear in the line. For example, if all of your fields are on Line 1, you can specify that you want the Booking Number field to appear first, followed by the Airline Carrier ID, and so on. It is a best business practice to list your sequence of fields in increments, as shown in Figure 3.13. That way, if you need to modify the report output, add a field, or delete a field, you do not need to renumber the entire sequence in the report. A popular way to do this is to use increments of 5, as shown in Figure 3.13.
Sort
When you have set up the way you want your fields displayed with the Line and Sequence settings, you can specify the sort order for the fields by using the Sort column. You can assign sequence numbers between 1 and 10 to sort on up to 10 different fields.
Helpful Hint
The fields do not have to be sorted in the same order in which they are presented onscreen. For example, even if the Flight Class field were set to output as the last column in the report, you could still indicate it as the data you want to sort on, as shown in Figure 3.13.
Total
Check boxes for the Total column appear only for numeric fields that can be totaled. You can place a check mark for each numeric field for which you want to output the total at the end of the basic list and, if sort criteria exist, subtotals at the end of each control level. Chapter 7, “Creating Advanced Reports with the SAP Query Tool,” talks more about control levels and subtotaling.
Counter
You can select check boxes in the Counter column for each field you want to count. The total is then displayed at the end of the list.
Helpful Hint
It has been my experience that, depending on your SAP GUI version and your installed version of Microsoft Office and its related settings, sorts and counts may appear only if your report is viewed as an ABAP list and not via the SAP List Viewer.
Modifying an SAP Query
After you have created a query, you might want to navigate between the various screens to make changes and modifications. You can use the Next Screen and Previous Screen white arrow buttons on the Application toolbar in the first four screens of the SAP Query tool.
You can also click the Basic List button to jump to the Basic List Line Structure screen or press the F8 key to navigate to the selection screen or finished report output from the selection screen. Clicking the green Back button on the Application toolbar from the finished report output screen brings you to the report’s selection screen. You can also navigate between screens by using the toolbar menus.
Saving a Query
From any screen in the SAP Query tool except the Selections screen or the finished report output screen, you can click the Save button on the Application toolbar to save your query. This makes sense: If you click the Save button on the selection screen, the system thinks you want to save the entries as a variant, and if you click the Save button on the list screen, the system thinks you want to save your output as a list.
Maintaining Queries
You can maintain and execute queries from the main SAP Query tool screen, which you access by using the transaction code SQ01. By using the buttons at the top of this screen, you can execute, change, create new, or view descriptions of queries in R/3. By using the Application toolbar, you can also copy, delete, or rename your queries (see Figure 3.14).
Figure 3.14. The main screen of the SAP Query tool contains functions on the menu bar for maintaining queries.
Things to Remember
• Creating a query report using the SAP Query tool is very easy.
• You can navigate between the basic screens of the SAP Query tool by using the navigational arrows on the Application toolbar.
• Whenever you want to execute your report, you can do so by pressing F8 on your keyboard.
• When you execute a report, you always see a selection screen that gives you the opportunity to further specify your selections.
• When creating reports, it is a good idea to format your output on the Basic List Line Structure screen in increments to make it easier to edit your report in the future.