
Chapter 14. Creating Ranked Lists with the SAP Query Tool
In this chapter
Creating a Ranked List by Using the SAP Query Tool 181
Sample Uses of Ranked Lists in SAP R/3 184
The previous chapters covered how to create basic and advanced statistical lists by using the SAP Query tool. This chapter teaches the skills necessary to create ranked lists using the SAP Query tool. Ranked lists are helpful in statistical rank reporting, where you want not only summarized compressed data but data in ranked order (either ascending or descending). If you are not comfortable creating a basic list or creating a basic statistical list, you should practice the skills described in earlier chapters before proceeding with this one.
What Are Ranked Lists?
If you were to review the SAP help documentation’s definition of ranked lists in the standard SAP glossary at http://help.SAP.com, you might end up scratching your head for days, trying to determine what a ranked list is:
With statistics, numerical values (for example, sales) belonging to particular key terms (for example, an airline carrier or a charter flight) are added together. The result is displayed in a table that gives you an overview of how the numeric values are distributed across the individual key terms. Ranked lists are special types of statistics. Here too, numeric values for key terms are added together and displayed in a table. However, a numerical value is always used to sort the data. This value is called a ranked list criterion. Only a certain number of items are displayed. Ranked lists are therefore useful for asking questions such as: “Which 10 flight connections have the highest sales?” When you choose a numeric value as the only sort criterion in a statistic, the result is practically a ranked list. With statistics, however, you cannot restrict the number of items that are displayed.
The easiest way to think of a ranked list is to think of putting items in order and then ranking them in terms of highest to lowest or vice versa. For example, let’s look at a real-world example involving some fictional associates from Mama Tricarico’s restaurant, which was used in earlier examples (see Table 14.1).
Table 14.1. Fictional Associates of Mama Tricarico’s
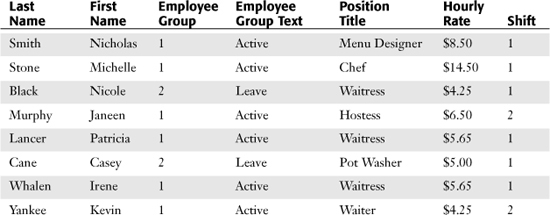
You could quite easily rank the three highest-paid associates from the list in Table 14.1 by manually reviewing the list:
1. Lawrence, William ($16.50)
2. Stone, Michelle ($14.50)
3. Smith, Nicholas ($8.50)
However, for a very large list, you might want to create a report that automatically ranks everyone in order. That is exactly what ranked lists do: They rank lists in either ascending or descending order.
Creating a Ranked List by Using the SAP Query Tool
In this section you will create a ranked list report by using the SAP Query tool, and you will base the ranked list on a calculated field. So this exercise will allow you to practice two skills. The exercises in this chapter use the SAP IDES Test Flight Scheduling system. You will begin by creating an SAP ranked list that ranks the airlines that have the greatest number of available seats left on their current flights. To do so, follow these steps:
1. Navigate to the main screen of the SAP Query tool by using transaction code SQ01, select the query you want to work with (for example, DLS_QUERY_14, where DLS is my initials), and click the Change button.
2. Navigate to the Select Field Groups screen and select the field group names that contain the fields you want to include in your report. (In my example, I selected all three.) Click the Next Screen button on the Application toolbar to access the Select Fields screen.
3. Select the fields you want to include in your report: Airline Carrier ID, Flight Date, Maximum Capacity, and Total of Current Bookings.
4. If the short names are not already displayed, select Edit, Short Names, Switch on/off to turn them on. Enter the short name MAX for the Maximum Capacity field and the short name OCC for the Occupied Seats field.
5. Create a calculated field that determines how many seats are free on each flight by taking the number of available seats (Maximum Capacity field) and subtracting the number of seats taken (Occupied Seats field). Position your cursor in the Occupied Seats field to base your calculated field on it.
6. Select Edit, Local Field, Create. Because your cursor was on the Occupied Seats field, a custom field is added to its field group (Flight Demo Table).
7. Select Edit, Local Field, Create. The Define Field dialog box appears. Input Free as the short name for your newly created local field, and input the field description Free Seats, which will be the heading for the column in the report.
8. Define the attributes for the new field. It should have the same attributes as the Occupied Seats field (OCC).
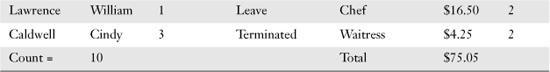
9. Select the Calculation Formula option button at the bottom of the dialog box (it should be selected by default) and then enter the basic mathematical formula MAX – OCC in the box to the right of it (see Figure 14.1). This formula will start with the total maximum capacity for the flight and will subtract the number of seats currently occupied to yield the number of available or free seats left over.
Figure 14.1. The basic mathematical formula is performed to populate the Free Seats column of the report.
10. Click the Continue button to close the Define Field dialog box and return to the Select Field Groups screen.
11. Navigate to the Ranked List Structure screen by clicking the Ranked List button on the Application toolbar. The Ranked List Structure screen appears, allowing you to define your report output. Name your compressed list report Ranked_List_1.
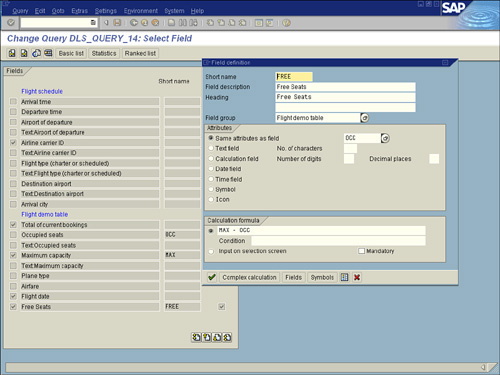
12. Use the Ranked List Structure screen to dictate how you want your report to appear, including rank number specifications. Assign a sequence number to each field that appears in the ranked list to determine the sequence in which they are output. Review the nine options available on this screen (see Table 14.2).
When you define a ranked list, the data is summarized; that is, several data records are processed to determine one line. With numeric fields, the total is always output. Every ranked list must contain at least one numeric field.
Table 14.2. The Options on the Ranked List Structure Screen
13. Assign the sequence numbers, starting with 1 and in ascending order, without breaks. Indicate that you want to output the fields Airline Carrier ID, Flight Date, Free Seats, and Maximum Capacity. Specify the sequence in which you want to output the fields, and state whether you want them to be sorted in ascending or descending order, as shown in Figure 14.2.
Figure 14.2. All ranked lists contain lead columns that are determined by the query itself. When you scroll horizontally, these fields always remain visible onscreen.
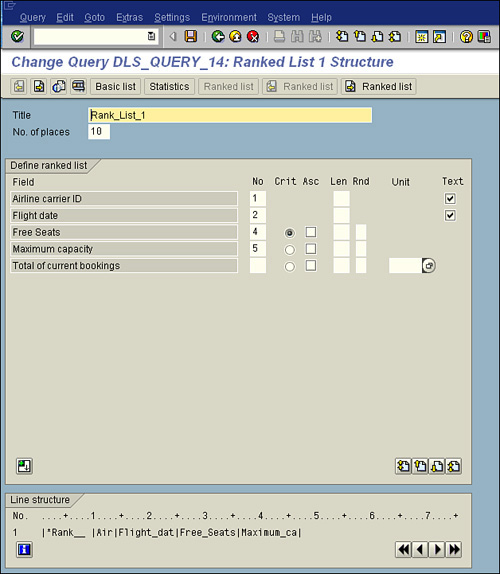
14. Indicate that you want to rank on free seats (refer to Figure 14.2).
15. To execute the report and view the selection screen, press F8.
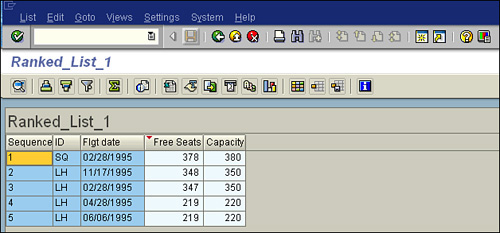
16. Press F8 to display your finished report. Your report output should appear similar to that in Figure 14.3, but keep in mind that the actual values vary by organization.
Figure 14.3. This ranked list displays the flights and carrier IDs of the five flights that have the greatest number of available seats.
Helpful Hint
On the Ranked List screen, you can click the Next Ranked List button on the Application toolbar if you want to define another ranked list.
Sample Uses of Ranked Lists in SAP R/3
When I think of ranked lists, I often think of high school class rankings. For example, if your graduating class had 1,000 students, and you were Number 1, you were the valedictorian. Other rankings were important, too, for college admissions (and bragging rights). Ranking is useful in many different ways, including those listed here:
• Purchasing information system—You could create a ranked list of the 10 vendors that have the highest purchase order values.
• Sales information system—You could create a ranked list of the 50 customers with the highest incoming orders.
• Inventory control—You could create a ranked list of the 50 materials with the highest purchase order values.
• Shop floor information system—You could create a ranked list of the 20 work centers with the shortest lead times.
• Plant maintenance information system—You could create a ranked list of the 10 functional locations with the highest number of breakdowns.
• Quality management information system—You could create a ranked list of the 10 vendors with the highest number of returned lots.
• Human capital management—You could create a ranked list of the 100 departments with the largest numbers of active associates.
Things to Remember
• Using ranked lists is helpful for statistical analysis of data when you want the data ranked in order.
• You can create calculated fields within an SAP Query tool ranked list.
• The ranked number column in a report is frozen in place if you scroll horizontally, making it easy for you to review the ranked list.