
Dewatering
With few exceptions, most mineral-separation processes involve the use of substantial quantities of water and the final concentrate has to be separated from a pulp in which the water–solids ratio may be high. Dewatering, or solid–liquid separation, produces a relatively dry concentrate for shipment. Partial dewatering is also performed at various stages in the concentrator, so as to prepare the feed for subsequent processes. Sometimes tailings are also de-watered.
Keywords
Thickening; gravity and centrifugal sedimentation; coagulation and flocculation; filtration; vacuum and pressure filtration; drying
15.1 Introduction
With few exceptions, most mineral-separation processes involve the use of substantial quantities of water and the final concentrate has to be separated from a pulp in which the water–solids ratio may be high. Dewatering, or solid–liquid separation, produces a relatively dry concentrate for shipment. Partial dewatering is also performed at various stages in the concentrator, so as to prepare the feed for subsequent processes. Sometimes tailings are also de-watered (Chapter 16).
Dewatering methods can be broadly classified into three groups: sedimentation (gravity and centrifugal), filtration, and thermal drying. Dewatering in mineral processing is normally a combination of these methods, an example being Figure 15.1. The bulk of the water is first removed by thickening, which produces a thickened pulp of perhaps 55–65% solids by weight. Up to 80% of the water can be separated at this stage. Filtration of the thickened pulp then produces a moist filter cake of between 80% and 90% solids, which may require thermal drying to produce a final product of about 95% solids by weight.

The principles of solid–liquid separation, testing, equipment sizing, and operation are covered in detail by Concha (2014) and Mular et al. (2002); innovations are discussed by McCaslin et al. (2014), and specifically in coal preparation (washing) plants by Luttrell (2014).
15.2 Gravitational Sedimentation
Gravity sedimentation or thickening is the most widely applied dewatering technique in mineral processing, and it is a relatively cheap, high-capacity process. The thickener is used to increase the concentration of the suspension by sedimentation, accompanied by the formation of a clear liquid (supernatant). The principal type of thickener consists of a cylindrical, largely open tank from which the clear liquid is taken off at the top (thickener “overflow”), and the suspension is transported by rotating rakes to discharge at the bottom (“underflow”) (Schoenbrunn and Laros, 2002). These are conventional thickeners and their variants, and they form the main content of this section of the chapter. Other sedimentation devices, including centrifuges, are briefly covered at the end of the section.
15.2.1 Sedimentation of Particles
Sedimentation is most efficient when there is a large density difference between liquid and solid. This is always the case in mineral processing where the carrier liquid is water. Sedimentation cannot always be applied in hydrometallurgical processes, however, because in some cases the carrier liquid may be a high-grade leach liquor having a density approaching that of the solids.
Settling of solid particles in a liquid produces a clarified liquid which can be decanted, leaving a thickened slurry. The process is illustrated in Figure 15.2 using the common laboratory test, that is, batch sedimentation in a graduated cylinder (cylinder test or jar test).

The settling rates of particles in a fluid are governed by Stokes’ or Newton’s laws (Chapter 9). Factors that affect sedimentation include: particles size and shape, weight and volume content of solids, fluid viscosity, and specific gravity of solids and liquid. Very fine particles, of only a few micrometers diameter, settle extremely slowly by gravity alone, and centrifugal sedimentation may have to be performed. Alternatively, the particles may be aggregated or flocculated, into relatively large clumps, called flocs, that settle out more rapidly (Section 15.2.2).
Batch settling tests are undertaken to size thickeners, which operate continuously, and to test performance of operating thickeners. The data for analysis are presented as solid–liquid interface height versus time (Figure 15.3).

The start of the settling curve represents the interface (or mud-line) between zone A, clear water (clarified supernatant), and zone B at the initial concentration; the settling rate is nearly constant. The critical sedimentation point indicates the loss of zone B and the interface now corresponds to that between zone A and the variable concentration zone C. The settling rate now decreases as the concentration in zone C increases, hindering the settling process. When zone C is lost, the settling rate approaches zero, the interface only slowly decreasing as water is squeezed out by the weight of the particles compressing the bed. The settling curve should be independent of vessel geometry, avoiding, for example, wall effects by using a too small diameter cylinder. Concha (2014) describes a setup to measure settling characteristics in five cylinders simultaneously (SediRack).
Additional detail on suspension settling behavior can be obtained by measuring local solids concentration in zones C and D using, for example, mobile radiation sources and detectors (X-rays, gamma-rays) with appropriate calibrations (Owen et al., 2002; Kurt, 2006). These data can reveal channeling in the settling bed. In the case of flocculated suspensions, other parameters that can be determined include compressibility and the gel point, defined as the concentration at which flocs come into contact and start to form a self-supporting network structure. These parameters are used in theories of flocculated suspensions (Buscall and White, 1987). An array of conductivity sensors along a settling cylinder provides data on the concentration profile of the settled bed (Concha, 2014).
15.2.2 Particle Aggregation: Coagulation and Flocculation
Fine particles, say −10 μm, settle slowly under gravity. All particles exert mutual attractive forces, known as London-Van der Waals’ forces. Normally these attractive forces are opposed by the charge on the particle surface that originates from a variety of mechanisms (one was depicted in Chapter 12, Figure 12.10). Coagulation and flocculation refer to processes that cause particles to aggregate or agglomerate (i.e., adhere or cluster together) to increase settling rates. The cluster is variously called an aggregate, agglomerate, or more commonly a floc. Often used synonymously, coagulation is associated with modification of particle surface charge to cause aggregation, while flocculation involves addition of long-chain polymers that bind (“bridge”) particles together. This difference leads to two classes of aggregating reagents: coagulants and flocculants.
Surface Charge
Particles in water always exhibit a surface charge. In a given system the electrical charge on the particle surfaces will be of the same sign and this causes mutual repulsion, which slows settling by keeping particles apart and in constant motion. In mineral processing most aqueous systems are alkaline and the charge is usually taken to be negative; a negative charge will be assumed in the discussion that follows. The charge at the particle surface affects the distribution of solute ions nearby (Figure 15.4(a)). The solute ions form two layers: an inner layer that comprises an excess of cations (assuming the surface is negatively charged) more or less bound to the surface, the bound layer (or Stern layer); and a second layer that contains more loosely attracted ions, the diffuse layer. This depiction is referred to as the electrical double layer model. The charge is normally expressed as a potential. Figure 15.4(a) illustrates the distribution of ions (upper) and the corresponding electrical potential versus distance from the particle surface (lower).

The potential decays with distance from the surface (surface potential) to reach zero at the bulk solution. Since suspension behavior involves motion of the particle relative to the water, a layer of water is associated with the moving particle. The relevant potential then is not the surface potential, but that at the plane of shear (the boundary between the water layer carried by the particle and the bulk water), termed the zeta potential. The plane of shear is sometimes taken to coincide with the boundary between the Stern and diffuse layers. The zeta potential is measured by the common methods that track the motion of the particle under the influence of an electrical field (electrophoresis).
Zeta potential values range up to about 200 mV. A zeta potential of 20 mV or more (negative or positive) will tend to keep fine particles dispersed by electrostatic repulsion. There are two ways the charge can be manipulated to cause aggregation: reducing the zeta potential to near zero to remove the repulsive force (charge neutralization); or creating conditions to cause electrostatic attraction (electrostatic coagulation).
Charge Neutralization
In Chapter 12 we learned that zeta potential can be reduced to zero by adjusting pH to the iso-electric point (IEP). In fact, determining the pH giving maximum settling rate can be used to identify the IEP for some minerals. Altering pH is not usually a practical option and charge neutralization is achieved instead by adding multivalent cations, such as Fe3+, Al3+, and Ca2+ to neutralize the charge. The common reagents, known as inorganic coagulants, are aluminum sulfate (Alum) (Al2(SO4)3), ferric sulfate (Fe2(SO4)3), ferric chloride (FeCl3), and lime (Ca(OH)2).
Figure 15.4(b) illustrates the effect on the rate of potential decay by introducing multivalent ions, using Ca2+ ions as the example. The double charge on the cation causes the rate of potential decay to increase compared to monovalent ions, and thus the zeta potential is decreased. At sufficient Ca2+ concentration the zeta potential reduces to zero and electrostatic repulsion is lost and the system aggregates (in practice a value <±20 mV usually suffices). This concentration is the called the critical coagulation concentration (CCC). The effect on increasing rate of decay of the potential is referred to as double layer compression. Sufficiently high concentration of monovalent ions can achieve double layer compression and cause coagulation, a situation that may be encountered in plants using seawater or bore water.
The CCC (not to be confused with the previous definition in Chapter 12) is strongly dependent on the charge on the ion, thus Fe3+ and Al3+ ions are more effective (have lower CCCs) than Ca2+ which in turn is more effective than, say, Na+. The action of ferric and aluminum salts, however, also involves formation of hydroxide precipitates (at pH > 4–5) that collect particles as they settle, known as sweep flocculation. The Fe3+ and Al3+ coagulants are best employed when suspended solids is low. Somasundaran and Wang (2006) list the CCC of some coagulants. The aggregation mechanism is reversible; a Ca2+ concentration well above the CCC will create positive surface charge (positive zeta potential) and cause re-dispersion. (Charge reversal was illustrated in Chapter 12, Figure 12.27.)
Electrostatic Coagulation
Coagulation by electrostatic attraction occurs when two particle types have opposite charge and there is mutual attraction. An example of silica and iron oxide minerals was discussed in Chapter 12. Talc presents an example of a single mineral subject to electrostatic coagulation, as the charge on the basal plane (face) is usually negative and the charge on the edge (at least below about pH 10) is positive and aggregation by a face-edge (“house-of-cards”) arrangement occurs. Electrostatic coagulation in the present case is achieved by adding organic coagulants. These are polymers of low molecular weight (3,000 to 1 million) with cationic functional groups. Adsorption creates regions of positive charge (“patches”) that promote electrostatic attraction with the polymer-free negative regions on other particles, as depicted in Figure 15.5. Also known as patch flocculation, like inorganic coagulants, over-dosing can cause re-dispersion, as the patches spread to cover the surface and the charge becomes uniformly positive.

Three families of organic coagulants are primarily used: polyamines, polyDADMAC, and dicyandiamide. More complete lists are given by Somasundaran and Wang (2006) and Bulatovic (2007).
Flocculation
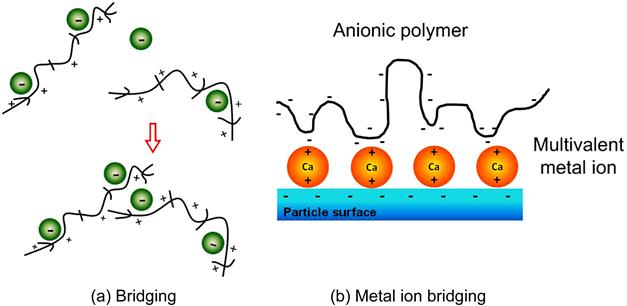
Creating a more open structure than coagulation, flocculation involves the use of long-chain organic polymers of high molecular weight (>1 million) to form molecular bridges between particles (Hogg, 2000; Pearse, 2003; Tripathy and De, 2006; Usher et al., 2009). Formerly natural products such as starch derivatives and polysaccharides, they are now increasingly synthetic materials, loosely termed polyelectrolytes. Bridging is illustrated in Figure 15.6(a) for a cationic polymer. In practice, many such inter-particle bridges are formed, linking a number of particles together. Figure 15.6(b) shows the co-use of coagulant (Ca2+) and an anionic polymer. The length of a completely uncoiled polymer is about 1 µm, up to perhaps a few tens of µm for the longest chains. Bridging with other particles stops when the floc size reaches about 10 mm (Rushton et al., 2000).
It would be expected that, since most suspensions encountered in the minerals industry contain negatively charged particles, cationic polyelectrolytes would be most suitable. Although this gives some level of charge neutralization, and aids attraction of the polymer to the particle surface, it is not necessarily true for the bridging role of the flocculant. For bridging, the polymer must be strongly attached, and this is promoted by chemical adsorption (formation of chemical bonds) through, for example, amide groups (e.g., CONH2). In other words, the charge on the polymer is less important and the majority of commercially available polyelectrolytes are anionic, since these tend to be of higher molecular weight than the cationics, and are less expensive.
Bridging requires that the polymer be strongly bonded to one particle, but have other bonding sites available for other particles. Excess polymer tends to adsorb on one particle and this can promote re-dispersion. The optimum polymer concentration and pH requires laboratory testing. Physical conditions, such as agitation and pumping, can also cause re-dispersion by breaking down the flocs. This is one reason why flocculants are generally not used with hydrocyclones and have limited application in centrifugal de-watering. In comparison, aggregates produced by coagulation will reform after disruption.
The polyacrylamides (abbreviated as PAM) are the most common flocculants. They can be manufactured to have non-ionic, anionic, or cationic character. Polyacrylamide formed from the acrylamide monomer (–CH2CHCONH2) is non-ionic (Figure 15.7(a)). (Being made of only one monomer type it is a homopolymer.) An anionic polymer can be made by hydrolysis of the non-ionic PAM, but more usually by co-polymerizing acrylamide with acrylic acid (CH2![]() CHCOOH) monomer (i.e., making a co-polymer), where some of the side chains lose a proton to become negatively charged (Figure 15.7(b)). A cationic polymer is made by co-polymerizing with a cationic monomer.
CHCOOH) monomer (i.e., making a co-polymer), where some of the side chains lose a proton to become negatively charged (Figure 15.7(b)). A cationic polymer is made by co-polymerizing with a cationic monomer.

The manufacture gives a certain degree of ionic character or charge density, which refers to the percentage of the monomer segments that carry a charge. It is now possible to obtain water soluble PAM products with a wide range of ionic character, varying from 100% cationic content through non-ionic to 100% anionic content and with molecular weights from several thousand to over 10 million, the highest among the synthesized polymers. Flocculants other than PAM (e.g., polyethylene—imines, polyamides—amines) are used under special conditions.
Although the addition of flocculants can lead to significant improvements in sedimentation rate, flocculation is generally detrimental to final consolidation of the sediment. Large flocs promote settling and are desirable for clarification and thickening. Floc density is of secondary importance in these processes. Conversely, dense flocs are most appropriate for consolidation of the sediment, and size is of lesser importance in this stage. Therefore the optimization of solid–liquid separation processes requires careful control of floc size and structure. If thickening is followed by filtration, the choice of flocculant may be important. Flocculants are widely used as filter aids. However, the specific requirements of a flocculant used to promote sedimentation are not necessarily the same as for one used as a filter aid; for example, flocs formed with high molecular weight products are relatively large, trapping water within the structure and increasing the final moisture content of the filter cake.
Laboratory batch cylinder tests are commonly used to assess the effectiveness of flocculants. Reproducibility of such tests is often poor and there is almost always conflict in determining an optimum dosage of flocculant between full-scale operations and laboratory tests (Scales et al., 2015). Methods of improving reproducibility and better approximating conditions in the thickener, such as shear rate, continue to be developed (Farrow and Swift, 1996; Scales et al., 2015; Parsapour et al., 2014).
In practice, polyelectrolytes are normally made up of stock solutions of about 0.5–1%, which are diluted to about 0.1% (maximum) before adding to the slurry. The diluted solution must be added at enough points in the stream to ensure its contact with every portion of the system. Agitation is essential at the addition points, and shortly thereafter, to assist in flocculant dispersion in the process stream. Care should be taken to avoid severe agitation after the flocs have been formed. The age of the stock solution can have a significant effect on flocculant performance (Owen et al., 2002).
15.2.3 Thickener Types
There are four types of thickener that have a more or less open tank design (Concha, 2014), shown in Figure 15.8: conventional (a), high rate (b), high density (c), and paste (d) thickeners. High rate (or high capacity) is the term applied to thickeners processing very high throughput by optimization of flocculation. In that regard, it may be more appropriate to talk of different thickener operation rather than thickener type. High density and paste thickeners are similar to conventional thickeners, but with steeper cone angles and higher sided tanks. The extra height increases the pressure on the sediment bed and thus gives higher density underflow. Applications of paste thickeners include mine backfill and tailings disposal (Chapter 16). The clarifier is similar in design, but is less robust, handling suspensions of much lower solid content than the thickener and designed for removal of solids rather than their compaction (Seifert and Bowersox, 1990). Given the basic similarity in design, just the conventional thickener and its variants will be described in any detail.

The conventional thickener consists of a cylindrical tank, the diameter ranging from about 2 to 200 m in diameter, and of depth 1–7 m. The clarified liquid overflows a peripheral launder, while the solids, which settle over the entire bottom of the tank, are withdrawn as a thickened pulp from an outlet at the center. The zones in the thickener Figure 15.9 mirror those recognized in the batch cylinder sedimentation test (Figure 15.2).

Pulp is fed into the center via a feedwell placed up to 1 m below the surface. The feedwell is a small concentric cylinder with several key functions, including (Loan et al., 2009; Owen et al., 2009; Lake and Summerhays, 2012): controlling momentum dissipation, de-aerating feed slurry, diluting feed (if required), optimizing flocculation, and ensuring even distribution of the feed stream into the thickener. Within the tank are one or more rotating radial arms, from each of which are suspended a series of blades, shaped so as to rake the settled solids toward the central outlet. On most thickeners today these arms rise automatically if the torque exceeds a certain value, thus preventing damage due to overloading. The blades also assist the compaction of the settled particles and produce a thicker underflow than can be achieved by simple settling by assisting the removal of water. In paste thickeners the high yield stress of the suspension can lead to a phenomenon known as “rotating beds,” “doughnuts,” or “islands”, which should be avoided (Arbuthnot et al., 2005). This is associated with the presence of large aggregates that form ahead of and are compacted by the rotating blades. The solids in the thickener move continuously downwards, and then inwards toward the thickened underflow outlet, while the liquid moves upwards and radially outwards. In general, there is no region of constant composition in the thickener.
Thickener tanks are constructed of steel, concrete, or a combination of both, steel being most economical in sizes of less than 25 m in diameter. The tank bottom is often flat (e.g., Figure 15.10), while the mechanism arms are sloped toward the central discharge. With this design, settled solids must “bed-in” to form a false sloping floor. Steel floors are rarely sloped to conform to the rake arms because of expense. Concrete bases and sides become more common in the larger sized tanks. In many cases the settled solids, because of particle size, tend to slump and will not form a false bottom. In these cases the floor should be concrete and poured to match the slope of the arms. Tanks may also be constructed with sloping concrete floors and steel sides. Earth bottom thickeners are also in use, which are generally considered to be the lowest cost solution for thickener bottom construction (Hsia and Reinmiller, 1977).

The method of supporting the raking mechanism depends primarily on the tank diameter. In thickeners of diameter less than about 45 m, the drive head is usually supported on a superstructure spanning the tank, with the arms being attached to the drive shaft. Such machines are referred to as bridge or beam thickeners (Figure 15.10). The underflow is usually drawn from the apex of a cone located at the center of the sloping bottom.
A common arrangement for larger thickeners is to support the drive mechanism on a stationary steel or concrete center column. In most cases, the rake arms are attached to a drive cage, surrounding the central column, which is connected to the drive mechanism. The thickened solids are discharged through an annular trench encircling the center column (Figure 15.11). Figure 15.12 shows a thickener of this type in operation.


In the traction thickener, a single long arm is mounted with one end on the central support column, while to the other end are fixed traction wheels that run on a rail on top of the tank wall. The wheels are driven by motors that are mounted on the end of the arm and which therefore travel around with it. This is an efficient and economical design since the torque is transmitted through a long lever arm by a simple drive. They are manufactured in sizes ranging up to 200 m in diameter.
Cable thickeners have a hinged rake arm fastened to the bottom of the drive cage or center shaft. The rake arm is pulled by the cables connected to a torque or drive arm structure, which is rigidly connected to the center shaft at a point just below the liquid level. The hinge allows the rake to automatically lift when torque rises, which enables the rake arm to find its own efficient working level in the sludge, where the torque balances the rake weight. A feature of the design is the relatively small surface area of the raking mechanism.
In all thickeners, the speed of the raking mechanism is normally about 8 m min−1 at the perimeter, which corresponds to about 10 rev h−1 for a 15 m diameter thickener. Energy consumption is thus extremely low, such that even a 60 m unit may require only a 10 kW motor. Wear and maintenance costs are correspondingly low.
The underflow is usually withdrawn by pumping, although in clarifiers the material may be discharged under the hydrostatic head in the tank. The underflow is usually collected in a sludge-well in the center of the tank bottom, from where it is removed via piping through an underflow tunnel. The underflow lines should be as short and as straight as possible to reduce the risk of choking, and this can be achieved, with large tanks, by taking them up from the sludge-well through the center column to pumps placed on top, or by placing the pumps in the base of the column and pumping up from the bottom. This has the advantage of dispensing with the expensive underflow tunnel. A development of this is the caisson thickener, in which the rake assembly is supported on hydrostatic bearings and the center column is enlarged sufficiently to house a central control room; the pumps are located in the bottom of the column, which also contains the mechanism drive heads, motors, control panel, underflow suction, and discharge lines. The caisson concept has lifted the possible ceiling on thickener sizes.
Underflow pumps are often of the diaphragm type. These are positive action pumps for medium heads and volumes, and are suited to the handling of thick viscous fluids. They can be driven by an electric motor through a crank mechanism, or by directly acting compressed air. A flexible diaphragm is oscillated to provide suction and discharge through non-return valves, and variable speed can be achieved by changing either the oscillating frequency or the stroke. In some plants, variable-speed pumps are connected to nucleonic density gauges on the thickener underflow lines, which control the rate of pumping to maintain a constant underflow density. The thickened underflow is commonly pumped to filters for further dewatering.
Thickeners often incorporate substantial storage capacity so that, for instance, if the filtration section is shut down for maintenance, the concentrator can continue to feed material to the dewatering section. During such periods the thickened underflow should be recirculated into the thickener feedwell. At no time should the underflow cease to be pumped, as choking of the discharge cone rapidly occurs.
15.2.4 Thickener Operation and Control
The two primary functions of the thickener are the production of a clarified overflow and a thickened underflow of the required concentration. For a given throughput, the clarifying capacity is determined by the thickener diameter, since the surface area must be large enough so that the upward velocity of liquid is at all times lower than the settling velocity of the slowest settling particle that is to be recovered. The degree of thickening produced is controlled by the residence time of the particles and hence by the thickener depth.
The solids concentration in a thickener varies from that of the clear overflow to that of the thickened underflow being discharged (Figure 15.9). When materials settle with a definite interface between the suspension and the clear liquid, as is the case with most flocculated mineral pulps, the solids-handling capacity determines the surface area. Solids-handling capacity is defined as the capacity of a material of given dilution to reach a condition such that the mass rate of solids leaving a region is equal to or greater than the mass rate of solids entering the region. The attainment of this condition with a specific dilution depends on the mass subsidence rate being equal to or greater than the corresponding rise rate of displaced liquid. A properly sized thickener containing material of many different dilutions, ranging from the feed to the underflow solids contents, has adequate area such that the rise rate of displaced liquid at any region never exceeds the subsidence rate.
Operation of the thickener to provide clarified overflow depends upon the existence of a clear-liquid zone at the top. If the zone is too shallow, some of the smaller particles may escape in the overflow. The volumetric rate of flow upwards is equal to the difference between the rate of feed of liquid and the rate of removal in the underflow. Hence the required concentration of solids in the underflow, as well as the throughput, determines the conditions in the clarification zone. Although not normally a problem with clarifiers, a stable froth bed can sometimes form on the surface of thickeners which may hinder operation (overflow is from under the froth bed in these cases). Islands of solids may also form.
Control of thickeners requires certain measurements. Concha (2014) describes novel instrumentation for operations to provide estimates of settling velocity and “solids stress” on the compacted solids. For on-line measurements, the following are considered among the most important.
Bed Level
The ability to monitor the “bed level” in a thickener is crucial in enhancing efficiency (Ferrar, 2014). Incorrect measurements can lead to problems such as excess water reporting to the underflow, sludge spillage into the overflow, or incorrect feedback in control of flocculation. Various techniques are employed depending on the application, including: calculated bed level based on density and hydrostatic pressure; ultrasound transducers to sense reflections from the solid bed; buoyancy-based electromechanical system; and conductivity-based probes.
Feed Mass Flow Rate
This is important to control clarity of the overflow water. Throughput can be optimized by combining mass flow measurement with ratio control of the flocculant dosage.
Flocculant Dosage Rate
As flocculants are expensive, keeping dosage to a minimum consistent with target performance is a priority and is one key to minimizing operating costs (Ferrar, 2014).
15.2.5 Thickener Sizing
Sizing methods include by experience, cylinder (or jar) settling tests, and pilot plant testwork (McIntosh, 2009). Experience (or “rule of thumb”) is used if there is no sample, or to prepare a rough first draft for sizing equipment for budget purposes at the beginning of the project. Pilot plant testwork is the most reliable. A number of pilot plant units are available in various sizes and configurations. These units are small scale versions of commercial thickeners, with a feedwell, flocculant addition facility, underflow pumps, and rake mechanisms to duplicate the full-scale thickening process.
Batch settling tests, described above (Section 15.2.1), are most commonly used. There are two well-known methods to design thickeners based on the settling curve, the Coe and Clevenger (1916) method and the Talmage and Fitch (1955) method. The first determines the thickener area as follows.
If X is the liquid-to-solids ratio by weight at any region within the thickener, U the liquid-to-solids ratio of the thickener discharge, and W (t h−1) the dry solids feed rate to the thickener, then, assuming no solids leave with the overflow, (X – U)W (t h −1) mass of liquid moves upwards with velocity V (m h−1) :
(15.1)
where A is the thickener area (m2) and S the density of the liquid (t m−3). Because this upward velocity must not exceed the settling rate of the solids in this region, in the limit:
(15.2)
where R is the settling rate (m h−1).
The required thickener area (m2) is, therefore:
(15.3)
From a set of R and X values, the area required for various dilutions may be found by recording the initial settling rate as a function of dilution ranging from that of the feed to the discharge. The dilution corresponding to the maximum value of A represents the minimum solids-handling capacity and is the critical dilution. A scale up safety factor of between 1.2 and 1.5 is applied to A (Dahlstrom, 2003).
Originally proposed for suspensions without flocculant, in the Coe-Clevenger method the error in determining the settling rate increases as the flocculant dosage is increased. Parsapour et al. (2014) have proposed a modified procedure to account for the addition of flocculant.
The Coe and Clevenger method requires multiple batch tests at different pulp densities before an acceptable unit area can be selected. The Kynch model (1952) offers a way of obtaining the required area from a single batch-settling curve and is the basis of several thickening theories, which have been comprehensively reviewed by Pearse (1977) and Concha (2014).
The Talmage and Fitch method (1955) applies Kynch’s model to the problem of thickener design. They showed that by constructing a tangent to the curve at any point on the settling curve (Figure 15.13), then:
(15.4)
where H cm is the interface height corresponding to a uniform slurry of concentration C (kg l−1) at the point where the tangent was taken, C0 (kg l−1) is the original feed solids concentration, and H0 cm the original interface height. Therefore, for any selected point on the settling curve, the local concentration can be obtained from Eq. (15.4), and the settling rate from the gradient of the tangent at that point. Thus a set of data of concentration against settling rate can be obtained from the single batch-settling curve.

To understand the approach we start by rewriting Eq. (15.3) in terms of concentration C. For a pulp of solids concentration C (kg l−1), the volume occupied by the solids in 1 liter of pulp is C/d, where d (kg l−1) is the density of dry solids.
Therefore the weight of water in 1 liter of pulp is
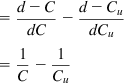
and the water–solids ratio by weight becomes
For pulps of concentrations C kg l−1 of solids, and Cu kg l−1 of solids, the difference in water–solids ratio is
Therefore, the values of concentration obtained, C, and the settling rates, R, can be substituted in the Coe and Clevenger Eq. (15.3) to give:
(15.5)
where Cu is the underflow solids concentration. (Note, to preserve A in m2 C is now in t m−3 and S is eliminated.)
A simplified version of the Talmage and Fitch method is offered by determining the point on the settling curve where the solids go into compression. This point corresponds to the critical sedimentation point in Figure 15.2, and controls the area of thickener required. In Figure 15.13, C is the critical sedimentation point (or compression point) and a tangent is drawn to the curve at this point, intersecting the ordinate at H. A line is drawn parallel to the abscissa corresponding to the target underflow solids concentration Cu which intersects the ordinate at Hu. The tangent from C intersects this line at a time corresponding to tu.
The required thickener area from Eq. (15.5) is then:
where R=(H–Hu)/tu is the gradient of the tangent at point C, that is, the settling rate of the particles at the compression point concentration. Since CH=C0H0, then:
That is,
(15.6)
In most cases, the compression point concentration will be less than that of the underflow concentration. In cases where this is not so, the tangent construction is not necessary, and tu is the point where the underflow line crosses the settling curve. The point of compression on the curve can be clear, but when this is not so, a variety of methods have been suggested for its determination (Fitch, 1977; Pearse, 1980; Laros et al., 2002).
The Coe and Clevenger and modified Talmage and Fitch methods are the most widely used in the metallurgical industry to predict thickener area requirements. Both methods have limitations (Waters and Galvin, 1991; Parsapour et al., 2014): the Talmage and Fitch technique relying critically on identifying a compression point, and both methods must be used in conjunction with empirical safety factors. However, the results of these methods are similar when the settling tests are carried out either on a single sample with the solids concentration of the thickener feed using the Talmage and Fitch method or on diluted samples using the Coe and Clevenger method (Parsapout et al., 2014).
Software has been developed for prediction of thickener area based on a phenomenological model of particle settling. The development of thickener models is reviewed by Concha and Burger (2003) and Concha (2014).
The mechanism of solids consolidation has been far less well expressed in mathematical terms than the corresponding clarifying mechanisms. The height of the thickener is, therefore, usually determined by experience.
15.2.6 Other Gravity Sedimentation Devices
Tray Thickener
The diameter of a conventional thickener is usually large and therefore a large ground area is required. Tray thickeners (Figure 15.14) are sometimes installed to save space. In essence, a tray thickener is a series of unit thickeners mounted vertically above one another. They operate as separate units, but a common central shaft is utilized to drive the sets of rakes.

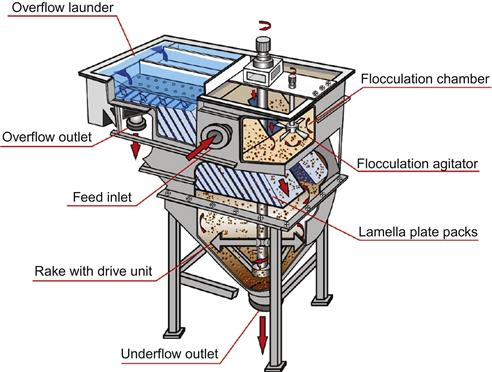
Lamella Thickener
Also known as an inclined plate settler, it has two main parts, an upper tank containing lamella plates inclined at 55° and a lower conical or cylindrical tank with a rake mechanism (Figure 15.15). The inclined plate gives a short distance for particle sedimentation, and with low friction, sliding down the plate increases the speed of separation (Anon., 2011). Clarification (clear supernatant) is achieved when the upstream liquid velocity is sufficiently low to allow solids to settle to the plate. Thickening is achieved through a combination of sedimentation onto the plate (“primary thickening”) and conventional sedimentation in the lower tank.
15.3 Centrifugal Sedimentation
Centrifugal separation can be regarded as an extension of gravity separation, as the settling rates of particles are increased under the influence of centrifugal force. It can, however, be used to separate emulsions which are normally stable in a gravity field.
Centrifugal separation can be performed either by hydrocyclones or centrifuges. The simplicity and cheapness of the hydrocyclone (Chapter 9) make it very attractive, although it suffers from restrictions with respect to the solids concentration that can be achieved and the relative proportions of overflow and underflow into which the feed may be split. Generally, the efficiency of even a small-diameter hydrocyclone falls off rapidly at very fine particle sizes and particles smaller than about 10 µm in diameter will invariably appear in the overflow, unless they have high density. Flocculation of such particles is limited, since the high shear forces due to the cyclonic action break up the agglomerates. The hydrocyclone is therefore inherently better suited to classification rather than thickening. Its dry counterpart, the (air) cyclone, is widely used for “dust” removal in a variety of industrial applications.
By comparison, centrifuges are much more costly and complex, but have a much greater clarifying power and are generally more flexible than hydrocyclones. Various types of centrifuge are used industrially (Bragg, 1983; Bershad et al., 1990; Leung, 2002), the solid bowl centrifuge (or decanter) having widest use in the minerals industry due to its versatility and ability to discharge the solids continuously.
The basic principles of a typical centrifuge are shown in Figure 15.16. It consists of a horizontal revolving shell or bowl, cylindroconical in form, inside which a screw conveyor of similar section rotates in the same direction at a slightly higher or lower speed. The feed pulp is admitted to the bowl through the center tube of the revolving-screw conveyor. On leaving the feed pipe, the slurry is immediately subjected to a high centrifugal force, causing the solids to settle on the inner surface of the bowl at a rate which depends on the rotational speed employed, this normally being between 1,600 and 8,500 rev min−1. The separated solids are conveyed by the scroll out of the liquid and discharged through outlets at the smaller end of the bowl. The solids are continuously dewatered by centrifugal force as they proceed from the liquid zone to the discharge. Excess entrained liquor drains away to the pond circumferentially through the particle bed. When the liquid reaches a predetermined level, it overflows through the discharge ports at the larger end of the bowl.

The actual size and geometry of these centrifuges vary according to the throughput required and the application. The length of the cylindrical section largely determines the clarifying power and is thus made a maximum where overflow clarity is of prime importance. The length of the conical section, or “beach,” decides the residual moisture content of the solids, so that a long shallow cone is used where maximum dryness is required.
Centrifuges are manufactured with bowl diameters ranging from 15 to 150 cm, the length generally being about twice the diameter. Throughputs vary from about 0.5 to 50 m3 h−1 of liquid and from about 0.25 to 100 t h−1 of solids, depending on the feed concentration, which may vary widely from 0.5% to 70% solids, and on the particle size, which may range from about 12 mm to as fine as 2 µm, or even less when flocculation is used. The application of flocculation is limited by the tendency of the scroll action to damage the flocs and thus redisperse the fine particles. The moisture content in the product varies widely, typically being in the range 5–20%.
15.4 Filtration
Filtration is the process of separating solids from liquid by means of a porous medium (the filter) which retains the solid but allows the liquid to pass. The most common filter type in mineral processing is cake filtration, where the liquid passes through the filter, called the filtrate, and the solids build-up on the filter is referred to as filter cake. The volume of filtrate collected per unit time is the rate of filtration. There are typically five steps in the process: cake formation, moisture reduction, cake washing (if required), cake discharge, and medium washing.
Filtration in mineral processing applications normally follows thickening. The thickened pulp may be fed to storage agitators from where it is drawn off at uniform rate to the filters. Flocculants are sometimes added to the agitators in order to aid filtration. Slimes have an adverse effect on filtration, as they tend to “blind” the filter medium; flocculation reduces this and increases the voidage between particles, making filtrate flow easier. The lower molecular weight flocculants tend to be used in filtration, as the flocs formed by high molecular weight products are relatively large, and entrain water within the structure, increasing the moisture content of the cake. With the lower molecular weight flocculants, the filter cake tends toward a uniform porous structure which allows rapid dewatering, while still preventing migration of fine particles through the cake (Moss, 1978). Other surfactant filter aids are used to reduce the liquid surface tension, or more likely, to modify particle surface properties to assist flow through the medium (Singh et al., 1998; Wang et al., 2010; Asmatulu and Yoon, 2012).
There is a large body of literature on types of filters, filtration principles, equipment selection, testing and sizing (Wakeman and Tarleton, 1999; Svarovsky, 2000; Rushton et al., 2000; Smith and Townsend, 2002; Cox and Traczyk, 2002; Welch, 2002; Dahlstrom, 2003; Stickland, 2008; Concha, 2014).
15.4.1 Brief Theory
Concha (2014) provides comprehensive theoretical treatment; the brief summary here based on Smith and Townsend (2002), Cox and Traczyk (2002), and Dahlstrom (2003) is just to introduce the main operational variables. Starting with the classical theory of Darcy and Poiseuille, the basic filtration equation can be written as:
(15.7)
where v is filtrate flow rate (m s−1), A area of filter (m2), V filtrate volume (m3), t time (s), ΔP pressure drop across the cake and medium (N m−2), μ liquid viscosity (N.s m−2), α specific cake resistance (m kg−1), and w feed slurry concentration in terms of dry solids mass per unit of filtrate volume (kg m−3). The equation may be modified by adding a resistance term for the filter medium.
Equation (15.7) shows that the filtration rate varies directly with the pressure drop across the filter and the area of the filter, and inversely with liquid viscosity, cake resistance (reciprocal of cake permeability), and slurry solids contents. These factors determine the necessary test variables in sizing filters.
The cake comprises a bundle of capillaries and water can be removed only when the applied pressure is greater than the capillary pressure PC given by:
(15.8)
where γl is the liquid surface tension, θ the contact angle, and dC is the diameter of the capillary. Equation (15.8) indicates why surfactant filter aids can assist, by decreasing surface tension and/or increasing contact angle (Asmatulu and Yoon, 2012). The equation also indicates that filtration becomes more difficult as particle size decreases, as the capillary (pore) diameter tends to decrease.
15.4.2 The Filter Medium
The choice of the filter medium is often the most important consideration in assuring efficient operation of a filter. Its function is generally to act as a support for the filter cake, while the initial layers of cake provide the true filter. The filter medium should be selected primarily for its ability to retain solids without blinding. It should be mechanically strong, corrosion resistant, and offer as little resistance to flow of filtrate as possible. Relatively coarse materials are normally used and clear filtrate is not obtained until the initial layers of cake are formed, the initial cloudy filtrate being recycled.
Filter media are manufactured from cotton, wool, linen, jute, silk, glass fiber, porous carbon, metals, rayon, nylon and other synthetics, ceramic, and miscellaneous materials such as porous rubber. Cotton fabrics are among the most common type of medium, primarily because of their low initial cost and availability in a wide variety of weaves.
15.4.3 Filtration Tests
It is not normally possible to forecast what may be accomplished in the filtration of an untested product, therefore preliminary tests have to be made on representative samples of pulp before the large-scale plant is designed. Bench scale testing of samples for specification of filtration equipment is described by Smith and Townsend (2002) and Tarleton and Wakeman (2006). Tests are also commonly carried out on pulps from existing plants, to assess the effect of changing operating conditions, filter aids, etc.
It is necessary to identify what are the objectives, for example, target moisture, and what are the candidate filter types, for example, pressure or vacuum? The slurry physical and chemical conditions that need to be replicated in the sample should include: solids concentration, particle density and size distribution, slurry pH, and chemical additives (e.g., flotation reagents and flocculants).
Vacuum Filtration Test
A simple vacuum filter leaf test setup is shown in Figure 15.17. The filter leaf, consisting of a section of the industrial filter medium, is connected to a filtrate receiver equipped with a vacuum gauge. A known weight of slurry is introduced sufficient to approximate the target cake thickness. The receiver is connected to a vacuum pump. If the industrial filter is to be a continuous vacuum filter, this operation must be simulated in the test. The cycle is divided into three sections: cake formation (or “pick-up”), drying, and discharge. Sometimes pick-up is followed by a period of washing and the cake may also be subjected to compression during drying. While under vacuum, the test leaf is submerged for the pick-up period in the agitated pulp to be tested. The leaf is then removed and held with the drainpipe down for the allotted drying time.

At the end of drying, the filter cake is removed and the net weight and cake thickness are recorded. The sample is dried and weighed to determine moisture content. The daily filter capacity can then be determined by the dry weight of cake per unit area of test leaf multiplied by the daily number of cycles and the filter area. A range of conditions should be tested to cover the range of anticipated variables.
Pressure Filtration Test
Bench-scale pressure filtration testwork can be performed using a bomb device. A typical apparatus is a 250 mm length of 50 mm (outer-wall diameter) pipe capped with flanges. The lower flange supports the test filter cloth on a drainage grid above the filtrate collection port. The upper flange houses the air pressure connection, pressure gauge, and feed port. The test procedure is similar to that described above, with applied pressure being substituted for vacuum. A new pressure test procedure, step pressure filtration, suited to flocculated feeds, is described by Usher et al. (2001) and De Kretser et al. (2011).
15.4.4 Types of Filter
For particles coarse enough that capillary pressures are negligible (Eq. (15.8)), gravimetric dewatering can be employed, for example, dewatering screens in dense media recovery (Chapter 11). This is not usually the case and cake filters are the type most frequently used in mineral processing, where the recovery of large amounts of fine solids (typically <100 µm) from fairly concentrated slurries (50–60% solids) is the main requirement. Cake filters may be pressure or vacuum types, and operation may be batch or continuous (Cox and Traczyk, 2002). In pressure filters positive pressure is applied at the feed end and in vacuum filters there is a vacuum at the far side of the filter, the feed side being at atmospheric pressure. Dewatering is a combination of cake compression and air blow through.
Pressure Filters
Because of the increasing fineness of mineral concentrates (those of Cu, Pb, and Zn are commonly 80%< 30 μm), coupled with shipping schedules calling for moisture contents 8–10 wt% on these fine concentrates, filtration under pressure has certain advantages over vacuum. (Given that many operations are at high altitude is an additional drawback for vacuum units.) Higher flow rates and better washing and drying result from the higher pressures that can be used. Pressure filters have become sufficiently large and reliable to handle the output of most concentrators and can produce low enough cake moisture to eliminate driers (Townsend, 2003). Thus, the trend is to pressure filtration (Cox and Traczyk, 2002).
The common pressure filters in mineral processing applications come in two basic forms, horizontal and vertical, defined either by the orientation of the filter plates (Concha, 2014), or the convention here, by the direction the pressure is applied: actuation either horizontally or vertically (Cox and Traczyk, 2002). They both represent more automated versions of plate-and-frame filters (Taggart, 1945; McCaslin et al., 2014).
Horizontal Pressure Filters
A typical horizontal filter is shown in Figure 15.18. In this arrangement, filter plates, usually made from lightweight polymer, are suspended vertically from a steel frame (hence the alternative name vertical plate pressure filter). Between the plates is hung filter cloth. The plates are held together and the press is opened and closed by a hydraulic piston. The slurry is pumped into the press to fill each chamber. Dewatering starts immediately the slurry enters, and the filtrate is removed. When the chamber is full of material, membranes on one side of the chamber are pressurized to hold the cake in place and squeeze out some water. At the end of this “feeding cycle”, the main dewatering cycle is activated by forcing pressurized air through the cake, the “air dewatering cycle” with pressures up to 8 bar. A “washing cycle” could be incorporated, the cake washed by replacing air by liquid with air pressure then re-applied to achieve final moisture.

At completion, the press is opened, the plates separate and the cake falls by gravity onto a conveyor. To finish, the filter cloth is cleaned by a combination of vibration and water sprays, the washings recycled to the feed tank, the chambers closed and the cycle repeated. While the operation is batch, with cycle times of ca. 10 min and a feed tank with sufficient storage, operation appears continuous.
Vertical Pressure Filters
These differ from the horizontal units by stacking the chambers on top of each other and rather than individual filter cloths between each chamber, the cloth in the vertical unit is continuous (Figure 15.19). The filtration cycle is similar to that for horizontal units. At completion, the press is opened and the filter cloth advanced to discharge the cake, followed by cloth washing. Both horizontal and vertical units are automated to control the various cycle times and may include sensors to monitor, for example, cloth condition (Townsend, 2003).

Tube Press
In some situations, dewatering of ultrafine (<10 μm) material requires special equipment. Large capillary resistance forces demand greater air pressures (Eq. (15.8)) than in the units described above. By performing filtration in a tube, pressures up to 100 bar can be exploited. The tube press has been applied in a variety of difficult dewatering applications. It consists of a casing with a membrane at each end and a porous tube (or “candle”) covered with cloth suspended inside. Feed is introduced under pressure to fill the casing and cake starts to form on the candle. Dewatering pressure is applied by the membrane and an air blow. Cake washing can also be incorporated. On completion, the membrane is retracted, and the candles lowered to discharge the cake, which can be aided by air blown behind the cloth. The candle is re-inserted in the casing and the cycle repeats. A related device is the “candle filter”, which consists of a series of porous tubes (candles) inside a pressurized chamber (Concha, 2014) (Figure 15.20).

Vacuum Filters
There are many different types of vacuum filter, but they all incorporate filter media suitably supported on a drainage system, beneath which the pressure is reduced by connection to a vacuum system.
Batch Vacuum Filters
There are two main types, the vertical leaf filter and the horizontal leaf or tray filter, which are similar except for the orientation of the leaf. The leaf consists of a metal framework or a grooved plate over which the filter cloth is fixed (Figure 15.21). Numerous holes are drilled in the pipe framework, so that when a vacuum is applied, a filter cake builds up on both sides of the leaf. A number of leaves are generally connected. For example, in the vertical leaf filter, the array is first immersed in slurry held in a slurry feed tank, removed, and then placed in a cake-receiving tank where the cake is removed by replacing the vacuum by air pressure. Although simple to operate, these filters require considerable floor space. They are now used only for clarification, that is, the removal of small amounts of suspended solids from liquors.

Continuous Vacuum Filters
These are the most widely used filters in mineral processing applications and fall into three classes: drums, discs, and horizontal filters.
Rotary-Drum Filter
This is the most common, finding application both where cake washing is required and where it is unnecessary. The drum is mounted horizontally and is partially submerged in the filter trough, into which the feed slurry is fed and maintained in suspension by agitators (Figure 15.22). The periphery of the drum is divided into compartments, each of which is provided with a number of drain lines, which pass through the inside of the drum, terminating at one end as a ring of ports, which are covered by a rotary valve to which vacuum is applied. The filter medium is wrapped tightly around the drum surface which is rotated at low speed, usually in the range 0.1–0.3 rev min−1, but up to 3 rev min−1 for fast filtering materials.

As the drum rotates, each compartment goes through the same cycle of operations, the duration of each being determined by the drum speed, the depth of submergence of the drum, and the arrangement of the valve. The normal cycle of operations consists of filtration, drying, and discharge, but it is possible to introduce other operations into the basic cycle, such as cake washing and cloth cleaning.
Various methods are used for discharging the solids from the drum, depending on the material being filtered. The most common form makes use of a reversed blast of air, which lifts the cake so that it can be removed by a knife, without the latter actually contacting the medium. Another method is string discharge, where a number of endless strings around the drum lift the filter cloth as it leaves the drum and the cake falls off. It is rarely used today. An advance on this method is belt discharge, as shown in Figure 15.22, where the filter medium itself leaves the filter and passes over an external roller, before returning to the drum. This has a number of advantages in that very much thinner cakes can be handled, with consequently increased filtration and draining rates and hence better washing and dryer products. At the same time, the cloth can be washed on both sides by means of sprays before it returns to the drum, thus minimizing the extent of blinding. Cake washing is usually carried out by means of sprays or weirs, which cover a fairly limited area at the top of the drum.
The capacity of the vacuum pump will be determined mainly by the amount of air sucked through the cake during the washing and drying periods when, in most cases, there will be a simultaneous flow of both liquid and air. A typical layout is shown in Figure 15.23, from which it is seen that the air and liquid are removed separately. The barometric leg should be at least 10 m high to prevent liquid being sucked into the vacuum pump.

Variations on standard drum filters to enable them to handle coarse, free-draining, quick-settling materials include top feed units where the material is distributed at between 90 and 180° from the feed point.
Disc Filter
The principle of operation of disc filters (Figure 15.24), is similar to that of rotary drum filters. The disc filter consists of sectors of cloth covered steel mounted on a central shaft that also connects a certain number of the sectors to vacuum. The solids cake is formed on both sides of the disc; the disc rotates and lifts the cake above the level of the slurry in the trough, whereupon the cake is suction-dried and is then removed by a pulsating air blow with the assistance of a scraper. Several discs are mounted along the shaft separated by about 30 cm and consequently a large filtration area can be accommodated in a small floor space. Cost per unit area is thus lower than for drum filters, but cake washing is virtually impossible with the disc filter.

Ceramic Disc Filter
A special type of disc filter uses micro-pore ceramic sectors rather than ones of steel covered with cloth. When submerged in the slurry pool, capillary action assists drawing liquid through the pores of the filter. This can be understood by reference to Eq. (15.8); for the filter (as opposed to the cake) we want the capillary pressure to be high, achieved by having small pore diameter and strongly hydrophilic material, that is, ceramic. The action reduces the size of vacuum pump required, resulting in reduced energy consumption. Referred to as capillary filtration, it can produce moisture contents that approach pressure filtration and has found application on mineral concentrates (Cox and Traczyk, 2002; Concha, 2014).
Horizontal Belt Filter
If ultimate cake moisture is not critical, but rather water recovery or production of solids that can be handled or stored is critical, then the belt filter may be suitable (Figure 15.25). Examples include tailings dewatering at operations with limited space or environmental restrictions on disposal in tailings ponds, and recovery of leach liquors in hydrometallurgical operations. It comprises an endless perforated rubber drainage deck supporting the filter cloth. Vacuum is applied by a series of suction boxes underneath the belt. Varying the number of the suction boxes gives control over the length of the filtration, drying, and washing (if included) stages. The cake is discharged as the belt reverses over a small diameter roller.

Pan Filter
This consists of a series of horizontal trays supporting the filter cloth rotating around a central vertical axis and connected to a common suction valve. The trays are trapezoidal in shape to accommodate the rotation and slightly tilted toward the center. Cake builds, can be washed, and is discharged by tipping the tray. Compared to a disc filter, which has two sides forming cake, the pan filter, with only one side, is lower capacity.
Hyperbaric Filters
By placing a conventional disc or drum vacuum filter inside a pressurized vessel, the available pressure drop can be increased, up to four bars or more (Bott et al., 2003; Concha, 2014). Cake moisture levels can be reduced from typically 15% in vacuum filters to ca. 8%. As with all pressure filters, cake discharge is a problem.
15.5 Drying
The drying of concentrates prior to shipping, if done, is the last operation performed in the mineral processing plant. It reduces the cost of transport and is usually aimed at lowering the moisture content to about 5 wt%. Dust losses are often a problem if the moisture content is lower.
Prokesch (2002), Mujumdar (2006), and Kudra and Mujumdar (2009) review the types of drying equipment available and describe dryer selection based on the required duty. The dryer types include hearth, grate, shaft, fluidized bed, and flash. The one often used in concentrators is the rotary dryer.
Rotary Thermal Dryer
This unit consists of a relatively long cylindrical shell mounted on rollers and driven at a speed of up to 25 rev min−1. The shell is at a slight slope, so that material moves from the feed to discharge end under gravity. Hot gases, or air, are fed in either at the feed end to give parallel flow or at the discharge to give counter-current flow.
The method of heating may be either direct, in which case the hot gases pass through the material in the dryer, or indirect, where the material is in an inner shell, heated externally by hot gases. The direct-fired is the one most commonly used in the minerals industry, the indirect-fired type being used when the material must not contact the hot combustion gases. Parallel flow dryers (Figure 15.26) are used in the majority of operations because they are more fuel efficient and have greater capacity than counterflow types (Kram, 1980). Since heat is applied at the feed end, build-up of wet feed is avoided, and in general these units are designed to dry material to not less than 1% moisture. Since counter-flow dryers apply heat at the discharge end, a completely dry product can be achieved, but its use with heat-sensitive materials is limited because the dried material comes into direct contact with the heating medium at its highest temperature.

The product from the dryers is often stockpiled, before being loaded on to trucks or rail-cars as required for shipment. To control dust, containers may be closed, or the surface of the contents sprayed with various dust suppressing solutions (Kolthammer, 1978).