
Introduction
The forms in which metals are found in the crust of the earth and as seabed deposits depend on their reactivity with their environment, particularly with oxygen, sulfur, and carbon dioxide. Gold and platinum metals are found principally in the native or metallic form. Silver, copper, and mercury are found native as well as in the form of sulfides, carbonates, and chlorides. The more reactive metals are always in compound form, such as the oxides and sulfides of iron and the oxides and silicates of aluminum and beryllium. The naturally occurring compounds are known as minerals, most of which have been given names according to their composition (e.g., galena—lead sulfide, PbS; cassiterite—tin oxide, SnO2).
Keywords
Minerals; ores; liberation; separation; economics; sustainability
1.1 Minerals
The forms in which metals are found in the crust of the earth and as seabed deposits depend on their reactivity with their environment, particularly with oxygen, sulfur, and carbon dioxide. Gold and platinum metals are found principally in the native or metallic form. Silver, copper, and mercury are found native as well as in the form of sulfides, carbonates, and chlorides. The more reactive metals are always in compound form, such as the oxides and sulfides of iron and the oxides and silicates of aluminum and beryllium. These naturally occurring compounds are known as minerals, most of which have been given names according to their composition (e.g., galena—lead sulfide, PbS; cassiterite—tin oxide, SnO2).
Minerals by definition are natural inorganic substances possessing definite chemical compositions and atomic structures. Some flexibility, however, is allowed in this definition. Many minerals exhibit isomorphism, where substitution of atoms within the crystal structure by similar atoms takes place without affecting the atomic structure. The mineral olivine, for example, has the chemical composition (Mg,Fe)2SiO4, but the ratio of Mg atoms to Fe atoms varies. The total number of Mg and Fe atoms in all olivines, however, has the same ratio to that of the Si and O atoms. Minerals can also exhibit polymorphism, different minerals having the same chemical composition, but markedly different physical properties due to a difference in crystal structure. Thus, the two minerals graphite and diamond have exactly the same composition, being composed entirely of carbon atoms, but have widely different properties due to the arrangement of the carbon atoms within the crystal lattice.
The term “mineral” is often used in a much more extended sense to include anything of economic value that is extracted from the earth. Thus, coal, chalk, clay, and granite do not come within the definition of a mineral, although details of their production are usually included in national figures for mineral production. Such materials are, in fact, rocks, which are not homogeneous in chemical and physical composition, as are minerals, but generally consist of a variety of minerals and form large parts of the earth’s crust. For instance, granite, which is one of the most abundant igneous rocks, that is, a rock formed by cooling of molten material, or magma, within the earth’s crust, is composed of three main mineral constituents: feldspar, quartz, and mica. These three mineral components occur in varying proportions in different parts of the same granite mass.
Coals are a group of bedded rocks formed by the accumulation of vegetable matter. Most coal-seams were formed over 300 million years ago by the decomposition of vegetable matter from the dense tropical forests which covered certain areas of the earth. During the early formation of the coal-seams, the rotting vegetation formed thick beds of peat, an unconsolidated product of the decomposition of vegetation, found in marshes and bogs. This later became overlain with shales, sandstones, mud, and silt, and under the action of the increasing pressure, temperature and time, the peat-beds became altered, or metamorphosed, to produce the sedimentary rock known as coal. The degree of alteration is known as the rank of the coal, with the lowest ranks (lignite or brown coal) showing little alteration, while the highest rank (anthracite) is almost pure graphite (carbon).
While metal content in an ore is typically quoted as percent metal, it is important to remember that the metal is contained in a mineral (e.g., tin in SnO2). Depending on the circumstances it may be necessary to convert from metal to mineral, or vice versa. The conversion is illustrated in the following two examples (Examples 1.1 and 1.2).
Example 1.1
Given a tin concentration of 2.00% in an ore, what is the concentration of cassiterite (SnO2)?
Solution
Step 1: What is the Sn content of SnO2?
Molar mass of Sn (MSn) 118.71 g mol−1
Molar mass of O (MO) 15.99 g mol−1
Step 2: Convert Sn concentration to SnO2
Example 1.2
A sample contains three phases, chalcopyrite (CuFeS2), pyrite (FeS2), and non-sulfides (containing no Cu or Fe). If the Cu concentration is 22.5% and the Fe concentration is 25.6%, what is the concentration of pyrite and of the non-sulfides?
Solution
Note, Fe occurs in two minerals which is the source of complication. The solution, in this case, is to calculate first the % chalcopyrite using the %Cu data in a similar manner to the calculation in Example 1.1 (Step 1), and then to calculate the %Fe contributed by the Fe in the chalcopyrite (Step 2) from which %Fe associated with pyrite can be calculated (Step 3).
Molar masses (g mol−1): Cu 63.54; Fe 55.85; S 32.06
Step 1: Convert Cu to chalcopyrite (Cp)
Step 2: Determine %Fe in Cp
Step 3: Determine %Fe associated with pyrite (Py)
Step 4: Convert Fe to Py (answer to first question)
Step 5: Determine % non-sulfides (answer to second question)
The same element may occur in more than one mineral and the calculation becomes a little more involved.
1.2 Abundance of Minerals
The price of metals is governed mainly by supply and demand. Supply includes both newly mined and recycled metal, and recycling is now a significant component of the lifecycle of some metals—about 60% of lead supply comes from recycled sources. There have been many prophets of doom over the years pessimistically predicting the imminent exhaustion of mineral supplies, the most extreme perhaps being the “Limits to Growth” report to the Club of Rome in 1972, which forecast that gold would run out in 1981, zinc in 1990, and oil by 1992 (Meadows et al., 1972). Mouat (2011) offers some insights as to the past and future of mining.
In fact, major advances in productivity and technology throughout the twentieth century greatly increased both the resource base and the supply of newly mined metals, through geological discovery and reductions in the cost of production. These advances actually drove down metal prices in real terms, which reduced the profitability of mining companies and had a damaging effect on economies heavily dependent on resource extraction, particularly those in Africa and South America. This in turn drove further improvements in productivity and technology. Clearly mineral resources are finite, but supply and demand will generally balance in such a way that if supplies decline or demand increases, the price will increase, which will motivate the search for new deposits, or technology to render marginal deposits economic, or even substitution by other materials. Gold is an exception, its price having not changed much in real terms since the sixteenth century, due mainly to its use as a monetary instrument and a store of wealth.
Estimates of the crustal abundances of metals are given in Table 1.1 (Taylor, 1964), together with the amounts of some of the most useful metals, to a depth of 3.5 km (Tan and Chi-Lung, 1970).
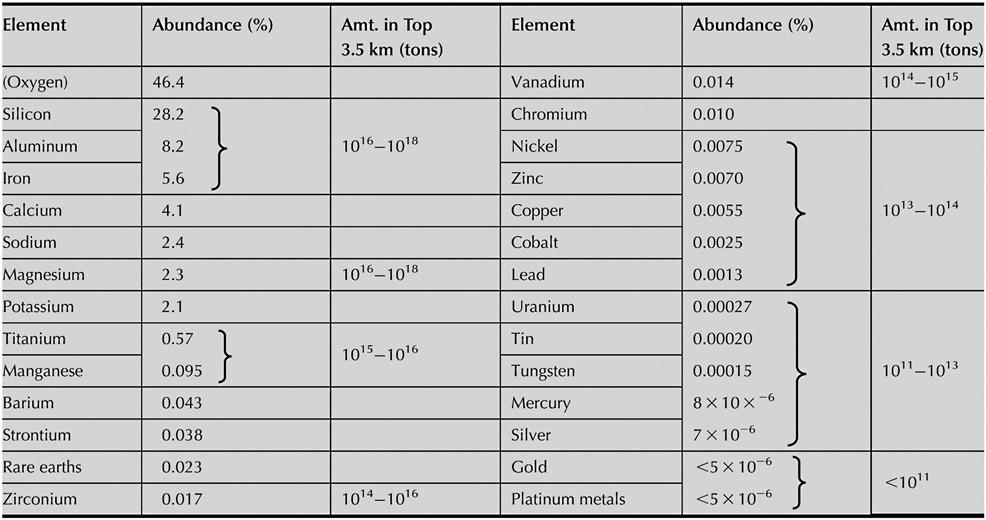
The abundance of metals in the oceans is related to some extent to the crustal abundances, since they have come from the weathering of the crustal rocks, but superimposed upon this are the effects of acid rainwaters on mineral leaching processes; thus, the metal availability from seawater shown in Table 1.2 (Tan and Chi-Lung, 1970) does not follow precisely that of the crustal abundance. The seabed may become a viable source of minerals in the future. Manganese nodules have been known since the beginning of the nineteenth century (Mukherjee et al., 2004), and mineral-rich hydrothermal vents have been discovered (Scott, 2001). Mining will eventually extend to space as well.

It can be seen from Table 1.1 that eight elements account for over 99% of the earth’s crust: 74.6% is silicon and oxygen, and only three of the industrially important metals (aluminum, iron, and magnesium) are present in amounts above 2%. All the other useful metals occur in amounts below 0.1%; copper, for example, which is the most important non-ferrous metal, occurring only to the extent of 0.0055%. It is interesting to note that the so-called common metals, zinc and lead, are less plentiful than the rare-earth metals (cerium, thorium, etc.).
1.3 Deposits and Ores
It is immediately apparent that if the minerals containing important metals were uniformly distributed throughout the earth, they would be so thinly dispersed that their economic extraction would be impossible. However, the occurrence of minerals in nature is regulated by the geological conditions throughout the life of the mineral. A particular mineral may be found mainly in association with one rock type (for example, cassiterite mainly associates with granite rocks) or may be found associated with both igneous and sedimentary rocks (i.e., those produced by the deposition of material arising from the mechanical and chemical weathering of earlier rocks by water, ice, and chemical decay). Thus, when granite is weathered, cassiterite may be transported and redeposited as an alluvial deposit. Besides these surface processes, mineral deposits are also created due to magmatic, hydrothermal, sedimentary, and other geological events (Ridley, 2013).
Due to the action of these many natural agencies, mineral deposits are frequently found in sufficient concentrations to enable the metals to be profitably recovered; that is, the deposit becomes an ore. Most ores are mixtures of extractable minerals and extraneous nonvaluable material described as gangue. They are frequently classed according to the nature of the valuable mineral. Thus, in native ores the metal is present in the elementary form; sulfide ores contain the metal as sulfides, and in oxidized ores the valuable mineral may be present as oxide, sulfate, silicate, carbonate, or some hydrated form of these. Complex ores are those containing profitable amounts of more than one valuable mineral. Metallic minerals are often found in certain associations within which they may occur as mixtures of a wide range of grain sizes or as single-phase solid solutions or compounds. Galena and sphalerite, for example, are commonly associated, as, to a lesser extent, are copper sulfide minerals and sphalerite. Pyrite is almost always associated with these minerals as a sulfide gangue.
There are several classifications of a deposit, which from an investment point of view it is important to understand: mineral resources are potentially valuable and are further classified in order of increasing confidence into inferred, indicated, and measured resources; mineral (ore) reserves are known to be economically (and legally) feasible for extraction and are further classified, in order of increasing confidence, into probable and proved reserves.
1.4 Metallic and Nonmetallic Ores
Ores of economic value can be classed as metallic or nonmetallic, according to the use of the mineral. Certain minerals may be mined and processed for more than one purpose. In one category, the mineral may be a metal ore, that is, when it is used to prepare the metal, as when bauxite (hydrated aluminum oxide) is used to make aluminum. The alternative is for the compound to be classified as a nonmetallic ore, that is, when bauxite or natural aluminum oxide is used to make material for refractory bricks or abrasives.
Many nonmetallic ore minerals associate with metallic ore minerals (Appendixes I and II) and are mined and processed together. For example, galena, the main source of lead, sometimes associates with fluorite (CaF2) and barytes (BaSO4), both important nonmetallic minerals.
Diamond ores have the lowest grade of all mined ores. One of the richest mines in terms of diamond content, Argyle (in Western Australia) enjoyed grades as high as 2 ppm in its early life. The lowest grade deposits mined in Africa have been as low as 0.01 ppm. Diamond deposits are mined mainly for their gem quality stones which have the highest value, with the low-value industrial quality stones being essentially a by-product: most industrial diamond is now produced synthetically.
1.5 The Need for Mineral Processing
“As-mined” or “run-of-mine” ore consists of valuable minerals and gangue. Mineral processing, also known as ore dressing, ore beneficiation, mineral dressing, or milling, follows mining and prepares the ore for extraction of the valuable metal in the case of metallic ores, or to produce a commercial end product as in the case of minerals such as potash (soluble salts of potassium) and coal. Mineral processing comprises two principal steps: size reduction to liberate the grains of valuable mineral (or paymineral) from gangue minerals, and physical separation of the particles of valuable minerals from the gangue, to produce an enriched portion, or concentrate, containing most of the valuable minerals, and a discard, or tailing (tailings or tails), containing predominantly the gangue minerals. The importance of mineral processing is today taken for granted, but it is interesting to reflect that little more than a century ago, ore concentration was often a fairly crude operation, involving relatively simple density-based and hand-sorting techniques. The twentieth century saw the development of mineral processing as an important profession in its own right, and certainly without it the concentration of many ores, and particularly the metalliferous ores, would be hopelessly uneconomic (Wills and Atkinson, 1991).
It has been predicted that the importance of mineral processing of metallic ores may decline as the physical processes utilized are replaced by the hydro- and pyrometallurgical routes used by the extractive metallurgist (Gilchrist, 1989), because higher recoveries are obtained by some chemical methods. This may apply when the useful mineral is very finely disseminated in the ore and adequate liberation from the gangue is not possible, in which case a combination of chemical and mineral processing techniques may be advantageous, as is the case with some highly complex deposits of copper, lead, zinc, and precious metals (Gray, 1984; Barbery, 1986). Heap leaching of gold and oxidized copper ores are examples where mineral processing is largely by-passed, providing only size reduction to expose the minerals. In-situ leaching is used increasingly for the recovery of uranium and bitumen from their ores. An exciting possibility is using plants to concentrate metals sufficiently for chemical extraction. Known as phytomining or agro-mining, it has shown particular promise for nickel (Moskvitch, 2014). For most ores, however, concentration of metals for subsequent extraction is best accomplished by mineral processing methods that are inexpensive, and their use is readily justified on economic grounds.
The two fundamental operations in mineral processing are, therefore, liberation or release of the valuable minerals from the gangue, and concentration, the separation of these values from the gangue.
1.6 Liberation
Liberation of the valuable minerals from the gangue is accomplished by size reduction or comminution, which involves crushing and grinding to such a size that the product is a mixture of relatively clean particles of mineral and gangue, that is, the ore minerals are liberated or free. An objective of comminution is liberation at the coarsest possible particle size. If such an aim is achieved, then not only is energy saved but also by reducing the amount of fines produced any subsequent separation stages become easier and cheaper to operate. If high-grade solid products are required, then good liberation is essential; however, for subsequent hydrometallurgical processes, such as leaching, it may only be necessary to expose the required mineral.
Grinding is often the greatest energy consumer, accounting for up to 50% of a concentrator’s energy consumption (Radziszewski, 2013). As it is this process which achieves liberation of values from gangue, it is also the process that is essential for efficient separation of the minerals. In order to produce clean concentrates with little contamination with gangue minerals, it is often necessary to grind the ore to a fine size (<100 μm). Fine grinding increases energy costs and can lead to the production of very fine difficult to treat “slime” particles which may be lost into the tailings, or even discarded before the concentration process. Grinding therefore becomes a compromise between producing clean (high-grade) concentrates, operating costs, and losses of fine minerals. If the ore is low grade, and the minerals have very small grain size and are disseminated through the rock, then grinding energy costs and fines losses can be high.
In practice, complete liberation is seldom achieved, even if the ore is ground down to less than the grain size of the desired minerals. This is illustrated by Figure 1.1, which shows a lump of ore containing a grain of valuable mineral with a breakage pattern superimposed that divides the lump into cubic particles of identical volume (for simplicity) and of a size below that of the mineral grain. It can be judged that each particle produced containing mineral also contains a portion of gangue. Complete liberation has not been attained, but the bulk of the major mineral—the gangue—has, however, been liberated from the valuable mineral.

The particles of “locked” (or “composite”) mineral and gangue are known as middlings, and further liberation from this fraction can only be achieved by further comminution. The “degree of liberation” refers to the percentage of the mineral occurring as free particles in the broken ore in relation to the total mineral content in locked and free particles. Liberation can be high if there are weak boundaries between mineral and gangue particles, which is often the case with ores composed mainly of rock-forming minerals, particularly sedimentary minerals. This is sometimes referred to as “liberation by detachment.” Usually, however, the adhesion between mineral and gangue is strong and during comminution the various constituents are cleft across the grain boundaries; that is, breakage is random. Random breakage produces a significant amount of middlings. Approaches to increasing the degree of liberation involve directing the breaking stresses at the mineral grain boundaries, so that the rock can be broken without breaking the mineral grains (Wills and Atkinson, 1993). For example, microwaves can be used, which cause differential heating among the constituent minerals and thus create stress fractures at grain boundaries (Kingman et al., 2004).
Many researchers have tried to quantify (model) the degree of liberation (Barbery, 1991; King, 2012). These models, however, suffer from many unrealistic assumptions that must be made with respect to the grain structure of the minerals in the ore. For this reason liberation models have not found much practical application. However, some fresh approaches by Gay (2004a,b) have demonstrated that there may yet be a useful role for such models.
Figure 1.2 shows predictions using the simple liberation model based on random breakage derived by Gaudin (1939), but which is sufficient to introduce an important practical point. The degree (fraction) of liberation is given as a function of the particle size to grain size ratio and illustrates that to achieve high liberation, say 75%, the particle size has to be much smaller than the grain size, in this case ca. 1/10th the size. So, for example, if the grain size is 1 mm then size reduction must produce a particle size at least 0.1 mm (100 µm) or less, and if the grain size is 0.1 mm the particle size should be 10 µm or less. This result helps understand the fine size required from the comminution process. For example, in processing base metal sulfides a target grind size of 100 µm for adequate liberation was common in the 1960s but the finer grained ores of today may require a target grind size of 10 µm, which in turn has driven the development of new grinding technologies.

The quantification of liberation is now routine using the dedicated scanning electron microscope systems, for example, and concentrators are increasingly using such systems to monitor the liberation in their processes.
It should be noted that a high degree of liberation is not always necessary and may be undesirable in some cases. For instance, it is possible to achieve a high recovery of values by gravity and magnetic separation even though the valuable minerals are completely enclosed by gangue, and hence the degree of liberation of the values is zero. As long as a pronounced density or magnetic susceptibility difference is apparent between the locked particles and the free gangue particles, the separation is possible. On the other hand, flotation requires at least a surface of the valuable mineral to be exposed.
Figure 1.3 is a cross section through a typical ore particle and illustrates the liberation dilemma often facing the mineral processor. Regions A represent valuable mineral, and region AA is rich in valuable mineral but is highly intergrown with the gangue mineral. Comminution produces a range of fragments, ranging from fully liberated mineral and gangue particles, to those illustrated. Particles of type 1 are rich in mineral (are high-grade particles) and are classed as concentrate as they have an acceptably low-level degree of locking with the gangue to still make a saleable concentrate grade. Particles of type 4 would be classed as tailings, the small amount of mineral present representing an acceptable loss of mineral. Particles of types 2 and 3 would probably be classed as middlings, although the degree of regrinding needed to promote liberation of mineral from particle 3 would be greater than in particle 2. In practice, ores are ground to an optimum grind size, determined by laboratory and pilot scale testwork, to produce an economic degree of liberation. The concentration process is then designed to produce a concentrate consisting predominantly of valuable mineral, with an accepted degree of locking with the gangue minerals, and a middlings fraction, which may require further grinding to promote optimum release of the minerals. The tailings should be mainly composed of gangue minerals.

During the grinding of a low-grade ore, the bulk of the gangue minerals is often liberated at a relatively coarse size (see Figure 1.1). In certain circumstances it may be economic to grind to a size much coarser than the optimum in order to produce, in the subsequent concentration process, a large middlings fraction and tailings which can be discarded at a coarse grain size (Figure 1.4). The middlings fraction can then be reground to produce a feed to the final concentration process. This method discards most of the coarse gangue early in the process, thus considerably reducing grinding costs.

An intimate knowledge of the mineralogical assembly of the ore (”texture”) is essential if efficient processing is to be carried out. Process mineralogy or applied mineralogy thus becomes an important tool for the mineral processor.
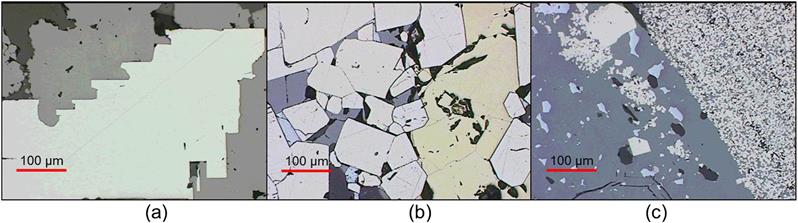
Texture refers to the size, dissemination, association, and shape of the minerals within the ore. Processing of the minerals should always be considered in the context of the mineralogy of the ore in order to predict grinding and concentration requirements, feasible concentrate grades, and potential difficulties of separation (Guerney et al., 2003; Baum et al., 2004; Hoal et al., 2009; Evans et al., 2011; Lotter, 2011; Smythe et al., 2013). Microscopic analysis of ores, concentrates, and tailings yields much valuable information regarding the efficiency of the liberation and concentration processes. Figure 1.5 shows examples of increasing ore complexity, from simple (“free milling” ore, Figure 1.5(a)) to fine-grained inter-grown texture (Figure 1.5(c)). Microscopic analysis is particularly useful in troubleshooting problems that arise from inadequate liberation. Conventional optical microscopes can be used for the examination of thin and polished sections of mineral samples, and in mineral sands applications the simple binocular microscope is a practical tool. However, it is now increasingly common to employ quantitative automated mineral analysis using scanning electron microscopy, such as the Mineral Liberation Analyser (MLA) (Gu, 2003), the QEMSCAN (Gottlieb et al., 2000), and the Tescan Integrated Mineral Analyser (TIMA) (Motl et al., 2012), which scan polished sections to give 2D information, and X-ray microcomputed tomography (micro CT) that allows for 3D visualization of particulates (Lin et al., 2013).
1.7 Concentration
After the valuable mineral particles have been liberated, they must be separated from the gangue particles. This is done by exploiting the physical properties of the different minerals. The most important physical properties which are used to concentrate ores are:
1. Optical. This is often called sorting, which used to be done by hand but is now mostly accomplished by machine (Chapter 14).
2. Density. Gravity concentration, a technology with its roots in antiquity, is based on the differential movement of mineral particles in water due to their different density and hydraulic properties. The method has seen development of a range of gravity concentrating devices, and the potential to treat dry to reduce reliance on often scarce water resources (Chapter 10). In dense medium separation, particles sink or float in a dense liquid or (more usually) an artificial dense suspension. It is widely used in coal beneficiation, iron ore and diamond processing, and in the preconcentration of some metalliferous ores (Chapter 11).
3. Surface properties. Froth flotation (or simply “flotation”), which is the most versatile method of concentration, is effected by the attachment of the mineral particles to air bubbles within an agitated pulp. By adjusting the “chemistry” of the pulp by adding various chemical reagents, it is possible to make the valuable minerals water-repellant (hydrophobic) and the gangue minerals water-avid (hydrophilic). This results in separation by transfer of the valuable minerals to the bubbles which rise to form froth on the surface of the pulp (Chapter 12).
4. Magnetic susceptibility. Low-intensity magnetic separators can be used to concentrate strongly magnetic minerals such as magnetite (Fe3O4) and pyrrhotite (Fe7S8), while high-intensity magnetic separators are used to recover weakly magnetic minerals. Magnetic separation is an important process in the beneficiation of iron ores and finds application in the processing of nonmetallic minerals, such as those found in mineral sand deposits (Chapter 13).
5. Electrical conductivity. Electrostatic separation can be used to separate conducting minerals from nonconducting minerals. Theoretically this method represents the “universal” concentrating method; virtually all minerals show some difference in conductivity and it should be possible to separate almost any two by this process. However, the method has fairly limited application, and its greatest use is in separating some of the minerals found in heavy sands from beach or stream placers. Minerals must be completely dry and the humidity of the surrounding air must be regulated, since most of the electron movement in dielectrics takes place on the surface and a film of moisture can change the behavior completely. The low capacity of economically sized units is stimulating developments to overcome (Chapter 13).
A general way to show separation is to represent as a recovery to one stream, usually the concentrate, as a function of some mineral property, variously called an efficiency, performance, or partition curve, as illustrated in Figure 1.6(a). The property can be density, magnetic susceptibility, some measure of hydrophobicity, or particle size (in size separation devices). The plot can be made dimensionless by dividing the property X by X50, the property corresponding to 50% recovery (Figure 1.6(b)). This is a normalized or reduced efficiency curve. Treating X50 as the target property for separation then the ideal or perfect separation is the dashed line in Figure 1.6(b) passing through X/X50=1.

The size of particle is an important consideration in mineral separation. Figure 1.7 shows the general size range of efficient separation of the concentration processes introduced above. It is evident that all these physical-based techniques fail as the particle size reduces. Extending the particle size range drives innovation.

In many cases, a combination of two or more separation techniques is necessary to concentrate an ore economically. Gravity separation, for instance, may be used to reject a major portion of the gangue, as it is a relatively cheap process. It may not, however, have the selectivity to produce the final clean concentrate. Gravity concentrates therefore often need further upgrading by more expensive techniques, such as flotation. Magnetic separation can be integrated with flotation—for example, to reject pyrrhotite in processing some Ni-sulfide ores.
Ores which are very difficult to treat (refractory), due to fine dissemination of the minerals, complex mineralogy, or both, have driven technological advances. An example is the zinc–lead–silver deposit at McArthur River, in Australia. Discovered in 1955, it is one of the world’s largest zinc–lead deposits, but for 35 years it resisted attempts to find an economic processing route due to the very fine grained texture of the ore. However, the development of the proprietary IsaMill fine grinding technology (Pease, 2005) by the mine’s owners Mount Isa Mines, together with an appropriate flotation circuit, allowed the ore to be processed and the mine was finally opened in 1995. The concentrator makes a bulk (i.e., combined) zinc–lead concentrate with a very fine product size of 80% (by weight) finer than 7 µm.
Chemical methods can be used to alter mineralogy, allowing the low-cost mineral processing methods to be applied to refractory ores (Iwasaki and Prasad, 1989). For instance, nonmagnetic iron oxides can be roasted in a weakly reducing atmosphere to produce magnetite. In Vale’s matte separation process mineral processing (comminution and flotation) is used to separate Ni–Cu matte into separate Cu- and Ni-concentrates which are sent for metal extraction (Damjanovic and Goode, 2000).
Some refractory copper ores containing sulfide and oxidized minerals have been pretreated hydrometallurgically to enhance flotation performance. In the Leach-Precipitation-Flotation process, developed in the years 1929–1934 by the Miami Copper Co., USA, the oxidized minerals are dissolved in sulfuric acid, after which the copper in solution is precipitated as cement copper by the addition of metallic iron. The cement copper and acid-insoluble sulfide minerals are then recovered by flotation. This process, with several variations, has been used at a number of American copper concentrators. A more widely used method of enhancing the flotation performance of oxidized ores is to allow the surface to react with sodium sulfide. This “sulfidization” process modifies the flotation response of the mineral causing it to behave, in effect, as a pseudo-sulfide (Chapter 12).
Developments in biotechnology are being exploited in hydrometallurgical operations, particularly in the bacterial oxidation of sulfide gold ores and concentrates (Brierley and Brierley, 2001; Hansford and Vargas, 2001). There is evidence to suggest that certain microorganisms could be used to enhance the performance of conventional mineral processing techniques (Smith et al., 1991). It has been established that some bacteria will act as pyrite depressants in coal flotation, and work has shown that certain organisms can aid flotation in other ways (e.g., Botero et al., 2008). Microorganisms have the potential to profoundly change future industrial flotation practice.
Extremely fine mineral dissemination leads to high energy costs in comminution and losses to tailings due to the generation of difficult-to-treat fine particles. Much research has been directed at minimizing fine mineral losses, either by developing methods of enhancing mineral liberation, thus minimizing the amount of comminution needed, or by increasing the efficiency of conventional physical separation processes, by the use of innovative machines or by optimizing the performance of existing ones. Several methods have been proposed to increase the apparent size of fine particles, by causing them to come together and aggregate. Selective flocculation of certain minerals in suspension, followed by separation of the aggregates from the dispersion, has been achieved on a variety of ore-types at laboratory scale, but plant application is limited (Chapter 12).
1.8 Representing Mineral Processing Systems: The Flowsheet
The flowsheet shows diagrammatically the sequence of operations in the plant. In its simplest form it can be presented as a block diagram in which all operations of similar character are grouped (Figure 1.8). In this case, “comminution” deals with all crushing and grinding. The next block, “separation,” groups the various treatments incident to production of concentrate and tailing. The third, “product handling,” covers the shipment of concentrates and disposal of tailings.

Expanding, a simple line flowsheet (Figure 1.9) can be sufficient and can include details of machines, settings, rates, etc. Most flowsheets today use symbols to represent the unit operations. Example flowsheets are given in many of the chapters, with varying degrees of sophistication.

1.9 Measures of Separation
The object of mineral processing, regardless of the methods used, is always the same: to separate the minerals with the values in the concentrates, and the gangue in the tailings. The two most common measures of the separation are grade and recovery.
1.9.1 Grade
The grade, or assay, refers to the content of the marketable commodity in any stream, such as the feed and concentrate. In metallic ores, the percent metal is often quoted, although in the case of very low-grade ores, such as gold, metal content may be expressed as parts per million (ppm), or its equivalent grams per ton (g t−1). Some metals are sold in oxide form, and hence the grade may be quoted in terms of the marketable oxide content: for example, %WO3, %U3O8, etc. In nonmetallic operations, grade usually refers to the mineral content: for example, %CaF2 in fluorite ores. Diamond ores are usually graded in carats per 100 t, where 1 carat is 0.2 g. Coal is graded according to its ash content, that is, the amount of incombustible mineral present within the coal. Most coal burned in power stations (“steaming coal”) has an ash content between 15% and 20%, whereas “coking coal” used in steel making generally has an ash content of less than 10%.
The metal content of the mineral determines the maximum grade of concentrate that can be produced. Thus processing an ore containing Cu in only chalcopyrite (CuFeS2) the maximum attainable grade is 34.6%, while processing an ore containing galena (PbS), the maximum Pb grade is 86.6%. (The method of calculation was explained in Example 1.1.)
1.9.2 Recovery
The recovery, in the case of a metallic ore, is the percentage of the total metal contained in the ore that is recovered to the concentrate. For instance, a recovery of 90% means that 90% of the metal in the ore (feed) is recovered in the concentrate and 10% is lost in (“rejected” to) the tailings. The recovery, when dealing with nonmetallic ores, refers to the percentage of the total mineral contained in the ore that is recovered into the concentrate. In terms of the usual symbols recovery R is given by:
(1.1)
where C is weight of concentrate (or more precisely flowrate, e.g., t h−1), F the weight of feed, c the grade (assay) of metal or mineral in the concentrate, and f the grade of metal/mineral in the feed. Provided the metal occurs in only one mineral, metal recovery is the same as the recovery of the associated mineral. (Example 1.2 shows how to deal with situations where an element resides in more than one mineral.) Metal assays are usually given as % but it is often easier to manipulate formulas if the assays are given as fractions (e.g., 10% becomes 0.1).
Related measures to grade and recovery include: the ratio of concentration, the ratio of the weight of the feed (or heads) to the weight of the concentrate (i.e., F/C); weight recovery (or mass or solids recovery) also known as yield is the inverse of the ratio of concentration, that is, the ratio of the weight of concentrate to weight of feed (C/F); enrichment ratio, the ratio of the grade of the concentrate to the grade of the feed (c/f). They are all used as measures of metallurgical efficiency.
1.9.3 Grade–Recovery Relationship
The grade of concentrate and recovery are the most common measures of metallurgical efficiency, and in order to evaluate a given operation it is necessary to know both. For example, it is possible to obtain a very high grade of concentrate (and ratio of concentration) by simply picking a few lumps of pure galena from a lead ore, but the recovery would be very low. On the other hand, a concentrating process might show a recovery of 99% of the metal, but it might also put 60% of the gangue minerals in the concentrate. It is, of course, possible to obtain 100% recovery by not concentrating the ore at all.
Grade of concentrate and recovery are generally inversely related: as recovery increases grade decreases and vice versa. If an attempt is made to attain a very high-grade concentrate, the tailings assays are higher and the recovery is low. If high recovery of metal is aimed for, there will be more gangue in the concentrate and the grade of concentrate and ratio of concentration will decrease. It is impossible to give representative values of recoveries and ratios of concentration. A concentration ratio of 2 to 1 might be satisfactory for certain high-grade nonmetallic ores, but a ratio of 50 to 1 might be considered too low for a low-grade copper ore, and ratios of concentration of several million to one are common with diamond ores. The aim of milling operations is to maintain the values of ratio of concentration and recovery as high as possible, all factors being considered.
Ultimately the separation is limited by the composition of the particles being separated and this underpins the inverse relationship. To illustrate the impact of particle composition, consider the six particle array in Figure 1.10 is separated in an ideal separator, that is, a separator that recovers particles sequentially based on valuable mineral content. The six particles represent three mineral (A) equivalents and three gangue (B) equivalents (all of equal weight), thus the perfect separator would recover the particles in order 1 through 6. The grade of A and the recovery of A after each particle is separated into the concentrate is given in Table 1.3 and plotted in Figure 1.11 (which also shows the conversion from mineral grade to metal grade assuming the valuable mineral in this case is chalcopyrite, CuFeS2). The inverse relationship is a consequence of the distribution of particle composition. The figure includes reference to other useful features of the grade–recovery relationship: the grade of all mineral A-containing particles, the pure mineral grade approached as recovery goes to zero, and the feed grade, which corresponds to recovery of all particles.

Table 1.3
Recovery of Particles in Figure 1.10 by Perfect Separator
| Particle Recovered | 1 | 2 | 3 | 4 | 5 | 6 |
| Concentrate grade (%) | 100 (1/1)a | 100 (2/2) | 89 (2.66/3) | 75 (3/4) | 60 (3/5) | 50 (3/6) |
| Recovery (%) | 33 (1/3) | 66 (2/3) | 89 (2.66/3) | 100 (3/3) | 100 (3/3) | 100 (3/3) |

aFigure in parenthesis is the ratio of the mass of particles.

The grade–recovery corresponding to perfect separation is known as the mineralogically-limited or liberation-limited grade–recovery. For simple two component mixtures with well differentiated density, it is possible to approach perfect separation in the laboratory using a sequence of “heavy” liquids (e.g., some organics or concentrated salt solutions) of increasing density (Chapter 11). The liberation-limited curve can be generated from mineralogical data, essentially following the calculations used to generate Figure 1.11. The liberation-limited grade–recovery curve is used to compare against the actual operation and determine how far away it is from the theoretical maximum separation.
The grade–recovery curve is the most common representation of metallurgical performance. When assessing the effect of a process change, the resulting grade–recovery curves should be compared, not individual points, and differences between curves should be subjected to tests of statistical significance. To construct the curve, the data need to be collected in increments, such as increments of density or increments of flotation time, and then assembled into cumulative recovery and cumulative grade. There are other methods of presenting the data, such as recovery versus total solids recovery, and recovery of mineral A versus recovery of mineral B. Together these are sometimes referred to as “separability curves” and examples will be found in various chapters.
1.9.4 A Measure of Technical Separation Efficiency
There have been many attempts to combine recovery and concentrate grade into a single index defining the metallurgical efficiency of the separation. These have been reviewed by Schulz (1970), who proposed the following definition:
(1.2)
where Rm is the recovery of the valuable mineral and Rg is the recovery of the gangue into the concentrate.
Calculation of SE will be illustrated using Eq. (1.1). This equation applies equally well to the recovery of gangue, provided we know the gangue assays. To find the gangue assays, we must first convert the metal assay to mineral assay (see Example 1.1). For a concentrate metal grade of c if the metal content in the mineral is m then the mineral content is c/m and thus the gangue assay of the concentrate is given by (assays in fractions):
(1.3)
This calculation, of course, applies to any stream, not just the concentrate, and thus in the feed if f is the metal assay the mineral assay is f/m. The recovery of gangue (Rg) is therefore
(1.4)
and thus the separation efficiency is:
(1.5)
 (1.5)
(1.5)
Example 1.3 illustrates the calculations. The concept can be extended to consider separation between any pair of minerals, A and B, such as in the separation of lead from zinc.
Example 1.3
A tin concentrator treats a feed containing 1% tin, and three possible combinations of concentrate grade and recovery are:
| High grade | 63% tin at 62% recovery |
| Medium grade | 42% tin at 72% recovery |
| Low grade | 21% tin at 78% recovery |
Determine which of these combinations of grade and recovery produce the highest separation efficiency.
Solution
Assuming that the tin is totally contained in the mineral cassiterite (SnO2) then m=78.6% (0.786), and we can complete the calculation:


The answer to which gives the highest separation efficiency, therefore, is the low-grade case.
The concept of separation efficiency is examined in Appendix III, based on Jowett (1975) and Jowett and Sutherland (1985), where it is shown that defining separation efficiency as separation achieved relative to perfect separation yields Eq. (1.5).
Although separation efficiency can be useful in comparing the performance of different operating conditions, it takes no account of economic factors, and is sometimes referred to as the “technical separation efficiency.” As will become apparent, a high value of separation efficiency does not necessarily lead to the most economic return. Nevertheless it remains a widely used measure to differentiate alternatives prior to economic assessment.
1.10 Economic Considerations
Economic considerations play a large role in mineral processing. The enormous growth of industrialization from the eighteenth century onward led to dramatic increases in the annual output of most mineral commodities, particularly metals. Copper output grew by a factor of 27 in the twentieth century alone, and aluminum by an astonishing factor of 3,800 in the same period. Figure 1.12 shows the world production of aluminum, copper, and zinc for the period 1900–2012 (USGS, 2014).

All of these metals suffered to a greater or lesser extent when the Organization of Petroleum Exporting Countries (OPEC) quadrupled the price of oil in 1973–1974, ending the great postwar industrial boom. The situation worsened in 1979–1981, when the Iranian revolution and then the Iran–Iraq war forced the price of oil up from $13 to nearly $40 a barrel, plunging the world into another and deeper recession. While in the mid-1980s a glut in the world’s oil supply as North Sea oil production grew cut the price to below $15 in 1986, Iraq’s invasion of Kuwait in 1990 pushed the price up again, to a peak of $42 in October, although by then 20% of the world’s energy was being provided by natural gas.
In 1999, overproduction and the Asian economic crisis depressed oil prices to as low as $10 a barrel from where it climbed steadily to a record $147 a barrel in 2008, driven by demand from the now surging Asian economies, particularly China. Turmoil in oil producing regions continued in the twenty-first century from the invasion of Iraq (2003) to the “Arab Spring” (start date 2009) and the festering stand-off with Russia over the Ukraine (2014). Over the past three years, the oil price fluctuated around $100 a barrel, apparently inured against this turmoil. In the last half of 2014, however, the price dropped precipitously to less than $50 a barrel as the world moved to a surplus of oil driven by decreased growth rate in countries like China, and a remarkable, and unexpected, increase in shale oil production in the United States. The decision by OPEC not to reduce production has accelerated the price decline. This will drive out the high-cost producers, including production from shale oil that needs about $60 a barrel to be profitable, and the price will climb.
These fluctuations in oil prices impact mining, due to their influence both on the world economy and thus the demand for metals, and directly on the energy costs of mining and processing. Metal and mineral commodities are thus likewise subject to cycles in price. Figure 1.13 shows the commodity price index and identifies the recent “super-cycle” starting about 2003, and the decline following that of oil during 2014. These “boom and bust” cycles are characterized by overoptimistic forecasts as prices rise (reference to the “super-cycle”) and dire warnings about exporting countries suffering from the “natural resource disease” on the price downslide.

The cycles spur innovation. To reduce dependence on OPEC, oil production turned to “nonconventional” sources, such as the oil sands in Canada. A radical nonconventional resource, methane chlorates, appeared set to make Siberia the next Saudi Arabia and although interest has waned recently these deposits remain part of our energy future.
The most dramatic new nonconventional source, however, comes from the shale oil deposits in the United States. The vast volumes of natural gas in shale formations in the United States were well known by the 1990s and attempts to crack open the shale in vertical wells by injecting sand, water, and chemicals, known as hydraulic fracturing or “fracking,” were underway but had proved unprofitable. The breakthrough innovation was to drill horizontally rather than vertically and thus expose thousands of meters of gas-bearing shale rather than just a few tens of meters (Hefner, 2014). The same technology also released reservoirs of oil in shale and other “tight,” that is, impermeable, rock formations. As a consequence, the United States could become the world’s largest oil producer by the end of the decade, a revolution with impacts both economic and geopolitical. While other large such shale formations are known throughout the world, environmental concerns over groundwater contamination has, for the moment, cooled the spread of the technology.
The cycles stimulate substitution. In the case of oil, electricity generation turned to natural gas (including liquefied natural gas, LNG) and reconsidered nuclear, while sustaining a large role for coal which remains in plentiful supply and is more generously distributed among the advanced economies. Solar-, wind-, and tidal-generated sources are starting to contribute to the electric power grid. Subsidies, carbon taxing, and cap-and-trade (emissions trading) initiatives spur these “green” alternatives. For transport, we are witnessing a resurgence of interest in electric-powered vehicles. Another energy innovation is “cogeneration,” the capture and distribution of waste heat to heat buildings. Mining operations are using this concept, for example, by tapping the natural heating underground and examining the potential to recover the heat generated in comminution (Radziszewski, 2013). The demand to limit greenhouse gas emissions to combat climate change will drive substitution of carbon-based energy sources.
Certain metals and minerals likewise face competition from substitutes and some face additional factors. Avoiding “conflict minerals” influences the choice of supply source. Some companies make an advert of not using commodities seen as environmentally harmful. Lifecycle analysis may influence which commodities are used and in what combinations in order to facilitate recycling.
While commodity prices have gone up in current dollars since 2000 (Figure 1.13), the capital cost of mining projects has increased by 200–300% (Thomas et al., 2014) over the same period. This is due to increased equipment and construction costs (competition for materials and labor), increased environmental regulations, and the added complexity of constructing mine sites in remote areas. While the recent high metal prices attracted interest in previously uneconomic deposits, the project cost escalation has put pressure on the mines to optimize performance and has caused investors to be wary.
1.10.1 Contained Value
Every ton of material in the deposit has a certain contained value that is dependent on the metal content and current price of the contained metal. For instance, at a copper price of £2,000 t−1 and a molybdenum price of £18 kg−1, a deposit containing 1% copper and 0.015% molybdenum has a contained value of more than £22 t−1. To be processed economically, the cost of processing an ore must be less than the contained value.
1.10.2 Processing Costs
Mining is a major cost, and this can vary from only a few pence per ton of ore to well over £50 t−1. High-tonnage operations are cheaper in terms of operating costs but have higher initial capital costs. These capital costs are paid off over a number of years, so that high-tonnage operations can only be justified for the treatment of deposits large enough to allow this. Small ore bodies are worked on a smaller scale to reduce overall capital costs, but capital and operating costs per ton are correspondingly higher (Ottley, 1991).
Alluvial mining is the cheapest method and, if on a large scale, can be used to mine ores of low contained value due to low grade or low metal price, or both. For instance, in S.E. Asia, tin ores containing as little as 0.01% Sn are mined by alluvial methods. These ores have a contained value of less than £1 t−1, but very low processing costs allow them to be economically worked.
High-tonnage open-pit and underground block-caving methods are used to treat ores of low contained value, such as low-grade copper ores. Where the ore must be mined selectively, however, as is the case with underground vein-type deposits, mining methods become very expensive, and can only be justified on ores of high contained value. An underground selective mining cost of £30 t−1 would obviously be hopelessly uneconomic on a tin ore of alluvial grade, but may be economic on a hard-rock ore containing 1.5% tin, with a contained value of around £50 t−1 ore.
In order to produce metals, the ore minerals must be broken down by the action of heat (pyrometallurgy), solvents (hydrometallurgy), or electricity (electrometallurgy), either alone or in combination. The most common method is the pyrometallurgical process of smelting. These chemical methods consume large quantities of energy. The smelting of 1 t of copper ore, for instance, consumes in the region of 1,500–2,000 kWh of electrical energy, which at a cost of say 5 p kWh−1 is around £85 t−1, well above the contained value of most copper ores. In addition, smelters are often remote from the mine site, and thus the cost of transport to the site must be considered.
The essential economic purpose of mineral processing is to reduce the bulk of the ore which must be transported to and processed by the smelter, by using relatively cheap, low-energy physical methods to separate the valuable minerals from the gangue minerals. This enrichment process considerably increases the contained value of the ore to allow economic transportation and smelting. Mineral processing is usually carried out at the mine site, the plant being referred to as a mill or concentrator.
Compared with chemical methods, the physical methods used in mineral processing consume relatively small amounts of energy. For instance, to upgrade a copper ore from 1% to 25% metal would use in the region of 20–50 kWh t−1. The corresponding reduction in weight of around 25:1 proportionally lowers transport costs and reduces smelter energy consumption to around 60–80 kWh in relation to a ton of mined ore. It is important to realize that, although the physical methods are relatively low energy consumers, the reduction in bulk lowers smelter energy consumption to the order of that used in mineral processing. It is significant that as ore grades decline, the energy used in mineral processing becomes an important factor in deciding whether the deposit is viable to exploit or not.
Mineral processing reduces not only smelter energy costs but also smelter metal losses, due to the production of less metal-bearing slag. (Some smelters include a slag mineral processing stage to recover values and recycle to the smelter.) Although technically feasible, the smelting of low-grade ores, apart from being economically unjustifiable, would be very difficult due to the need to produce high-grade metal products free from deleterious element impurities. These impurities are found in the gangue minerals and it is the purpose of mineral processing to reject them into the discard (tailings), as smelters often impose penalties according to their level. For instance, it is necessary to remove arsenopyrite from tin concentrates, as it is difficult to remove the contained arsenic in smelting and the process produces a low-quality tin metal.
Against the economic advantages of mineral processing, the losses occurred during milling and the cost of milling operations must be charged. The latter can vary over a wide range, depending on the method of treatment used, and especially on the scale of the operation. As with mining, large-scale operations have higher capital but lower operating costs (particularly labor and energy) than small-scale operations.
Losses to tailings are one of the most important factors in deciding whether a deposit is viable or not. Losses will depend on the ore mineralogy and dissemination of the minerals, and on the technology available to achieve efficient concentration. Thus, the development of flotation allowed the exploitation of the vast low-grade porphyry copper deposits which were previously uneconomic to treat (Lynch et al., 2007). Similarly, the introduction of solvent extraction enabled Nchanga Consolidated Copper Mines in Zambia to treat 9 Mt per year of flotation tailings, to produce 80,000 t of finished copper from what was previously regarded as waste (Anon., 1979).
In many cases not only is it necessary to separate valuable from gangue minerals, but also to separate valuable minerals from each other. For instance, complex sulfide ores containing economic amounts of copper, lead, and zinc usually require separate concentrates of the minerals of each of these metals. The provision of clean concentrates, with little contamination with associated metals, is not always economically feasible, and this leads to another source of loss other than direct tailing loss. A metal which reports to the “wrong” concentrate may be difficult, or economically impossible, to recover and never achieves its potential valuation. Lead, for example, is essentially irrecoverable in copper concentrates and is often penalized as an impurity by the copper smelter. The treatment of such polymetallic base metal ores, therefore, presents one of the great challenges to the mineral processor.
Mineral processing operations are often a compromise between improvements in metallurgical efficiency and milling costs. This is particularly true with ores of low contained value, where low milling costs are essential and cheap unit processes are necessary, particularly in the early stages, where the volume of material treated is high. With such low-value ores, improvements in metallurgical efficiency by the use of more expensive methods or reagents cannot always be justified. Conversely, high metallurgical efficiency is usually of most importance with ores of high contained value and expensive high-efficiency processes can often be justified on these ores.
Apart from processing costs and losses, other costs which must be taken into account are indirect costs such as ancillary services—power supply, water, roads, tailings disposal—which will depend much on the size and location of the deposit, as well as taxes, royalty payments, investment requirements, research and development, medical and safety costs, etc.
1.10.3 Milling Costs
As discussed, the balance between milling costs and metal losses is crucial, particularly with low-grade ores, and because of this most mills keep detailed accounts of operating and maintenance costs, broken down into various subdivisions, such as labor, supplies, energy, etc. for the various areas of the plant. This type of analysis is used to identify high-cost areas where improvements in performance would be most beneficial. It is impossible to give typical operating costs for milling operations, as these vary considerably from mine to mine, and particularly from country to country, depending on local costs of energy, labor, water, supplies, etc.
Table 1.4 is an approximate breakdown of costs for a 100,000 t d−1 copper concentrator. Note the dominance of grinding, due mainly to power requirements.
Table 1.4
Relative Costs for a 100,000 t d−1 Copper Concentrator
| Item | Cost (%) |
| Crushing | 2.8 |
| Grinding | 47.0 |
| Flotation | 16.2 |
| Thickening | 3.5 |
| Filtration | 2.8 |
| Tailings | 5.1 |
| Reagents | 0.5 |
| Pipeline | 1.4 |
| Water | 8.0 |
| Laboratory | 1.5 |
| Maintenance support | 0.8 |
| Management support | 1.6 |
| Administration | 0.6 |
| Other expenses | 8.1 |
| Total | 100 |
1.10.4 Tailings Reprocessing and Recycling
Mill tailings which still contain valuable components constitute a potential future resource. New or improved technologies can allow the value contained in tailings, which was lost in earlier processing, to be recovered, or commodities considered waste in the past to become valuable in a new economic order. Reducing or eliminating tailings dumps by retreating them also reduces the environmental impact of the waste.
The cost of tailings retreatment is sometimes lower than that of processing the original ore, because much of the expense has already been met, particularly in mining and comminution. There are many tailings retreatment plants in a variety of applications around the world. The East Rand Gold and Uranium Company closed its operations in 2005 after 28 years having retreated over 870 Mt of the iconic gold dumps of Johannesburg, significantly modifying the skyline of the Golden City and producing 250 t of gold in the process. Also in 2005, underground mining in Kimberley closed, leaving a tailings dump retreatment operation as the only source of diamond production in the Diamond City. Some platinum producers in South Africa now operate tailings retreatment plants for the recovery of platinum group metals (PGMs), and also chromite as a by-product from the chrome-rich UG2 Reef. The tailings of the historic Timmins gold mining area of Canada are likewise being reprocessed.
Although these products, particularly gold, tend to dominate the list of tailings retreatment operations because of the value of the product, there are others, both operating and being considered as potential major sources of particular commodities. For example: coal has been recovered from tailings in Australia (Clark, 1997), uranium is recovered from copper tailings by the Uranium Corporation of India, and copper has been recovered from the Bwana Mkubwa tailings in Zambia, using solvent extraction and electrowinning. The Kolwezi Tailings project in the DRC (Democratic Republic of Congo) that recovered oxide copper and cobalt from the tailings of 50 years of copper mining ran from 2004 to 2009. Phytomining, the use of plants to accumulate metals, could be a low-cost way to detoxify tailings (and other sites) and recover metals. Methods of resource recovery from metallurgical wastes are described by Rao (2006).
Recovery from tailings is a form of recycling. The reprocessing of industrial scrap and domestic waste for metal recycling is a growing economic, and environmental, activity. “Urban ore” is a reference to forgotten supplies of metals that lie in and under city streets. Recovery of metals from electronic scrap is one example; another is recovery of PGMs that accumulate in road dust as car catalytic converters wear (Ravilious, 2013). Many mineral separation techniques are applicable to processing urban ores but tapping them is held back by their being so widely spread in the urban environment. The principles of recycling are comprehensively reviewed by Reuter et al. (2005).
1.10.5 Net Smelter Return and Economic Efficiency
Since the purpose of mineral processing is to increase the economic value of the ore, the importance of the grade–recovery relationship is in determining the most economic combination of grade and recovery that will produce the greatest financial return per ton of ore treated in the plant. This will depend primarily on the current price of the valuable product, transportation costs to the smelter, refinery, or other further treatment plant, and the cost of such further treatment, the latter being very dependent on the grade of concentrate supplied. A high-grade concentrate will incur lower smelting costs, but the associated lower recovery means lower returns of final product. A low-grade concentrate may achieve greater recovery of the values, but incur greater smelting and transportation costs due to the included gangue minerals. Also of importance are impurities in the concentrate which may be penalized by the smelter, although precious metals may produce a bonus.
The net return from the smelter (NSR) can be calculated for any grade–recovery combination from:
(1.6)
This is summarized in Figure 1.14, which shows that the highest value of NSR is produced at an optimum concentrate grade. It is essential that the mill achieves a concentrate grade that is as close as possible to this target grade. Although the effect of moving slightly away from the optimum may only be of the order of a few pence per ton treated, this can amount to very large financial losses, particularly on high-capacity plants treating thousands of tons per day. Changes in metal price, smelter terms, etc. obviously affect the NSR versus concentrate grade relationship and the value of the optimum concentrate grade. For instance, if the metal price increases, then the optimum grade will be lower, allowing higher recoveries to be attained (Figure 1.15).


It is evident that the terms agreed between the concentrator and the smelter are of paramount importance in the economics of mining and milling operations. Such smelter contracts are usually fairly complex. Concentrates are sold under contract to “custom smelters” at prices based on quotations on metal markets such as the London Metal Exchange (LME). The smelter, having processed the concentrates, disposes of the finished metal to the consumers. The proportion of the “free market” price of the metal received by the mine is determined by the terms of the contract negotiated between mine and smelter, and these terms can vary widely. Table 1.5 summarizes a typical low-grade smelter contract for the purchase of tin concentrates. As is usual in many contracts, one assay unit (1%) is deducted from the concentrate assay in assessing the value of the concentrates, and arsenic present in the concentrate (in this case) is penalized. The concentrate assay is of prime importance in determining the valuation, and the value of the assay is usually agreed on the result of independent sampling and assaying performed by the mine and smelter. The assays are compared, and if the difference is no more than an agreed value, the mean of the two results may be taken as the agreed assay. In the case of a greater difference, an “umpire” sample is assayed at an independent laboratory. This umpire assay may be used as the agreed assay, or the mean of this assay and that of the party which is nearer to the umpire assay may be chosen.
Table 1.5
Simplified Tin Smelter Contract
| Material | Tin concentrates, assaying no less than 15% Sn, to be free from deleterious impurities not stated and to contain sufficient moisture as to evolve no dust when unloaded at our works. |
| Quantity | Total production of concentrates. |
| Valuation | Tin, less 1 unit per dry ton of concentrates, at the lowest of the official LME prices. |
| Pricing | On the seventh market day after completion of arrival of each sampling lot into our works. |
| Treatment charge | £385 per dry ton of concentrates. |
| Moisture | £24 t−1 of moisture. |
| Penalties | Arsenic £40 per unit per ton. |
| Lot charge | £175 per lot sampled of less than 17 t. |
| Delivery | Free to our works in regular quantities, loose on a tipping lorry (truck) or in any other manner acceptable to both parties. |
The use of smelter contracts, and the importance of the by-products and changing metal prices, can be seen by briefly examining the economics of processing two base metals—tin and copper—whose fortunes have fluctuated over the years for markedly different reasons.
1.10.6 Case Study: Economics of Tin Processing
Tin constitutes an interesting case study in the vagaries of commodity prices and how they impact the mineral industry and its technologies. Almost half the world’s supply of tin in the mid-nineteenth century was mined in south-west England, but by the end of the 1870s Britain’s premium position was lost, with the emergence of Malaysia as the leading producer and the discovery of rich deposits in Australia. By the end of the century, only nine mines of any consequence remained in Britain, where 300 had flourished 30 years earlier. From alluvial or secondary deposits, principally from South-East Asia, comes 80% of mined tin. Unlike copper, zinc, and lead, production of tin has not risen dramatically over the years and has rarely exceeded 250,000 t per annum.
The real price of tin spent most of the first half of the twentieth century in a relatively narrow band between US$10,000 and US$15,000 t−1 (1998$), with some excursions (Figure 1.16). From 1956 its price was regulated by a series of international agreements between producers and consumers under the auspices of the International Tin Council (ITC), which mirrored the highly successful policy of De Beers in controlling the gem diamond trade. Price stability was sought through selling from the ITC’s huge stockpiles when the price rose and buying into the stockpile when the price fell.

From the mid-1970s, however, the price of tin was driven artificially higher at a time of world recession, a toxic combination of expanding production and falling consumption, the latter due mainly to the increasing use of aluminum in making cans, rather than tin-plated steel. Although the ITC imposed restrictions on the amount of tin that could be produced by its member countries, the reason for the inflating tin price was that the price of tin was fixed by the Malaysian dollar, while the buffer stock manager’s dealings on the LME were financed in sterling. The Malaysian dollar was tied to the American dollar, which strengthened markedly between 1982 and 1984, having the effect of increasing the price of tin in London simply because of the exchange rate. However, the American dollar began to weaken in early 1985, taking the Malaysian dollar with it, and effectively reducing the LME tin price from its historic peak. In October 1985, the buffer stock manager announced that the ITC could no longer finance the purchase of tin to prop up the price, as it had run out of funds, owing millions of pounds to the LME traders. This announcement caused near panic, the tin price fell to £8,140 t−1 and the LME halted all further dealings. In 1986, many of the world’s tin mines were forced to close due to the depressed tin price, and prices continued to fall in subsequent years, rising again in concert with other metals during the “super-cycle.” While the following discussion relates to tin processing prior to the collapse, including prices and costs, the same principles can be applied to producing any metal-bearing mineral commodity at any particular period including the present day.
It is fairly easy to produce concentrates containing over 70% tin (i.e., over 90% cassiterite) from alluvial ores, such as those worked in South-East Asia. Such concentrates present little problem in smelting and hence treatment charges are relatively low. Production of high-grade concentrates also incurs relatively low freight charges, which is important if the smelter is remote. For these reasons it has been traditional in the past for hard-rock, lode tin concentrators to produce high-grade concentrates, but high tin prices and the development of profitable low-grade smelting processes changed the policy of many mines toward the production of lower-grade concentrates. The advantage of this is that the recovery of tin into the concentrate is increased, thus increasing smelter payments. However, the treatment of low-grade concentrates produces much greater problems for the smelter, and hence the treatment charges at “low-grade smelters” are normally much higher than those at the high-grade smelters. Freight charges are also correspondingly higher. Example 1.4 illustrates the identification of the economic optimum grade–recovery combination.
Example 1.4
Suppose that a tin concentrator treats a feed containing 1% tin, and that three possible combinations of concentrate grade and recovery are those in Example 1.3:
| High grade | 63% tin at 62% recovery |
| Medium grade | 42% tin at 72% recovery |
| Low grade | 21% tin at 78% recovery |
Using the low-grade smelter terms set out in the contract in Table 1.5, and assuming that the concentrates are free of arsenic, and that the cost of transportation to the smelter is £20 t−1 of dry concentrate, what is the combination giving the economic optimum, that is, maximum NSR?
Solution
As a common basis we use 1 t of ore (feed). For each condition it is possible to calculate the amount of concentrate that can be made from 1 t of ore and from this, the smelter payment and charges for each combination of grade and recovery can be calculated.
The calculation of the amount of concentrate follows from the definition of recovery (Eq. (1.1)):
For a tin price of £8,500 t−1 (of tin), and a treatment charge of £385 t−1 (of concentrate) the NSR for the three cases is calculated in the table below:

This result in Example 1.4 is in contrast to the maximum separation efficiency which was for the low-grade case (Example 1.3). Lowering the concentrate grade to 21% tin, in order to increase recovery, increased the separation efficiency, but adversely affected the economic return from the smelter, the increased charges being greater than the increase in revenue from the metal.
In terms of contained value, the ore, at free market price, has £85 worth of tin per ton ((1%/100)×£8,500 t−1 (of tin)); thus even at the economic optimum combination, the mine realizes only 62% of the ore value in payments received (£52.80/£85).
The situation may alter, however, if the metal price changes appreciably. If the tin price falls and the terms of the smelter contract remain the same, then the mine profits will suffer due to the reduction in payments. Rarely does a smelter share the risks of changing metal price, as it performs a service role, changes in smelter terms being made more on the basis of changing smelter costs rather than metal price. The mine does, however, reap the benefits of increasing metal price.
At a tin price of £6,500 t−1, the NSR per ton of ore from the low-grade smelter treating the 42% tin concentrate is £38.75, while the return from the high-grade smelter, treating a 63% Sn concentrate, is £38.96. Although this is a difference of only £0.21 t−1 of ore, to a small 500 t d−1 tin concentrator this change in policy from relatively low- to high-grade concentrate, together with the subsequent change in concentrate market, would expect to increase the revenue by £0.21×500×365=£38,325 per annum. The concentrator management must always be prepared to change its policies, both metallurgical and marketing, if maximum returns are to be made, although generation of a reliable grade–recovery relationship is often difficult due to the complexity of operation of lode tin concentrators and variations in feed characteristics.
It is, of course, necessary to deduct the costs of mining and processing from the NSR in order to deduce the profit achieved by the mine. Some of these costs will be indirect, such as salaries, administration, research and development, medical and safety, as well as direct costs, such as operating and maintenance, supplies and energy. The breakdown of milling costs varies significantly from mine to mine, depending on the size and complexity of the operations (Table 1.4 is one example breakdown). Mines with large ore reserves tend to have high throughputs, and so although the capital outlay is higher, the operating and labor costs tend to be much lower than those on smaller plants, such as those treating lode tin ores. Mining costs also vary considerably and are much higher for underground than for open-pit operations.
If mining and milling costs of £40 and £8, respectively, per ton of ore are typical of underground tin operations, then it can be seen that at a tin price of £8,500, the mine producing a concentrate of 42% tin, which is sold to a low-grade smelter, makes a profit of £52.80−48=£4.80 t−1 of ore. It is also clear that if the tin price falls to £6,500 t−1, the mine loses £48−38.96=£9.04 for every ton of ore treated.
The mine profit per ton of ore treated can be illustrated by considering “contained values.” For the 72% recovery case (medium-grade case in Example 1.4) the contained value in the concentrate is £85×0.72=£61.20, and thus the contained value lost in the tailings is $23.80 (£85−£61.20). Since the smelter payment is £52.80 the effective cost of transport and smelting is £61.20−52.80=£8.40. Thus the mine profit can be summarized as follows:
which for the 72% recovery case is:
The breakdown of revenue and costs in this manner is summarized in Figure 1.17.

In terms of effective cost of production, since 1 t of ore produces 0.0072 t of tin in concentrates, and the free market value of this contained metal is £61.20 and the profit is £4.80, the total effective cost of producing 1 t of tin in concentrates is £(61.20−4.80)/0.0072=£7,833.
The importance of metal losses in tailings is shown clearly in Figure 1.17. With ore of relatively high contained value, the recovery is often more important than the cost of promoting that recovery. Hence relatively high-cost unit processes can be justified if significant improvements in recovery are possible, and efforts to improve recoveries should always be made. For instance, suppose the concentrator, maintaining a concentrate grade of 42% tin, improves the recovery by 1%, i.e., to 73%, with no change in actual operating costs. The NSR will be £53.53 t−1 of ore and after deducting mining and milling costs, the profit realized by the mine will be £5.53 t−1 of ore. Since 1 t of ore now produces 0.0073 t of tin, having a contained value of £62.05, the cost of producing 1 t of tin in concentrates is thereby reduced to £(62.05−5.53)/0.0073=£7,742.
Due to the high processing costs and losses, hard-rock tin mines, such as those in Cornwall and Bolivia, had the highest production costs, being above £7,500 t−1 of ore in 1985 (for example). Alluvial operations, such as those in Malaysia, Thailand, and Indonesia, have lower production costs (around £6,000 t−1 in 1985). Although these ores have much lower contained values (only about £1–2 t−1), mining and processing costs, particularly on the large dredging operations, are low, as are smelting costs and losses, due to the high concentrate grades and recoveries produced. In 1985, the alluvial mines in Brazil produced the world’s cheapest tin, having production costs of only about £2,200 t−1 of ore (Anon., 1985a).
1.10.7 Case Study: Economics of Copper Processing
In 1835, the United Kingdom was the world’s largest copper producer, mining around 15,000 t per annum, just below half the world production. This leading position was held until the mid-1860s when the copper mines of Devon and Cornwall became exhausted and the great flood of American copper began to make itself felt. The United States produced about 10,000 t in 1867, but by 1900 was producing over 250,000 t per annum. This output had increased to 1,000,000 t per annum in the mid-1950s, by which time Chile and Zambia had also become major producers. World annual production now exceeds 15,000,000 t (Figure 1.12).
Figure 1.18 shows that the price of copper in real terms grew steadily from about 1930 until the period of the oil shocks of the mid-1970s and then declined steeply until the early twenty-first century, the average real price in 2002 being lower than that at any time in the twentieth century. The pressure on costs was correspondingly high, and the lower cost operators such as those in Chile had more capacity to survive than the high-cost producers such as some of those in the United States. However, world demand, particularly from emerging economies such as China, drove the price strongly after 2002 and by 2010 it had recovered to about US$9000 t−1 (in dollars of the day) before now sliding back along with oil and other commodities.

The move to large-scale operations (Chile’s Minerara Escondida’s two concentrators had a total capacity of 230,000 t d−1 in 2003), along with improvements in technology and operating efficiencies, have kept the major companies in the copper-producing business. In some cases by-products are important revenue earners. BHP Billiton’s Olympic Dam produces gold and silver as well as its main products of copper and uranium, and Rio Tinto’s Kennecott Utah Copper is also a significant molybdenum producer.
A typical smelter contract for copper concentrates is summarized in Table 1.6. As in the case of the tin example, the principles illustrated can be applied to current prices and costs.
Table 1.6
Simplified Copper Smelter Contract
| Payments | |
| Copper: | Deduct from the agreed copper assay 1 unit, and pay for the remainder at the LME price for higher-grade copper. |
| Silver: | If over 30 g t−1 pay for the agreed silver content at 90% of the LME silver price. |
| Gold: | If over 1 g t−1 pay for the agreed gold content at 95% of the LME gold price. |
| Deductions | |
| Treatment charge: £30 per dry ton of concentrates | |
| Refining charge: £115 t−1 of payable copper | |

Consider a porphyry copper mine treating an ore containing 0.6% Cu to produce a concentrate containing 25% Cu, at 85% recovery. This represents a concentrate production of 20.4 kg t−1 of ore treated. Therefore, at a copper price of £980 t−1:
Assuming a transport cost of £20 t−1 of concentrate, the total deductions are £(0.61+0.56+0.41)=£1.58, and the NSR per ton of ore treated is thus £(4.80−1.58)=£3.22.
As mining, milling and other costs must be deducted from this figure, it is apparent that only those mines with very low operating costs can have any hope of profiting from such low-grade operations at the quoted copper price. Assuming a typical large open-pit mining cost of £1.25 t−1 of ore, a milling cost of £2 t−1 and indirect costs of £2 t−1, the mine will lose £2.03 for every ton of ore treated. The breakdown of costs and revenues, following the example for tin (Figure 1.17), is given in Figure 1.19.

As each ton of ore produces 0.0051 t of copper in concentrates, with a free market value of £5.00, the total effective production costs are £(5.00+2.03)/0.0051 t=£1,378 t−1 of copper in concentrates. However, if the ore contains appreciable by-products, the effective production costs are reduced. Assuming the concentrate contains 25 g t−1 of gold and 70 g t−1 of silver, then the payment for gold, at a LME price of £230/troy oz (1 troy oz=31.1035 g) is:
and the payment for silver at a LME price of £4.5 per troy oz
The net smelter return is thus increased to £6.99 t−1 of ore, and the mine makes a profit of £1.7 t−1 of ore treated. The effective cost of producing 1 t of copper is thus reduced to £(5.00−1.74)/0.0051=£639.22.
By-products are thus extremely important in the economics of copper production, particularly for very low-grade operations. In this example, 42% of the mine’s revenue is from gold. This compares with the contributions to revenue realized at Bougainville Copper Ltd (Sassos, 1983).
Table 1.7 lists estimated effective costs per ton of copper processed in 1985 at some of the world’s major copper mines, at a copper price of £980 t−1 (Anon., 1985b).
Table 1.7
Effective Costs at World’s Leading Copper Mines in 1985
| Mine | Country | Effective Cost of Processed Cu (£ t−1) |
| Chuquicamata | Chile | 589 |
| El Teniente | Chile | 622 |
| Bougainville | Papua New Guinea | 664 |
| Palabora | South Africa | 725 |
| Andina | Chile | 755 |
| Cuajone | Peru | 876 |
| El Salvador | Chile | 906 |
| Toquepala | Peru | 1,012 |
| Inspiration | USA | 1,148 |
| San Manuel | USA | 1,163 |
| Morenci | USA | 1,193 |
| Twin Buttes | USA | 1,208 |
| Utah/Bingham | USA | 1,329 |
| Nchanga | Zambia | 1,374 |
| Gecamines | Zaire | 1,374 |
It is evident that, apart from Bougainville (now closed), which had a high gold content, and Palabora, a large open-pit operation with numerous heavy mineral by-products, the only economic copper mines in 1985 were the large South American porphyries. Those mines profited due to relatively low actual operating costs, by-product molybdenum production, and higher average grades (1.2% Cu) than the North American porphyries, which averaged only 0.6% Cu. Relatively high-grade deposits such as at Nchanga failed to profit due partly to high operating costs, but mainly due to the lack of by-products. It is evident that if a large copper mine is to be brought into production in such an economic climate, then initial capitalization on high-grade secondary ore and by-products must be made, as at Ok Tedi in Papua New Guinea, which commenced production in 1984, initially mining and processing the high-grade gold ore in the leached capping ore.
Since the profit margin involved in the processing of modern copper ores is usually small, continual efforts must be made to try to reduce milling costs and metal losses. This need has driven the increase in processing rates, many over 100,000 t ore per day, and the corresponding increase in size of unit operations, especially grinding and flotation equipment. Even relatively small increases in return per ton can have a significant effect, due to the very large tonnages that are often treated. There is, therefore, a constant search for improved flowsheets and flotation reagents.
Figure 1.19 shows that in the example quoted, the contained value in the flotation tailings is £0.88 t−1 treated ore. The concentrate contains copper to the value of £5.00, but the smelter payment is £3.22. Therefore, the mine realizes only 64.4% of the free market value of copper in the concentrate. On this basis, the actual metal loss into the tailings is only about £0.57 t−1 of ore. This is relatively small compared with milling costs, and an increase in recovery of 0.5% would raise the net smelter return by only £0.01. Nevertheless, this can be significant; to a mine treating 50,000 t d−1, this is an increase in revenue of £500 d−1, which is extra profit, providing that it is not offset by any increased milling costs. For example, improved recovery in flotation may be possible by the use of a more effective reagent or by increasing the dosage of an existing reagent, but if the increased reagent cost is greater than the increase in smelter return, then the action is not justified.
This balance between milling cost and metallurgical efficiency is critical on a concentrator treating an ore of low contained value, where it is crucial that milling costs be as low as possible. Reagent costs are typically around 10% of the milling costs on a large copper mine, but energy costs may contribute well over 25% of these costs. Grinding is by far the greatest energy consumer and this process undoubtedly has the greatest influence on metallurgical efficiency. Grinding is essential for the liberation of the minerals in the ore, but it should not be carried out any finer than is justified economically. Not only is fine grinding energy intensive, but it also leads to increased media (grinding steel) consumption costs. Grinding steel often contributes as much as, if not more than, the total mill energy cost, and the quality of grinding medium used often warrants special study. Figure 1.20 shows the effect of fineness of grind on NSR and grinding costs for a typical low-grade copper ore. Although flotation recovery, and hence NSR, increases with fineness of grind, it is evident that there is no economic benefit in grinding finer than a certain grind size (80% passing size). Even this fineness may be beyond the economic limit because of the additional capital cost of the grinding equipment required to achieve it.

1.10.8 Economic Efficiency
It is apparent that a certain combination of grade and recovery produces the highest economic return under certain conditions of metal price, smelter terms, etc. Economic efficiency compares the actual NSR per ton of ore milled with the theoretical return, thus taking into account all the financial implications. The theoretical return is the maximum possible return that could be achieved, assuming “perfect milling,” that is, complete separation of the valuable mineral into the concentrate, with all the gangue reporting to tailings. Using economic efficiency, plant efficiencies can be compared even during periods of fluctuating market conditions (Example 1.5).
Example 1.5
Calculate the economic efficiency of a tin concentrator, treating an ore grading 1% tin producing a concentrate grading 42% tin at 72% recovery, under the conditions of the smelter contract shown in Table 1.5. The cost of transportation to the smelter is £20 t−1 of concentrate. Assume a tin price of £8,500 t−1.
Solution
It was shown in Example 1.4 that this concentrate would realize a net smelter return of £52.80. Assuming perfect milling, 100% recovery of the tin would be achieved into a concentrate grading 78.6% tin (i.e., pure cassiterite), thus the calculations proceed as follows:
Therefore, the “perfect milling” net smelter return=£(83.90−4.90−0.25)=£78.75, and thus:
In recent years, attempts have been made to optimize the performance of some concentrators by controlling plant conditions to achieve maximum economic efficiency (see Chapters 3 and 12). A dilemma often facing the metallurgist on a complex flotation circuit producing more than one concentrate is: how much contamination of one concentrate by the mineral that should report to the other concentrate can be tolerated? For instance, on a plant producing separate copper and zinc concentrates, copper is always present in the zinc concentrate, as is zinc in the copper concentrate. Metals misplaced into the wrong concentrate are rarely paid for by the specialist smelter and are sometimes penalized. There is, therefore, an optimum “degree of contamination” that can be tolerated. The most important reagent controlling this factor is often the depressant (Chapter 12), which, in this example, inhibits flotation of the zinc minerals. Increase in the addition of this reagent not only produces a cleaner copper concentrate but also tends to reduce copper recovery into this concentrate, as it also has some depressing effect on the copper minerals. The depressed copper minerals are likely to report to the zinc concentrate, so the addition rate of depressant needs to be carefully monitored and controlled to produce an optimum compromise. This should occur when the economic efficiency is maximized (Example 1.6).
Example 1.6
The following assay data were collected from a copper–zinc concentrator:
| Feed | Cu concentrate | Zn concentrate | ||
| Assay | Cu (%) | 0.7 | 24.6 | 0.4 |
| Zn (%) | 1.94 | 3.40 | 49.7 | |

Mass balance calculation (Chapter 3) showed that 2.6% of the feed reported to the copper concentrate and 3.5% to the zinc concentrate.
Calculate the overall economic efficiency under the following simplified smelter terms:
Solution
a. Copper
Assuming that all the copper is contained in the mineral chalcopyrite, then maximum copper grade is 34.6% Cu (pure chalcopyrite, CuFeS2).
If C is weight of copper concentrate per 1,000 kg of feed, then for 100% recovery of copper into this concentrate:
Transport cost=£20×20.2/1,000=£0.40
Treatment cost=£30×20.2/1,000=£0.61
Revenue=£20.2×0.346×1,000×0.9/1,000=£6.29
Therefore, NSR for copper concentrate=£5.28 t−1 of ore.
b. Zinc
Assuming that all the zinc is contained in the mineral sphalerite, maximum zinc grade is 67.1% (assuming sphalerite is ZnS).
If Z is weight of zinc concentrate per 1,000 kg of feed, then for 100% recovery of zinc into this concentrate:
Transport cost=£20×28.9/1,000=£0.58
Treatment cost=£100×28.9/1,000=£2.89
Revenue=£28.9×0.671×0.85×400/1,000=£6.59
Therefore, NSR for zinc concentrate=£3.12 t−1 of ore.
Total NSR for perfect milling=£(5.28+3.12)=£8.40 t−1
2. Actual milling
Similar calculations give:
Net copper smelter return=£4.46 t−1 ore
Net zinc smelter return=£1.71 t−1 ore
1.11 Sustainability
While making a profit is essential to sustaining any operation, sustainability has taken on more aspects in recent years, something that increasingly impacts the mining industry.
The concept of Sustainable Development arose from the environmental movement of the 1970s and was created as a compromise between environmentalists who argued that further growth and development was untenable due to depletion of resources and destructive pollution, and proponents of growth who argued that growth is required to prevent developed countries from stagnating and to allow underdeveloped countries to improve. Thus, the principles of sustainable development, that is, growth within the capacity that the earth could absorb and remain substantially unchanged, were embraced by industry. The 1987 Brundtland report, commissioned by the UN, defined sustainable development as “development that meets the needs of the present without compromising the ability of future generations to meet their own needs” (Brundtland, 1987; Anon., 2000).
Sustainable development concepts have had major impact on mining operations and projects; for example, the many safety and worker health regulations continuously promulgated since the 1960s, as well as environmental regulations controlling and limiting emissions to air, land, and sea. In fact, meeting these regulations has been a main driver of technology and operational improvement projects (van Berkel and Narayanaswamy, 2004; Marcuson, 2007).
Achieving sustainable development requires balancing economic, environmental, and social factors (Figure 1.21). Sustainability attempts to account for the entire value of ecosystems and divides this value into three segments: direct, the value that can be generated by the animals, plants, and other resources; indirect, the value generated by items such as erosion control, water purification, and pollination; and intangible, the value to humans derived from beauty and religious/spiritual significance. Before the genesis of sustainability, economic evaluations concentrated on direct benefits undervaluing or ignoring indirect benefits. However, these indirect benefits may have significant economic value that is difficult to quantify and is only realized after the fact.

The mining enterprise is directly connected to and dependent upon the earth. Mining has been a crucible for sustainability activities, especially when dealing with greenfield sites inhabited by indigenous people. Algie (2002) and Twigge-Molecey (2004) highlighted six fundamental features of mining that account for this:
• Metal and mineral resources are nonrenewable.
• Economic mineralization often occurs in remote underdeveloped areas that are high conservation zones rich in biodiversity with many sites of cultural importance to the indigenous inhabitants. The mining company becomes responsible for developing essential infrastructure. Mining activities irreversibly alter both the natural and social environments.
• The mining sector is diverse in size, scope, and responsibility. It comprises government and private organizations, super-major corporations and junior miners, and exploration companies.
• The mining industry has a poor legacy.
• The risks and hazards in production, use, and disposal are not well understood by the public and are often poorly communicated.
• In contrast to manufacturing, which primarily involves physical change, processing of metals involves chemical change, which inherently is more polluting.
In a mining endeavor, a large proportion of the benefits accrue globally while major environmental effects are felt locally. Indigenous people are closely tied to the local environment but remote from the global market exacerbating negative effects. Moreover, modern mining is not labor intensive and projects in remote locations generate jobs for only a small proportion of the aboriginal population. This may lead to an unhealthy division of wealth and status within the aboriginal community (Martin, 2005).
Sustainable development principles have dramatically impacted new projects. Extensive monitoring of baseline environmental conditions and pre-engineering studies to investigate likely impact on both the natural and human environments are mandated (Figure 1.22). While these activities certainly identify and reduce errors made during project implementation, they exponentially increase the amount of time required for completing projects. These delays may stretch project duration across several price cycles. During this time, low prices erode confidence in the worth of the project; project “champions” leave organizations, either voluntarily or involuntarily; projects are stopped and reevaluated. All of these result in more delays and additional cost.

Sustainable development has irreversibly altered the relationship between First Nations and industry (Marcuson et al., 2009). Fifty years ago, aboriginal peoples were typically ignored when creating a new project. Today, after years of advocacy, protests, and demonstrations, they have gained a place at the bargaining table, have input into the environmental permitting process, and frequently possess veto power over a new project. As a result, Impact Benefit Agreements (IBAs), designed to compensate the local population for damage to their environment and to create training, educational, and employment opportunities, are negotiated. These have succeeded in allocating a greater portion of the global benefits to the local population and in transferring social costs to the bottom line of the project. But this process has its challenges—multiparty negotiations between a company, government(s), and aboriginals take time and add costs. Moreover, governments in developing countries and aboriginal communities have different levels of sophistication in business and corporate matters, and they may have unrealistic expectations, and may be subject to exploitation by internal and external individuals and groups. Additionally, the terms of IBAs are frequently held in close confidence and thereby immune to external examination and regulation.
A modern mining project of reasonable size requires a minimum capital outlay of $1b and has an operating life of 25+ years. Costs of $4–6b are common, and time horizons of 10+ years from project initiation to successful start-up are not unusual. Achieving sustainable financing to cover these costs and extended times has necessitated globalization and consolidation of the industry.
However, even mega-corporations have not successfully modulated the historic cyclic nature of the mining business. This cyclic nature presents existential challenges to those charged with sustaining mining corporations. Net Present Value, greatly influenced by price assumptions and heavily weighted to income during the first 10 years, is a major financial metric for investment decisions. Thus, while a key financial indicator is short term focused, both project duration and asset life are long, and a fundamental mismatch exists, further complicating decision making. Sequential delays between commodity price increases, decisions to increase supply, and project completion create a sluggish, fundamentally unstable system. Finally, due to high capital costs and relatively low incremental operating costs there is hesitancy to close operations when prices fall. When coupled with political and social pressure to maintain employment, operations may be maintained even when taking losses adding more fuel to the boom and bust cycle.
Faced with this situation and compelled by investors demanding immediate returns, mining companies cut costs in areas that will immediately improve the bottom line. This means deferring capital projects, negotiating delays in environmental improvement projects, reducing support for universities, and curtailing exploration and technology initiatives. While these endeavors support the long-term economic sustainability of the enterprise, curtailment and concomitant loss of expertise further exacerbate the cyclical nature of the industry.
Through regulatory and economic forces, sustainable development has become a revolutionary driver of the mining industry. These forces are increasing (Starke, 2002). Developing countries are demanding a greater portion of the economic benefits. Social and environmental sustainability become inextricably linked in the realm of water utilization and waste disposal. These present visible, immediate threats to local water supplies, the health of the natural environment, the local economies, and ways of life. Water and community health will remain flash points. To date, effective mechanisms to limit greenhouse gas emissions have not been developed. As a result, expenditures to minimize these play a minor role in new projects. But climate change is the major environmental challenge of the twenty-first century; economic and regulatory restrictions will certainly emerge as major factors in the Sustainable Development portfolio.