
Chapter 13
Computer-Aided Process Planning
13.1 The Planning Function
This chapter examines several process planning functions which can be implemented by computer systems. Process planning is conerned with determining the sequence of individual manufacturing operations needed to produce a given part or product. The resulting operation sequence is documented on a form typically referred to as a route sheet. The route sheet is a listing of the production operations and associated machine tools for a workpart or assembly.
Closely related to process planning are the functions of determining appropriate cutting conditions for the machining operations and setting the time standards for the operations. All three functions—planning the process, determining the cutting conditions, and setting the time standards—have traditionally been carried out as tasks with a very high manual and clerical content. They are also typically routine tasks in which similar or even identical decisions are repeated over and over. Today, these kinds of decisions are being made with the aid of computers. In the first four sections of this chapter we consider the process planning function and how computers can be used to perform this function. In Sections 13.5 and 13.6 we study machinability data systems and computer-generated time standards, respectively.
Traditional process planning
There are variations in the level of detail found in route sheets among different companies and industries. In the one extreme, process planning is accomplished by releasing the part print to the production shop with the instructions “make to drawing.” Most firms provide a more detailed list of steps describing each operation and identifying each work center. In any case, it is traditionally the task of the manufacturing engineers or industrial engineers in an organization to write these process plans for new part designs to be produced by the shop. The process planning procedure is very much dependent on the experience and judgment of the planner. It is the manufacturing engineer’s responsibility to determine an optimal routing for each new part design. However, individual engineers each have their own opinions about what constitutes the best routing. Accordingly, there are differences among the operation sequences developed by various planners. We can illustrate rather dramatically these differences by means of an example.
In one case cited in Ref. [21], a total of 42 different routings were developed for various sizes of a relatively simple part called an “expander sleeve.” There were a total of 64 different sizes and styles, each with its own part number. The 42 routings included 20 different machine tools in the shop. The reason for this absence of process standardization was that many different individuals had worked on the parts: 8 or 9 manufacturing engineers, 2 planners, and 25 NC part programmers. Upon analysis, it was determined that only two different routings through four machines were needed to process the 64 part numbers. It is clear that there are potentially great differences in the perceptions among process planners as to what constitutes the “optimal” method of production.
In addition to this problem of variability among planners, there are often difficulties in the conventional process planning procedure. New machine tools in the factory render old routings less than optimal. Machine breakdowns force shop personnel to use temporary routings, and these become the documented routings even after the machine is repaired. For these reasons and others, a significant proportion of the total number of process plans used in manufacturing are not optimal.
Automated process planning
Because of the problems encountered with manual process planning, attempts have been made in recent years to capture the logic, judgment, and experience required for this important function and incorporate them into computer programs. Based on the characteristics of a given part, the program automatically generates the manufacturing operation sequence. A computer-aided process planning (CAPP) system offers the potential for reducing the routine clerical work of manufacturing engineers. At the same time, it provides the opportunity to generate production routings which are rational, consistent, and perhaps even optimal. Two alternative approaches to computer-aided process planning have been developed. These are:
1. Retrieval-type CAPP systems (also called variant systems)
2. Generative CAPP systems
The two types are described in the following two sections.
13.2 Retrieval-Type Process Planning Systems
Retrieval-type CAPP systems use parts classification and coding and group technology as a foundation. In this approach, the parts produced in the plant are grouped into part families, distinguished according to their manufacturing characteristics. For each part family, a standard process plan is established. The standard process plan is stored in computer files and then retrieved for new workparts which belong to that family. Some form of parts classification and coding system is required to organize the computer files and to permit efficient retrieval of the appropriate process plan for a new workpart. For some new parts, editing of the existing process plan may be required. This is done when the manufacturing requirements of the new part are slightly different from the standard. The machine routing may be the same for the new part, but the specific operations required at each machine may be different. The complete process plan must document the operations as well as the sequence of machines through which the part must be routed. Because of the alterations that are made in the retrieved process plan, these CAPP systems are sometimes also called by the name “variant system.”
Figure 13.1 will help to explain the procedure used in a retrieval process planning system. The user would initiate the procedure by entering the part code number at a computer terminal. The CAPP program then searches the part family matrix file to determine if a match exists. If the file contains an identical code number, the standard machine routing and operation sequence are retrieved from the respective computer files for display to the user. The standard process plan is examined by the user to permit any necessary editing of the plan to make it compatible with the new part design. After editing, the process plan formatter prepares the paper document in the proper form.
If an exact match cannot be found between the code numbers in the computer file and the code number for the new part, the user may search the machine routing file and the operation sequence file for similar parts that could be used to develop the plan for the new part. Once the process plan for a new part code number has been entered, it becomes the standard process for future parts of the same classification.
Figure 13.1 Information flow in a retrieval-type computer-aided process planning system.
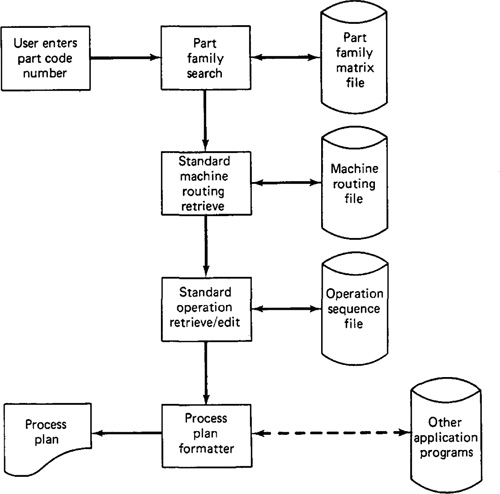
In Figure 13.1 the machine routing file is distinguished from the operation sequence file to emphasize that the machine routing may apply to a range of different part families and code numbers. It would be easier to find a match in the machine routing file than in the operation sequence file. Some CAPP retrieval systems would use only one such file which would be a combination of operation sequence file and machine routing file.
The process plan formatter may use other application programs. These could include programs to compute machining conditions, work standards, and standard costs. Standard cost programs can be used to determine total product costs for pricing purposes.
A number of retrieval-type computer-aided process planning systems have been developed. These include MIPLAN, one of the MICLASS modules [6,20], the CAPP system developed by Computer-Aided Manufacturing—International [1], COMCAPP V by MDSI, and systems by individual companies [10]. We will use MIPLAN as an example to illustrate these industrial systems.
Example 13.1
MIPLAN is a computer-aided process planning package available from the Organization for Industrial Research, Inc., of Waltham, Massachusetts. It is basically a retrieval-type CAPP system with some additional features. The MIPLAN system consists of several modules which are used in an interactive, conversational mode.
To operate the system, the user can select any of four different options to create the process plan for a new part:
1. The first option is a retrieval approach in which the user inputs a part code number and a standard process plan is retrieved from the computer file for possible editing. To generate the part code number, the planner may elect to use the MICLASS interactive parts classification and coding system (see Section 12.4).
2. In the second option, a process plan is retrieved from the computer files by entering an existing part number (rather than a part code number). Again, the existing process plan can be edited by the user, if required.
3. A process plan can be created from scratch, using standard text material stored in computer files. This option is basically a specialized word-processing system in which the planner selects from a menu of text related to machines and processes. The process plan is assembled from text passages subject to editing for the particular requirements of the new part.
4. The user can call up an incomplete process plan from the computer file. This may occur when the user is unable to complete the process plan for a new part at one sitting. For example, the planner may be interrupted in the middle of the procedure to solve some emergency problem. When the procedure is resumed, the incomplete plan can be retrieved and finished.
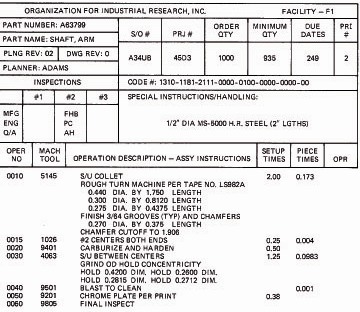
After the process plan has been completed using one of the four MIPLAN options, the user can have a paper document printed out by the computer. A typical MIPLAN output is shown in Figure 13.2. It is also possible for the user to store the completed process plan (or the partially completed plan as with option 3) in the computer files, or to purge an existing plan from the files. This might be done, for example, when an old machine tool is replaced by a more productive machine, and this necessitates changes in some of the standard process plans.
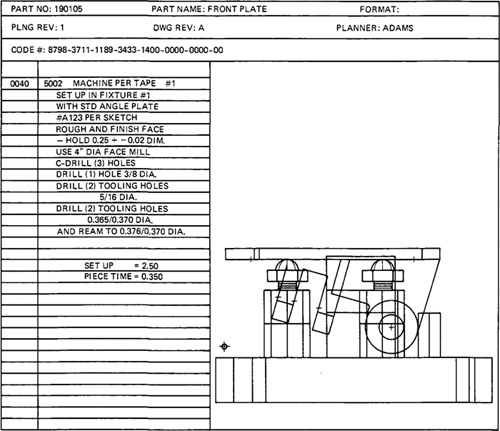
Computer graphics can be utilized to enhance the MIPLAN output. This possibility is illustrated in Figure 13.3, which shows a tooling setup for the machining operation described. With this kind of pictorial process planning, drawings of workpart details, tool paths, and other information can be presented visually to facilitate communication to the manufacturing shops.
13.3 Generative Process Planning Systems
Generative process planning involves the use of the computer to create an individual process plan from scratch, automatically and without human assistance. The computer would employ a set of algorithms to progress through the various technical and logical decisions toward a final plan for manufacturing. Inputs to the system would include a comprehensive description of the workpart. This may involve the use of some form of part code number to summarize the workpart data, but it does not involve the retrieval of existing standard plans. Instead, the generative CAPP system synthesizes the design of the optimum process sequence, based on an analysis of part geometry, material, and other factors which would influence manufacturing decisions.
Figure 13.2 Route sheet generated by MIPLAN. (Reprinted with permission from Ref. [15].)
In the ideal generative process planning package, any part design could be presented to the system for creation of the optimal plan. In practice, current generative-type systems are far from universal in their applicability. They tend to fall short of a truly generative capability, and they are developed for a somewhat limited range of manufacturing processes.
We will illustrate the generative process planning approach by means of a system called GENPLAN developed at Lockheed-Georgia Company [5,22].
Figure 13.3 Pictorial process planning. (Reprinted with permission from Ref. [15].)
EXAMPLE 13.2
GENPLAN is close to a generative process planning system, but it requires a human planner to assist with some of the manufacturing decisions. Also, there are several versions of GENPLAN (one for parts fabrication, and another for assembly), which means that it is not a system of universal applicability.
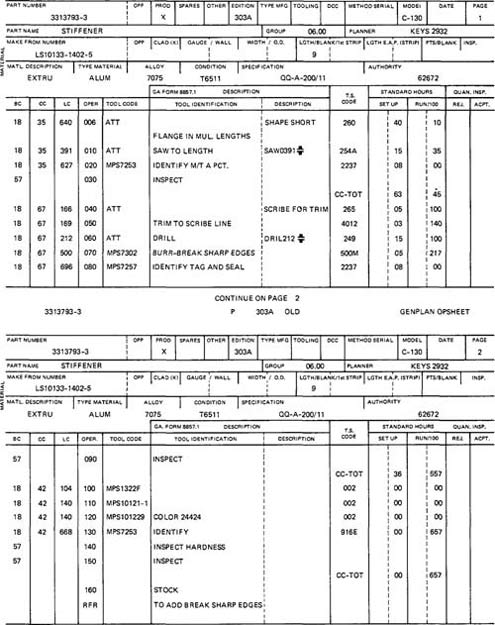
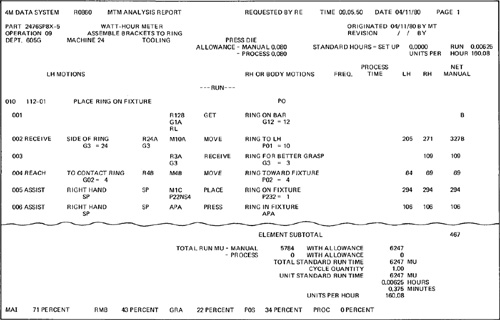
To operate the system, the planner enters a part classification code using a coding scheme developed at Lockheed. GENPLAN then analyzes the characteristics of the part based on the code number (e.g, part geometry, workpiece material, and other manufacturing-related features) to synthesize an optimum process plan. It does not store standard manufacturing plans. Rather, it stores machine tool capabilities and it employs the logic and technological science of manufacturing. The output is a document specifying the sequence of operations, machine tools, and calculated process times. An example of a computer-generated route sheet produced by GENPLAN is shown in Figure 13.4. Process plans that previously required several hours to accomplish manually are now done typically by GENPLAN in 15 minutes.
Figure 13.4 Route sheet generate by GENPLAN. (Reprinted with permission from Ref. [5].)
13.4 Benefits Of Capp
Whether it is a retrieval system or a generative system, computer-aided process planning offers a number of potential advantages over manually oriented process planning.
1. Process rationalization. Computer-automated preparation of operation routings is more likely to be consistent, logical, and optimal than its manual counterpart. The process plans will be consistent because the same computer software is being used by all planners. We avoid the tendency for drastically different process plans from different planners, as described in Section 13.1. The process plans tend to be more logical and optimal because the company has presumably incorporated the experience and judgment of its best manufacturing people into the process planning computer software.
2. Increased productivity of process planners. With computer-aided process planning, there is reduced clerical effort, fewer errors are made, and the planners have immediate access to the process planning data base. These benefits translate into higher productivity of the process planners. One system was reported to increase productivity by 600% in the process planning function [10].
3. Reduced turnaround time. Working with the CAPP system, the process planner is able to prepare a route sheet for a new part in less time compared to manual preparation. This leads to an overall reduction in manufacturing lead time.
4. Improved legibility. The computer-prepared document is neater and easier to read than manually written route sheets. CAPP systems employ standard text, which facilitates interpretation of the process plan in the factory.
5. Incorporation of other application programs. The process planning system can be designed to operate in conjunction with other software packages to automate many of the time-consuming manufacturing support functions. We discuss two of these related planning functions, machinability data systems and computerized work standards, in the following sections.
13.5 Machinability Data Systems
In a machine shop, process planning should include selection of the cutting conditions that are to be used in the various machining operations. The cutting conditions consist of the speed, feed, and depth of cut. Depth of cut is usually predetermined by the workpiece geometry and operation sequence. Therefore, the problem reduces to one of determining the proper speed and feed combination. Machinability data systems are basically intended to solve this problem.
Definition of the problem
Stated precisely, the objective of a machinability data system is to select cutting speed and feed rate given that the following characteristics of the operation have been defined:
1. Type of machining operation
2. Machine tool
3. Cutting tool
4. Workpart
5. Operating parameters other than feed and speed
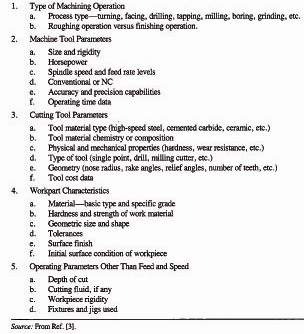
The magnitude of the problem can best be appreciated by contemplating the multitude of different parameters that are included within these five operation characteristics. A partial list of the parameters is presented in Table 13.1.
The methods of solving the speed/feed selection problem are:
1. Experience and judgment of process planner, foreman, or machine operator
Table 13.1 Characteristics of a Machining Operation
3. Computerized machinability data systems
Relying on the experience and judgment of any individual is the least systematic approach and carries the greatest risk. The risk lies in the potential loss of the individual who has acquired the experience and judgment over many years in the shop. Personal judgment is also undesirable because it usually has no scientific foundation. Cutting conditions derived from personal experience are not based on economic criteria.
Handbook recommendations are compiled from the experiences of more than one person. Handbooks of machinability data are generally developed from a systematic analysis of large quantities of machining data. The cutting recommendations are often based on laboratory experiments whose objective is to determine speeds and feeds. The best known of these handbooks is the Machining Data Handbook [9].
Although the handbook approach represents a definite improvement over personal judgment, it often suffers from several drawbacks when applied to a particular company’s machining environment. First, handbook recommendations tend to be conservative, meaning that the suggested feeds and speeds are based on worst-case conditions. Second, handbooks must be considered as general guides and may not coincide with the particular product line and machine tools of a given shop. Third, the use of handbooks is not compatible with the automation of the process planning function using a computerized data base.
Computerized machinability data system
To overcome these difficulties, efforts have been directed to the development of computerized machinability data systems. These efforts date back to the early 1960s and are continuing today. Some of the systems have been developed by individual firms to meet their own specific requirements. The importance of these systems has grown with the increase in the use of NC machines and the economic need to operate these machines as efficiently as possible. The importance of computerized machinability data systems will continue to grow with the development of integrated manufacturing data bases.
Computerized machinability data systems have been classified into two general types by Pressman and Williams [17]:
1. Data base systems
2. Mathematical model systems
DATA BASE SYSTEMS. These systems require the collection and storage of large quantities of data from laboratory experiments and shop experience. The data base is maintained on a computerized storage file that can be accessed either by a remote terminal or in a batch mode for a more permanent printout of cutting recommendations. An example of a typical printout is shown in Figure 13.5.
Figure 13.5 Typical output format of a computerized machinability data system. (Reprinted with permission from Ref. [2].)
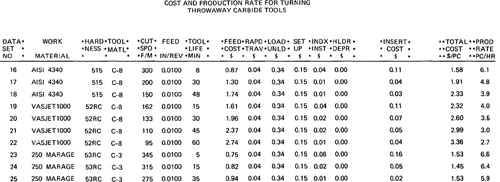
To collect the machinability data for a data base system, cutting experiments are performed over a range of feasible conditions. These experiments are commonly conducted in the laboratory. However, many data base machinability systems allow for shop data to be entered into the files also. For each set of conditions, computations are made to determine the cost of the operation. Not only is the total cost per piece calculated, but the cost components that make up the total are also calculated. Examples of these costs are illustrated in Figure 13.5.
The computations are based on the traditional concept in machining economics that the total cost per piece is composed of elements as given in the following equation:
![]()
where Cpc= cost per workpiece, $/piece
C0- = cost to operate the machine tool (labor, machine, and applicable overhead), $/min
Tm = machining time, min
Th = workpiece handling time, min
T = tool life, min
C, = cost of tooling, $/cutting edge
TK = tool change time, min
The organization of a typical data base system consists of files of data not unlike the arrangement of Table 13.1. To access these files, the user would have to enter certain descriptive data that would identify the type of machining operation, work material, tooling, and so on. The printout would consist of a listing of the machining recommendations corresponding to the input data.
MATHEMATICAL MODEL SYSTEMS. These systems go one step beyond the data base systems. Instead of simply retrieving cost information on operations that have already been performed, the mathematical model systems attempt to predict the optimum cutting conditions for an operation. The prediction is generally limited to optimum cutting speed, given a certain feed rate. The definition of optimal is based on either the objective of minimizing cost or maximizing production rate.
A common mathematical model to predict optimum cutting speed relies on the familiar Taylor equation for tool life,
VTn = C
where V = surface speed, ft/min or m/s
T = tool life, min
Candn = constants
By combining Eqs. (13.1) and (13.2), and accounting for the fact that machining time Tm is inversely proportional to cutting speed, V, the equation for minimum cost cutting speed can be derived.
![]()
In a similar way, the cutting speed that yields maximum production rate can also be derived:
![]()
Equations (13.3) and (13.4), or equations similar to these, are used in the predictive-type machinability data systems to determine recommendations that approximate optimal cutting conditions.
The potential weakness of the mathematical model systems lies in the validity of the Taylor tool-life equation. Equation (13.2) is an empirical equation derived from experimental data that contain random errors. These random variations tend to distort the accuracy of the minimum cost and maximum production equations. Also, there are dangers in extrapolating the Taylor equation beyond the range over which the experimental data were collected.
EXAMPLE 13.3
A computerized machinability data base system was developed for the Abex Corporation by Zimmers [16,24]. It is principally a data base system.
Five data files are used in the Abex system to store the required machinability data needed in the computations.
1. Machine tool data (DB100): machine identification,horsepower, and available speeds and feeds.
2. Base cutting conditions (DB200): base cutting conditions for certain types of materials for HSS and cemented carbide tools.
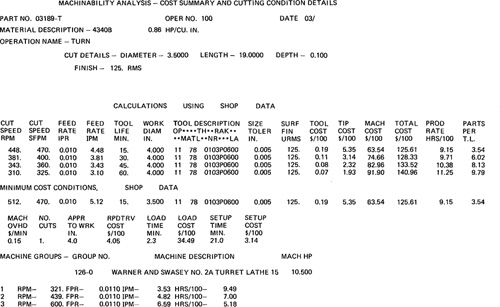
Figure 13.6 Output format of Abex computerized machinability data system. (Reprinted courtesy of the Society of Manufacturing Engineers.)
3. Experimental data (DB300): results of laboratory tests to supplement file DB200. Data contained in the experimental data bank include operation type, tooling, work material, cutting conditions, observed surface finish, and tool-life values.
4. Shop-generated data (DB400): results of successful experience in production. Data contained in DB400 are similar to those of DB300 except that they originated in the shop rather than the laboratory.
5. Plant cost data (DB500): cost parameters needed to compute cost per piece and optimum conditions.
Input to the program consists of data on the workpart, depth of cut, surface finish requirements, and other data related to the operation. (Development of the process sequence must precede the use of the machinability data program.) During operation of the program, the computer performs a series of data file searches and calculations to determine the recommended cutting conditions. A typical printout is shown in Figure 13.6. If shop data (DB400) are available, the recommendations are based on this file. Otherwise, experimental data (DB300) are used, and if no applicable data are available in DB300, recommended speeds and feeds are based on the DB200 file.
13.6 Computer-Generated Time Standards
Work measurement can be defined as the development of a time standard to indicate the value of a work task. According to a survey conducted by Industrial Engineering magazine and Patton Consultants, Inc., 95% of the manufacturing firms responding to the survey use work measurement [18]. There are various purposes for which work measurement is used. Among these are:
Wage incentives
Estimating and job costing
Production scheduling and capacity planning
Measurement of worker performance
Work measurement is related to process planning because in a well-organized process planning system, a time standard must be determined for each of the operations listed on the route sheet.
The techniques used to determine time standards in manufacturing include the following:
1. Direct time study
2. The use of standard data
3. Predetermined time standard systems
4. Estimates based on previous experience
5. Work sampling
It is not the purpose of this book to explain each of these techniques. The reader is referred to one of the standard texts on work measurement, such as Mundel [11] or Niebel [12].
By far the most often used work measurement technique is direct time study. According to the survey, 46% of all standards are set by this method. Direct time study involves the direct observation of the task, timing the elements of the work cycle with a stopwatch, rating the performance of the operation (also called “leveling”), applying the necessary allowances (for personal delay, machine cycle, etc.), and calculating the standard time for the job. Among the disadvantages of the direct time study method are:
The performance rating is often disputed by the worker.
The time standard cannot be set until after the job is in production. This often means wasted time in the shop until after the standard has been set.
There tends to be variability in the standards among time study analysts.
Much time is required by the time study analyst in taking the study and calculating the standard.
Even though many of the jobs done in a given plant are similar, the stopwatch time study procedure must nevertheless be applied to all new jobs. (This, of course, depends on the terms of the labor—management agreement.)
In recent years, a number of computer packages have been commercially introduced for setting time standards. The objective of these computer packages is to reduce the time required in the development of work standards, and to overcome some of the problems associated with direct time study. In addition, these systems provide a manufacturing data base on operation time standards, standard cost data, tooling information, job instructions, and so on.
The computerized systems are based on the use of standard data stored in computer files. The term standard data, when applied in the context of work measurement, refers to previously determined time values corresponding to particular work elements or groups of work elements. These elements of various type comprise all manual production activities in the factory. For example, in a turret lathe operation, the workpiece must be loaded onto the machine and unloaded. The time required to load (or unload) the piece depends on the weight and configuration of the part, how it is to be fixtured in the turret lathe, and so on. Standard data can be developed to indicate the time required for the loading element as well as other work elements in the operation cycle. The individual element times depend on the attributes of the job (workpiece weight, size, machine tool, etc.). The computer stores these elemental times either in a data file or in the form of a mathematical formula. To use the package, the time study analyst must analyze the job to be timed by dividing it into its elements and specifying the attributes of the job for each element. The computer then retrieves from the file or calculates the element times, sums the times, and applies the necessary allowances to determine the standard time for the total cycle.
Among the advantages of using a computerized system for generating time standards are the following:
1. Reduction in time required by the time study analyst to set the standard. In application, a 50% reduction in clerical effort was reported compared to manual methods of applying standard data [23].
2. Greater accuracy and uniformity in the time standards.
3. Ease of maintaining the methods and standards file when engineering and methods changes occur.
4. Elimination of the controversial performance rating (leveling) step.
5. Time standards can often be set before the job gets into production.
6. Improved manufacturing data base for production planning, scheduling, forecasting labor requirements, tool control, and so on.
There are several available commercial systems for computerized work standards. We will use the 4M DATA system as an example of these packages. It is available from the MTM Association in Fair Lawn, New Jersey. 4M stands for “Micromatic Methods and Measurement.”
Example 13.41
1 This example is based on marketing literature furnished by the MTM Association, Refs. [7] and [8].
The 4M DATA system is a computerized work measurement system for applying MTM-1 predetermined time standards. The current version is MOD II. The MTM-1 motions are elementary body motions that are used in all manual production operations. About 90% of the manual work performed in the typical industrial situation consists of the motions REACH, GRASP, MOVE, POSITION, and RELEASE. These motions can be combined into GET and PLACE motion groups. Special symbols for these two motion groups convey the necessary data to the 4M computer program for calculating the proper standard time values. In addition to the GET and PLACE motion groups, the computer program also recognizes all other MTM-1 motions with their corresponding variables. The methods/time study analyst can develop the time standard for a given manual operation cycle by calling the required elements in the 4M DATA package.
Figures 13.7 and 13.8 illustrate the GET and PLACE notations. Figures 13.9 and 13.10 show two of the output reports. Figure 13.9 shows the 4M Element Analysis form generated by the 4M DATA system for a particular operation. This report indicates the right-and left-hand activity for the sequence of elements in the operation. The time units (MUs) are 0.00001 h, which is typically used in the MTM system. Figure 13.10 shows an MTM analysis report (this is for a different operation than that shown in Figure 13.9). The various indices shown at the bottom
Figure 13.7 GET symbol in 4M DATA system. (Reprinted from Ref. [8] by permission of MTM Assotiation. Copy righted by the MTM Assotiation for Standards and Research. No reprint permission Without written consent From the MTM Assotiation, 16–01 Broadway, Fair Lawn, NJ 07410.)
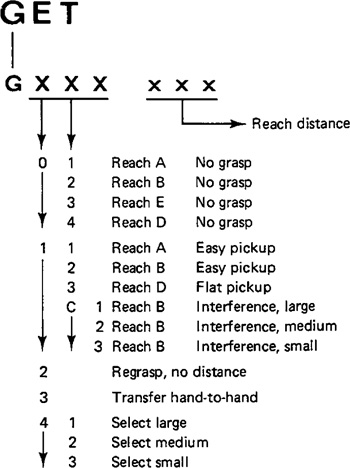
Figure 13.8 Place symbol in 4M DATA system. (Reprinted from Ref. [8] by permission of MTM Assotiation. Copy righted by the MTM Assotiation for Standards and Research. No reprint permission Without written consent From the MTM Assotiation, 16–01 Broadway, Fair Lawn, NJ 07410.)
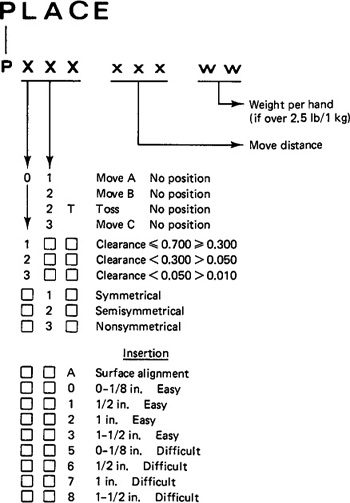
Figure 13.9 4M analysis output form generated by the 4M DATA system. (Reprinted from Ref. [8] by permission of MTM Association. Copyrighted by the MTM Association for Standards and Research. No reprint permission without written consent from the MTM Association, 16-01 Broadway, Fair Lawn, NJ 07410.)
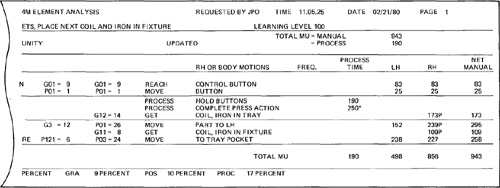
Figure 13.10 MTM analysis report generated by the 4M DATA system. (Reprinted from Ref. [8] by permission of MTM Association. Copyrighted by the MTM Association for Standards and Research. No reprint permission without written consent from the MTM Association, 16-01 Broadway, Fair Lawn, NJ 07410.)
of the report (MAI, RMB, GRA, and POS) represent various indices and ratios that might indicate possible methods improvements.
References
[1] COMPUTER AIDED MANUFACTURING—INTERNATIONAL, INC, Process Planning Program, PR-81-ASPP-01.3, Arlington, Tex., 1982.
[2] FIELD, M., AND ACKENHAUSEN, A. R., Determination and Analysis of Machining Costs and Production Rates Using Computer Techniques, Report AFMDC 68–1, Machinability Data Center, Cincinnati, Ohio, 1968.
[3] GROOVER, M. P., Automation, Production Systems, and Computer-Aided Manufacturing, Prentice-Hall, Inc., Englewood Cliffs, N.J., 1980, Chapters 16, 18.
[4] HALEVI, G., The Role of Computers in Manufacturing Processes, John Wiley ' Sons, New York, 1980, Chapters 11–14.
[5] HEGLAND, D. E., “Out in Front with CAD/CAM at Lockheed-Georgia,” Production Engineering, November, 1981, pp. 44–48.
[6] HOUTZEEL, A., “Computer-Assisted Process Planning Minimizes Design and Manufacturing Cost,” Industrial Engineering, November, 1981, pp. 60–64.
[7] MTM ASSOCIATION, “4M DATA: Computerized Work Measurement System,” Publication 3233–77, Fairlawn, N.J.
[8] MTM ASSOCIATION, “4M DATA—MOD II: A Computerized Work Measurement System,” Publication 3233–80B, Fairlawn, N.J.
[9] MACHINABILITY DATA CENTER, Machining Data Handbook, 2nd ed., Cincinnati, Ohio, 1972.
[10] MCNEELY, R. A., and MALSTROM, E. M., “Computer Generates Process Routings,” Industrial Engineering, July, 1977, pp. 32–35.
[11] MUNDEL, M. E., Motion and Time Study, 5th ed., Prentice-Hall, Inc., Englewood Cliffs, N.J., 1978.
[12] NFFIBEL, B. W., Motion and Time Study, 7th ed., Richard D. Irwin, Inc., Homewood, III., 1982.
[13] O’NEAL, M. H., AND MOORE, C., “Multi-plant Computer System for Standards Provides Tool for Overall Manufacturing Control,” Industrial Engineering, August, 1980, pp. 54–62.
[14] ONTTIRI, T. A., “The Development of a Simulator for Manufacturing Methods Decisions,” Ph.D. dissertation, Lehigh University, Bethlehem, Pa., 1981.
[15] ORGANIZATION FOR INDUSTRIAL RESEARCH, Inc., Miclass, Migroup, Miplan, Migraphics (marketing brochure), Waltham, Mass.
[16] PARSONS, N. R. (Ed.), NfC Machinability Data Systems, Society of Manufacturing Engineers, Dearborn, Mich., 1971.
[17] PRESSMAN, R. S., AND WILLIAMS, J. E., Numerical Control and Computer-Aided Manufacturing, John Wiley ' Sons, New York, 1977, Chapter 9.
[18] RICE, R. S., “Survey of Work Measurement and Wage Incentives,” Industrial Engineering, July, 1977, pp. 18–31.
[19] SCHAFFER, G., “GT via Automated Process Planning,” American Machinist, May, 1980, pp. 119–122.
[20] SCHAFFER, G., “Implementing CIM,” Special Report 736, American Machinist, August, 1981, pp. 151–174.
[21] TNO, The 1978 MICLASS User’s Meeting, Organization for Industrial Research, Inc., Waltham, Mass., 1978.
[22] TULKOFF, J., “Lockheed’s GENPLAN,” Proceedings, Eighteenth Annual Meeting and Technical Conference, Numerical Control Society, Dallas, Tex., May, 1981, pp.417–421.
[23] WEAVER, R. F., KOLLMAR, J. J., AND BOEPPLE, E. A., “Developing Standards by Computer,” Industrial Engineering, January, 1978, pp. 26–31.
[24] ZIMMERS, E. W., JR., “Practical Applications of Computer Augmented Systems for Determination of Metal Removal Parameters and Production Rate Standards in a Job Shop,” Tech Paper MS71–136, Society of Manufacturing Engineers, Dearborn, Mich., 1971.
Problems
13.1. Develop a simple parts classification and coding scheme of no more than four digits which can be used to uniquely code the various possible combinations of part attributes for the composite part of Figure 12.12. (The reader should refer back to Problem 12.3.) Make a list of all of the separate manufacturing operations needed to accomplish the machining of each part attribute. Using the coding scheme and the list of operations, write a computer program to accomplish retrieval-type automated process planning. The program should be written for interactive use. The user would enter the part code number, and the program would generate the list of operations in the correct sequence to machine that part. The program should not allow for any editing by the user.
13.2. Same as Problem 13.1 except that the program should allow for user editing of the retrieved plan for such purposes as inserting dimensions, changing text, and so on.
13.3. For a certain tool and work material, the parameters of the Taylor tool life equation, Eq. (13.2), are C = 1000 and n = 0.25. These parameters apply to a turning operation using a feed of 0.012 in per revolution and a depth of cut of 0.075. The following data also apply to the operation:
Machine and labor cost = $0.40/min
Tool cost = $0.60/cutting edge Tool change time = 1.5 min
Work diameter = 4.0 in.
Work length = 17.5 in.
Workpiece handling time = 4.0 min
Write a computer program to perform the necessary calculations and print out the results according to the general format illustrated in Figure 13.5. The work material is C4330 and the Rockwell hardness is C20. Tool grade is Carboloy 350. The following speeds should be used to construct the output table: 400, 500, 550, 600, 650, and 700 ft/min. The individual cost components should be separated as indicated by the terms of Eq. (13.1).