
Chapter 14
Industrial Ecology
14.1 Introduction
The environmental performance of chemical processes is governed not only by the design of the process, but also by how the process integrates with other processes and material flows. Consider a classic example—the manufacture of vinyl chloride.
Billions of pounds of vinyl chloride are produced annually. Approximately half of this production occurs through the direct chlorination of ethylene. Ethylene reacts with molecular chlorine to produce ethylene dichloride (EDC). The EDC is then pyrolyzed, producing vinyl chloride and hydrochloric acid.
Cl2 + H2C=CH2→Cl H2C-CH2Cl
Cl H2C-CH2Cl → H2C=CH Cl + HCl
In this synthesis route, one mole of hydrochloric acid is produced for every mole of vinyl chloride. Considered in isolation, this process might be considered wasteful. Half of the original chlorine winds up, not in the desired product, but in a waste acid. But the process is not operated in isolation. The waste hydrochloric acid from the direct chlorination of ethylene can be used as a raw material in the oxychlorination of ethylene. In this process, hydrochloric acid, ethylene, and oxygen are used to manufacture vinyl chloride.
HCl + H2C=CH2 + 0.5 O2 → H2C=CHCl + H2O
By operating both the oxychlorination pathway and the direct chlorination pathway, as shown in Figure 14.1-1, the waste hydrochloric acid can be used as a raw material and essentially all of the molecular chlorine originally reacted with ethylene is incorporated into vinyl chloride. The two processes operate synergistically and an efficient design for the manufacture of vinyl chloride involves both processes.
Figure 14.1-1 Byproduct hydrochloric acid from the direct chlorination of ethylene is used as a raw material in the oxychlorination process; by operating the two processes in tandem, chlorine is used efficiently.

Additional efficiencies in the use of chlorine can be obtained by expanding the number of processes included in the network. In the network involving direct chlorination and oxychlorination processes, both processes incorporate chlorine into the final product. Recently, more extensive chlorine networks have emerged linking several isocyanate producers into vinyl chloride manufacturing networks (McCoy, 1998). In isocyanate manufacturing, molecular chlorine is reacted with carbon monoxide to produce phosgene:
CO + Cl2 → COCl2
The phosgene is then reacted with an amine to produce an isocyanate and byproduct hydrochloric acid:
RNH2 + COCl2 → RNCO + 2 HCl
The isocyanate is subsequently used in urethane production, and the hydrochloric acid is recycled. The key feature of the isocyanate process chemistry is that chlorine does not appear in the final product. Thus, chlorine can be processed through the system without being consumed. It may be transformed from molecular chlorine to hydrochloric acid, but the chlorine is still available for incorporation into final products, such as vinyl chloride, that contain chlorine. A chlorine-hydrogen chloride network incorporating both isocyanate and vinyl chloride has developed in the Gulf Coast of the United States. The network is shown in Figure 14.1-2. Molecular chlorine is manufactured by Pioneer and Vulcan Mitsui. The molecular chlorine is sent to both direct chlorination processes and to isocyanate manufacturing. The byproduct hydrochloric acid is sent to oxychlorination processes or calcium chloride manufacturing. The network has redundancy in chlorine flows, such that most processes could rely on either molecular chlorine or hydrogen chloride.
Figure 14.1-2 Chlorine flows in combined vinyl chloride and isocyanate manufacturing (McCoy, 1998).
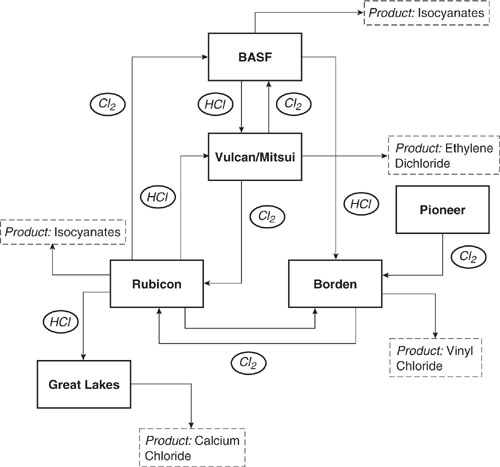
Consider the advantages of this network to the various companies (Francis, 2000):
• Vulcan/Mitsui effectively rents chlorine to BASF and Rubicon for their isocyanate manufacturing; the chlorine is then returned in the form of hydrochloric acid for ethylene dichloride/vinyl chloride manufacturing.
• BASF and Rubicon have guaranteed supplies of chlorine and guaranteed markets for their byproduct HCl.
Even more complex networks could, in principle be constructed. As shown in Table 14.1-1, chlorine is used in manufacturing a number of non-chlorinated products. Table 14.1-1 lists, for selected reaction pathways, the pounds of chlorinated intermediates used along the supply chain, per pound of finished product. This ranking provides one indication of the potential for networking these processes with processes for manufacturing chlorinated products (see Rudd, et al., 1981, or Chang, 1996).
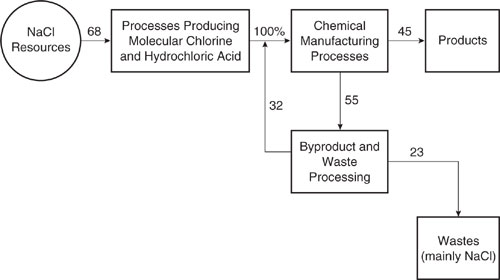
An examination of individual processes, such as those listed in Table 14.1-1, can be useful in building process networks, but the individual process data do not reveal whether efficient use of chlorine is a major or a minor issue in chemical manufacturing. To determine the overall importance of these flows, it is useful to consider an overall chlorine balance for the chemical industry. The overall flows of chlorine into products and wastes, as well as the recycling of chlorine in the chemical manufacturing sector, is shown in Figure 14.1-3. The data indicate that roughly a third of the total chlorine eventually winds up in wastes. By employing the types of networks shown in Figures 14.1-1 and 14.1-2, the total consumption of chlorine could be reduced.
Identifying which processes could be most efficiently integrated is not simple and the design of the ideal network depends on available markets, what suppliers and markets for materials are nearby, and other factors. What is clear, however, is that the chemical process designers must understand not only their process, but also processes that could supply materials, and processes that could use their byproducts. And the analysis should not be limited to chemical manufacturing. Continuing with our example of waste hydrochloric acid and the manufacture of vinyl chloride, byproduct hydrochloric acid could be used in steel making or byproduct hydrochloric acid from semiconductor manufacturing might be used in manufacturing chemicals.
Table 14.1-1 Partial Listing of Non-Chlorinated Chemical Products That Utilize Chlorine in Their Manufacturing Processes (Chang, 1996).
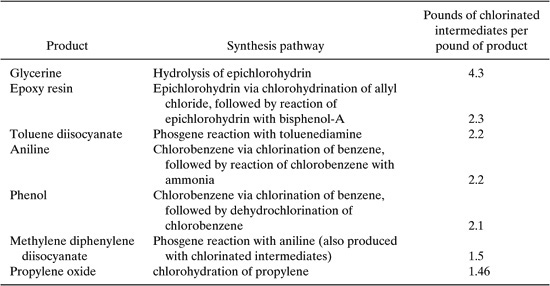
Figure 14.1-3 A summary of flows of chlorine in the European chemical manufacturing industry (Francis, 2000)
Finding productive uses for byproducts is a principle that has been used for decades in chemical manufacturing. What is relatively new, however, is the search for chemical byproduct uses in industries that extend far beyond chemical manufacturing. This chapter will examine both of these topics—the overall flows of raw materials, products and byproducts in chemical manufacturing industries—as well as the potential for combining material and energy flows in chemical manufacturing with material and energy flows in other industrial sectors. Variously called byproduct synergy, zero waste systems, or even industrial ecology, the goal of this design activity is to create industrial systems that are as mass-efficient as possible.
Section 14.2 provides an overview of material flows in chemical manufacturing and describes analysis methods that can be used to optimize flows of materials. Section 14.3 examines case studies of exchanges of materials and energy across industrial sectors and the emerging concept of eco-industrial parks. Finally, Section 14.4 briefly attempts to assess the potential benefits of byproduct synergies.
14.2 Material Flows in Chemical Manufacturing
The chemical manufacturing industries are a complex network of interrelated processes. An individual process typically relies on other chemical manufacturing processes for raw materials and as markets for its products. Take the manufacture of styrene as an example. Styrene manufacturing relies on ethylene and benzene, manufactured in other processes, for raw materials. The styrene is not sold as a consumer product; rather, it is used as a raw material for polystyrene manufacturing. Additional complexity arises from the fact that most sequences of chemical manufacturing process are not unique. There are generally a variety of pathways available for manufacturing products.
As a relatively simple example of the multiple pathways available in chemical synthesis, again consider styrene. Styrene is produced from ethylene and benzene, but the source of the ethylene might be naptha, or refinery gases. Benzene might be produced by dehydrogenation of cyclohexane, dealkylation of toluene or separation from crude oil. These options provide multiple pathways from raw materials to styrene. Each route has raw material requirements, energy requirements, water usage, and rates of emissions and waste generation.
Selecting the most environmentally benign and most economical route is a difficult proposition. It is made even more difficult when the entire chemical supply chain is considered. For example, in methanol production, the methanol is produced using carbon monoxide. The carbon monoxide in turn may be produced through a partial oxidation of a material that is currently wasted by another process. On the other hand, to convert the carbon monoxide into methanol requires hydrogen, which is an energy-intensive material. Evaluations of the environmental features of producing a chemical product should examine the entire chemical raw material supply chain, but to realistically examine these supply chains requires comprehensive, integrated models of material flows in the chemical process industries.
Fortunately, such models have been developed. Rudd and co-workers have developed basic material and energy flow models of over 400 chemical processes associated with the production of more than 200 chemical products (Rudd, et al., 1981), describing a complex web of chemical manufacturing technologies.
An understanding of material flows in these networks can be used at a variety of levels. First, the material flow networks can be used simply to identify potential users and suppliers of materials, and to identify networks of processes that are strategically related. For example, for the types of networks considered in Section 14.1, it would be useful to have lists of processes that produce and consume hydrochloric acid. A partial list is given in Table 14.2-1.
Once consumers and producers of targeted chemicals are identified, material and energy flow models can be used to construct networks. The network that makes the most sense depends on the features that are to be optimized. Analyses have been performed to identify networks that minimize energy consumption (Sokic, et al., 1990a,b), the use of toxic intermediates (Yang, 1984; Fathi-Afshar and Yang, 1985), and chlorine use (Chang and Allen, 1997). Other analyses have considered the response of networks to perturbations in energy supplies (Fathi-Afshar, et al., 1981) and restrictions on the use of toxic substances (Fathi-Afshar and Rudd, 1981). Regardless of the application, however, the material flow model of the chemical manufacturing web provides the basic information necessary to identify and optimize networks of processes.
Table 14.2-1 Partial List of Processes That Produce or Consume Hydrochloric Acid. Such lists are useful in identifying potential material exchange networks.

Table 14.2-2 Processes for Reducing Chlorine Use in Chemical Manufacturing.
Process description |
Chlorine via electrolysis of hydrogen chloride (Ker-Chlor process) |
Chlorine via oxidation of hydrogen chloride (CuCl2 catalyst) |
Chlorine via oxidation of hydrogen chloride (HNO3 catalyst) |
Yet another use of comprehensive material flow models is in the evaluation of new technologies (Chang and Allen, 1997). Consider once again the case of chlorine use in chemical manufacturing. Rather than generating complex networks involving HCl and molecular chlorine, as described in Section 14.1, it might be preferable to use a chemistry that converts waste HCl into molecular chlorine. Several processes have been proposed and are listed in Table 14.2-2.
These processes will only be successful if they can compete with the reuse of byproduct HCl, in the types of networks described in Section 14.1. Data on material and energy flows in the chemical manufacturing web can again be used to assess the competitiveness of new chemical pathways, such as the technologies listed in Table 14.2-2.
14.3 Eco-Industrial Parks
The examples of process networking described in Sections 14.1 and 14.2 dealt exclusively with chemical manufacturing. Yet, the types of material and energy flows found in chemical manufacturing (solvents, acids, water, energy, salts) are used in a wide variety of industrial sectors. It would therefore seem reasonable to consider designing industrial networks that involve a variety of industries.
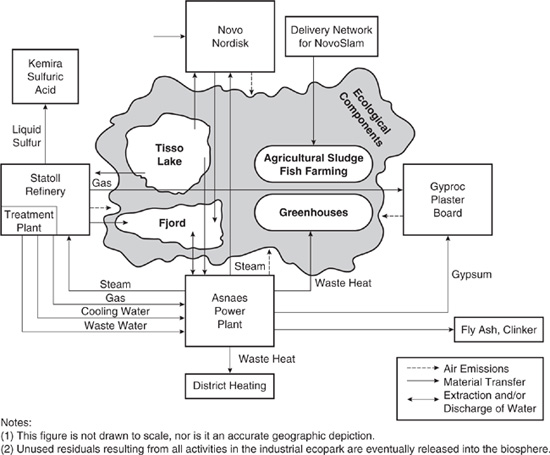
One of the classic examples of this type of network is a group of facilities located at Kalundborg in Denmark. At Kalundborg, an oil refinery, a sulfuric acid plant, a pharmaceutical manufacturer, a coal burning power plant, a fish farm, and a gypsum board manufacturer form an industrial network, exchanging flows of energy and mass. As shown conceptually in Figure 14.3-1, the power plant and the refinery exchange steam, gas, and cooling water. Waste heat from the power plant is used in district residential heating and to warm greenhouses and a fish farm. Ash from coal combustion at the power plant is shipped to cement manufacturers. Calcium sulfate from the scrubbers at the power plant is sent to the gypsum board manufacturer. Treated process sludges from the pharmaceutical plant are sent to local farmers for use as fertilizer, and the refinery sends hot liquid sulfur from the desulfurization of crude oil to a sulfuric acid manufacturer (Ehrenfeld and Gertler, 1997).
A more detailed examination of the exchanges of material and energy at Kalundborg reveals a number of interesting features.
(1) This figure is not drawn to scale, nor is it an accurate geographic depiction.
(2) Unused residuals resulting from all activities in the industrial ecopark are eventually released into the biosphere.
Figure 14.3-1 The industrial network at Kalundborg, Denmark. (Ehrenfeld and Gertler, 1997)
• The ecopark developed over a period of more than 30 years. Some material and energy exchanges have occurred for decades and the exchanges continue to grow in extent.
• The exchanges have the potential to be remarkably efficient. For example, the power plant is able to use some of the waste heat and steam produced through power generation by sending it to the refinery, greenhouses, the fish farm, and the district heating system. If markets were found for all of the waste steam, up to 90% of the heat from the plant’s combustion of coal could be utilized. The only losses would be energy escaping with the stack gases. By contrast, typical coal-burning power plants in the United States use heat from combustion solely to generate electricity, at an efficiency of about 40%.
• Material and energy exchanges provide economic benefits to the participants. In some cases, such as the power plant’s sale of calcium sulfate to the gypsum board manufacturer, the direct economic benefits do not fully cover the recovery costs. In these cases, the exchanges are driven by regulations, such as those requiring the scrubbing of power plant stack gases to remove SO2. The exchanges simply lower the cost of compliance by making it unnecessary to landfill or otherwise dispose of the waste generated by the scrubbers. In other cases, such as the use of power plant waste heat in the refinery, the exchanges are self-supporting.
The central facilities in the Kalundborg Ecopark are the power plant and the oil refinery. Many of the exchanges either originate from or go to the power plant or the refinery. While using a power plant or a refinery as a central facility is a concept that could be successful in other locations, many other approaches are possible. Consider, for example, an eco-industrial park in North Texas where the central facility is a steel mill. This facility, shown conceptually in Figure 14.3-2, utilizes scrap cars as the primary feed material. The steel from the vehicles goes to an electric arc furnace, producing a variety of steel products. The furnace also produces a significant quantity of electric arc furnace (EAF) dust, which contains significant quantities of zinc, lead, and other metals. In the North Texas facility, the EAF dust is sent to a cement kiln where the trace metals (copper, sulfur, manganese, chromium, nickel, zinc, lead, and others) have value. Automobile Shredder Residue can be burned for energy recovery, or some of the plastics in the residue can be separated.
Another alternative for electric arc furnace dust, currently being explored in Europe, is as a feed for zinc and lead recovery operations. The recovered zinc can then be used in producing galvanized steel products and batteries can be used as an alternative source of zinc.
These two case studies illustrate the basic principles of ecoparks—integrating flows of energy and materials in diverse industrial operations, increasing mass and energy efficiency. The two cases examined in this section involved exchanges between facilities that are located adjacent to each other; however, co-location of facilities is not always necessary.
Figure 14.3-2 Material flows in an eco-industrial park in North Texas.

14.4 Assessing Opportunities for Waste Exchanges and Byproduct Synergies
The previous sections have demonstrated anecdotally that productive uses can be found for selected waste streams. Are these anomalies, or are there large quantities of waste materials that can be productively used? This question is difficult to answer with certainty, but a few simple examples may illustrate the potential for finding new uses for waste.
One estimate of the potential for industrial exchanges of materials and energy can be drawn from a simple examination of energy flows in the United States. Approximately a third of the 80–100 quadrillion BTU of energy consumed annually in the United States is used for electric power generation. Of the energy used in electricity generation, roughly 2/3 is lost as waste heat. This means that roughly a quarter of all energy demand in the United States could be met through the utilization of lost heat. Combined heat and power systems are emerging throughout the country to take advantage of such opportunities, but much remains to be done.
A second example of the potential for conservation through material exchanges involves another ubiquitous material—water. Water is used in virtually all industrial processes and major opportunities exist for reuse since, in general, only a small amount of water is consumed; most water in industrial applications is used for cooling, heating, or processing of materials, not as a reactant. Further, different industrial processes and industrial sectors have widely varying demands for water quality. For example, waste water from a semiconductor manufacturing facility that requires ultrapure water may be suitable for a variety of other industrial applications. Thus, water exchanges and reuse provide a significant opportunity. An example of such opportunities is described by Keckler and Allen (1999).
Summary
This chapter has emphasized that the environmental performance of chemical processes is governed not only by the design of the process, but also by how the process integrates with other processes. Integration with other processes can occur through exchanges of material, through exchanges of energy, and through common use of utilities, such as cooling and process waters. To design efficient and economical processes, designers must systematically search out markets for byproducts; they should consider using byproducts from other processes as raw materials; and, perhaps most significantly, they should not restrict their searches to chemical manufacturing processes.
References
Chang D., and Allen, D.T., “Minimizing chlorine use: Assessing the trade-offs between cost and chlorine use in chemical manufacturing,” Journal of Industrial Ecology, 1(2), 111–134 (1997).
Ehrenfeld, J. and Gertler, N., “Industrial Ecology in Practice, The evolution of interdependence at Kalundborg,” Journal of Industrial Ecology, 1(1), 67–80 (1997).
Fathi-Afshar, S., and Rudd, D.F., “Impact of restrictions on toxic substances on the production of synthetic materials,” Polymer-Plastics Technology and Engineering, 16, 99–118, 1981.
Fathi-Afshar, S., Maisel, D.S., Rudd, D.F., Trevino, A.A., and Yuan, W.W., “Advances in petrochemical technology assessment,” Chemical Engineering Science, 36, 1487–1511, 1981.
Fathi-Afshar, S. and Yang, J., “Designing the optimal structure of the petrochemical industry for the minimum cost and least gross toxicity of chemical production,” Chemical Engineering Science, 40, 781–797, 1985.
Francis, C.G. personal communication, 2000.
Keckler, S.E. and Allen, D.T., “Material Reuse Modeling: A Network Flow Programming Approach,” Journal of Industrial Ecology, in press (1999).
M. McCoy, “Chlorine Links Gulf Coast Firms,” Chemical and Engineering News, September 7, 1998 pp 17–20.
Rudd, D. F., Fathi-Afshar, S., Trevino, A.A., and Stadtherr, M.A., Petrochemical Technology Assessment, John Wiley & Sons, New York, 1981.
Sokic, Milorad, Cvetkovic, R., and Trifunovic, Z., “Thermodynamic aspects of the utilization of coal-based raw materials within the system of the petrochemical industry,” Canadian Journal of Chemical Engineering, 65, 662–671, 1990a.
Sokic, Milorad, Zdravkovic, S., and Trifunovic, Z., “Multiobjective approach to the structuring of an efficient system for producing petrochemicals from alternative raw materials,” Canadian Journal of Chemical Engineering, 68, 119–126, 1990b.
Yang, J., “Designing the optimal structure of the petrochemical industry for the minimum cost and the least gross toxicity of chemical production,” M.S. Thesis, University of California, Los Angeles, 1984.
Problems
1. Identify processes that produce and consume the following chemicals. Report your results in a form similar to Table 14.2-1. Can you identify potential networks of processes that could exchange these materials?
Ammonia
Hydrogen
2. At the Kalundborg ecopark, waste heat in the form of steam is sent from the Asnæs Power Station to the Statoil refinery (140,000 tons/year), to the Novo Nordisk pharmaceutical manufacturing facility (215,000 tons/year), and to district heating (225,000 tons/year). The power plant is rated at 1,500 megawatts, and the steam has a recoverable heat of 1,000 BTU/lb. Each year the power plant burns approximately 4.5 million tons of coal rated at 10,000 BTU/lb.
(a) Calculate the fraction of the energy from coal combustion that goes to electricity generation, to the refinery, to the pharmaceutical plant, and to district heating. What is the total rate of energy utilization?
(b) Not all of these energy demands will operate on similar cycles. Project the daily and seasonal variations in demand and suggest ways for the power plant to meet these needs.
(c) Calculate the quantity of residential heating oil consumption that is displaced by the use of steam. If oil costs $2.00 per gallon and each gallon has a heating value of approximately 1.5*105 BTU, what is the value of this resource?
3. The case studies presented in Section 14.3 highlighted the opportunities for co-locating refineries and power plants, cement kilns and steel mills. Use the information available in the Toxic Release Inventory (www.epa.gov/Tri/) to identify locations of refineries, power plants, steel mills and cement plants in your state. Are any co-located? Can you suggest other industries in your state that might be able to exchange materials or energy?