
Chapter 2
Risk Concepts
Risk: the probability that a substance or situation will produce harm under specific conditions. Risk is a combination of two factors: the probability that an adverse event will occur and the consequences of the adverse event.
The Presidential/Congressional Commission on Risk Assessment & Risk Management, Vol. 1, 1997
2.1 Introduction
Risk is a concept used in the chemical industry and by practicing chemical engineers. The term risk is multifaceted and is used in many disciplines such as: finance (rate of return for a new plant or capital project, process improvement, etc.), raw materials supply (single source, back integration), plant design and process change (new design, impact on bottom line), and site selection (foreign, political stability). Though the term risk used in these disciplines can be discussed either qualitatively or quantitatively, it should be obvious that these qualitative or quantitative analyses are not the same in all fields (financial risk ≠ process change risk). This chapter will focus on the basic concept of environmental risk and risk assessment as applied to a chemical’s manufacturing, processing, or use, and the impact of exposure to these chemicals on human health or the environment.
Risk assessment is a systematic, analytical method used to determine the probability of adverse effects. A common application of risk assessment methods is to evaluate human health and ecological impacts of chemical releases to the environment. Information collected from environmental monitoring or modeling is incorporated into models of human or worker activity and exposure, and conclusions on the likelihood of adverse effects are formulated. As such, risk assessment is an important tool for making decisions with environmental consequences. Almost always, when the results from environmental risk assessment are used, they are incorporated into the decision-making process along with economic, societal, technological, and political consequences of a proposed action.
Section 2.2 provides a general description of risk, risk categories, and a conceptual expression of chemical risk. The value of risk assessment in design and the pertinent environmental regulations to the engineering profession are described in Sections 2.3 and 2.4. The rest of the chapter covers risk assessment and its four major components: hazard assessment, dose-response, exposure assessment, and risk characterization. (Sections 2.5 through 2.9). Later chapters further expand on these risk concepts and their applications.
2.2 Description of Risk
Risks can be grouped into three general categories:
• Voluntary risk: A result of actions taken by choice or out of necessity. Examples include firefighting, driving, bungee cord jumping, and lifestyle choices such as diet and smoking.
• Natural disasters: These include floods, hurricanes, earthquakes, and other disasters that are beyond human control. However, the risk to natural disasters can be exacerbated by such voluntary actions as living in a known flood plain or on an active earthquake fault.
• Involuntary risk: Risk resulting from uncontrollable actions of others. Examples include pesticide residues or pathogens in food, occupational exposure to industrial chemicals or being murdered. These risks tend to have more uncertainty and are not as well known.
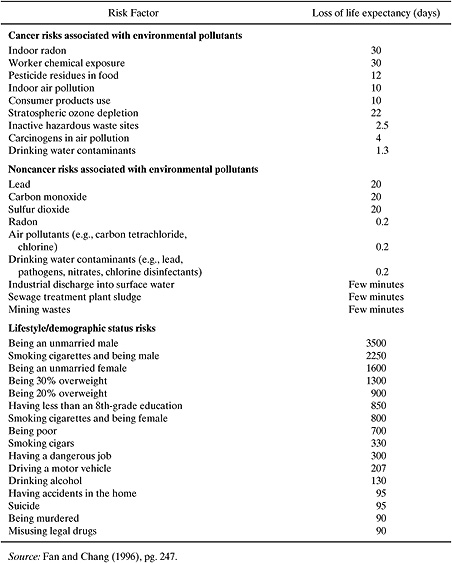
Quantitatively, in the above categories, risk in the first two groupings voluntary and natural) is frequently determined by actuarial-based statistics (e.g., fatalities are correlated with activity, location, and other parameters). In involuntary exposure, such as those to chemicals, risk, for the most part, is based on inferred data (animal tests, analogs, extrapolation). People are more familiar with expressions of risk associated with various activities than they are with risks associated with chemical exposure. Table 2.2-1 lists one assessor’s evaluation of various risk factors, where being the unmarried male causes the greatest loss of life expectancy.
Risks from toxic chemicals, depending on the context, may be defined, described, and calculated in different ways. Risk is normally defined as the probability for an individual to suffer an adverse effect from an event. What is the probability that certain types of cancer will develop in people exposed to aflatoxin in peanut products or benzene from gasoline? What is the likelihood that workers exposed to lead will develop nervous system disorders? In the context of this text, a chemical release is an example of an event. As with any relationship expressing or using probability, there is no defined way of expressing (mathematically or with scientific rigor) a single deterministic value of a phenomenon that is probabilistic. A fairly simple conceptual way of expressing chemical risk is shown below.
Table 2.1-1 Loss of Life Expectancy from Various Societal Activities and Phenomena.
Hazard is the potential for a substance or situation to cause harm or to create adverse impacts on persons or the environment. The magnitude of the hazard reflects the potential adverse consequences, including mortality, shortened life-span, impairment of bodily function, sensitization to chemicals in the environment, or diminished ability to reproduce. Exposure denotes the magnitude and the length of time the organism is in contact with an environmental contaminant, including chemical, radiation, or biological contaminants.
When risk is in terms of probability, it is expressed as a fraction, without units. It has values from 0.0 (absolute certainty that there is no risk) to 1.0 (absolute certainty that an adverse outcome will occur).
For chemicals the term hazard is typically associated with the toxic properties of a chemical specific to the type of exposure. Similar chemicals would have similar innate hazards. However, one must examine the exposure to that hazard to determine the risk. For example, let us say you have three pumps that are all transporting the same chemical (same hazard), but one pump has a seal leak. Which pump poses the greatest risk to the worker? The pump with the seal leak has the greatest potential for exposure, while the hazards are equal (same chemical), so the seal leak pump poses the greatest risk. To expand, let’s say we have three pumps that are transporting different chemicals; which one poses the greatest risk to the worker? In this case the engineer would need to examine the hazard—or innate inherent toxicity—of each of the chemicals, as well as the operation of the pumps to determine which poses the greatest risk. Assessment of the inherent toxicity of various chemicals (hazards) is covered in greater detail in later chapters.
If a chemical is known to present dermal hazard, the exposure would be expressed as surface area of potentially exposed skin multiplied by the mass of the chemical per unit of surface area of skin that it contacts. In this text, the exposure term in the above equation, unless otherwise stated, will be for human exposure (ingestion, inhalation, and dermal). A detailed discussion of the pathways for worker and general population exposure can be found in Chapter 6.
The concept of exposure and hazard equating to risk may be applied in different ways, depending on the information available. In addition, risks may be described across pathways or routes, or as a comparison between, say, using one chemical versus another. In the future, research is likely to reveal completely new sources of chemical risks which were previously unknown. For example, stratospheric ozone depletion and endocrine disrupters were emerging concepts when the authors of this text were engineering students. Today, the level of risk can be much more accurately characterized. The risk assessment framework presented in this chapter is sufficiently flexible to apply even to new sources of risk from chemical releases as they are recognized.
Example 2.2-1: Interaction of Toxic Agents.
Smoking may act synergistically with toxic agents found in the workplace to cause more severe health damage than that anticipated from adding the separate influences of the occupational hazard and smoking. In a study of 370 asbestos workers, 24 of 283 cigarette smokers died of bronchogenic carcinoma during the four year period of the study, while not one of the 87 non-smokers died of this cancer (Selikoff, 1968). This study suggested that asbestos workers who smoke have eight times the risk of lung cancer as compared to all other smokers and 92 times the risk of nonsmokers not exposed to asbestos. This same group of insulation workers was restudied five years later, at which time 41 of the 283 smokers had died of bronchogenic cancer. Only 1 of the 87 noncigarette smokers, a cigar smoker, died of lung cancer (Hammond, 1973).
Other chemicals and occupational exposures which appear to act synergistically with tobacco smoke include radon daughters, gold mine exposures, and exposures in the rubber industry. (Lednar, 1977)
2.3 Value of Risk Assessment in the Engineering Profession
Risk assessment may be conceptualized as simply a means of organizing and analyzing all available scientific information that addresses the question, what are the risks associated with a chemical manufacturing process or use of a chemical product? If an engineer is asked to conduct a comprehensive assessment, such as developing an Environmental Impact Statement for a proposed new facility, a major study of this magnitude would necessitate the formation of a team of appropriate professionals (engineer, toxicologist, ecologist, chemist, industrial hygienist, medical and legal staff, etc.). It is critical that the resulting assessment focus not only on the quantitative aspects of risk but also the qualitative character of risk. This need for qualitative assessment is often driven by serious data gaps in health and ecotoxic effects, which preclude precise quantification of all impacts.
From an engineering perspective, it may be useful to think of risk as safety issues extrapolated from the present to the long term. That is, safety may be thought of as the likelihood of immediate adverse consequences, and risk as the likelihood of long-term adverse consequences. Engineers can elevate risk concerns from chronic exposures to toxic chemicals to the same level of concern as safety issues. As with safety issues, the potential for chemical risks is only one of many factors that influences decisions. Financial considerations will always be paramount in business decisions. However, significant chemical risks may be a vital consideration in some instances and may carry financial consequences as well. The task before the engineer is to understand, quantify, and communicate risk issues as comprehensively as possible.
One important distinction between long-term risk and conventional safety issues is that while the consequences of chemical accidents are readily linked to their cause, chronic exposures from chemicals often are not. For chemical accidents, injuries and property damage can be anticipated via some level of process hazard analysis (PHA) such as fault tree analysis, or Hazards and Operability Studies (HAZOP). A simple case study utilizing one of these methods is shown in Example 2.3-1. If a facility experiences a chemical explosion that shatters windows and injures nearby residents, everyone in the community and the facility management knows the source of the injury or damage. The results are immediate. In contrast, it is often extremely difficult to link a local epidemic of cancers to a chemical exposure that may have occurred decades before. The uncertainties associated with long-term risks render them difficult for managers to grapple with effectively. These distinctions between chronic risks and traditional safety issues create an important barrier to elevating chronic emission and release issues to the same level as safety concerns. (See Chapter 4, The Roles & Responsibilities of the Chemical Engineer, for further coverage of this topic.)
It is worth stressing that any risk assessment should be carefully and fully documented, including specific references for data used and calculations used to reach a conclusion. One of the more significant differences among many standard engineering tasks and a risk assessment is the “volatility” of the input data. It is for this reason that careful, complete documentation with narrative is a requirement for a comprehensive risk assessment. Risk assessment, when incorporated into process design, can have a positive impact on the environment as well as positive economic benefits. (See Chapter 12, Environmental Cost Accounting, for further coverage of this topic.)
Whether the risk assessment is broad or narrow in scope, the concepts presented here remain the same. As documented throughout this text, mathematical and database-derived computer models can assist in providing estimates of hazards and exposures. Methods presented in the subsequent chapters will enable the engineer to make design decisions based on chemical risk, even when some of the data gaps have not been filled.
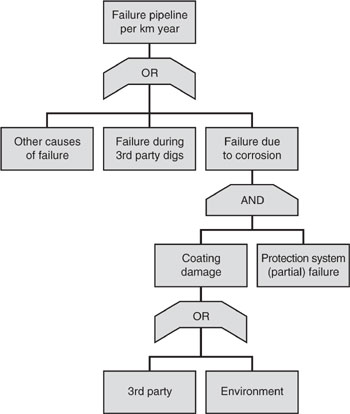
Example 2.3-1: Fault Tree Analysis.
Underground gas pipelines can fail when an operator of construction equipment punctures the pipeline. The pipeline can also fail due to corrosion when the coating separating the pipeline from the soil is damaged and the sacrificial cathode fails to inhibit rusting of the pipeline. Damage to the coating may be due to abrasion by human activity or degradation in the environment. Based on this statement, draw a fault tree for the possible failure of a gas pipeline (Cooke, 1998).
Figure 2.3-1 Fault tree analysis of gas pipelines demonstrating possible modes of failure.
Solution:
2.4 Risk-Based Environmental Law
Many environmental statutes (laws) incorporate risk management as a goal of the legislation. Some environmental laws consider economic impacts of risk management as well. For example, the provisions of the Clean Air Act pertaining to National Ambient Air Quality Standards call for standards that “protect the public health allowing an adequate margin of safety.” That is, these standards mandate protection of public health based only on risk, without regard to technology or cost factors. In contrast, the Clean Water Act requires industries to install specific treatment technologies. These have descriptions like “best practicable control technology,” and “best available technology economically achievable.” Pesticides are licensed if they don’t cause “any unreasonable risks to man or the environment taking into account the economic, social, and environmental costs and benefits of the use of any pesticide.” In other words, economic and other factors may or may not be combined with risk issues as regulations are developed. These details become important if the engineer is required to understand and follow the regulations or even requested to comment regarding proposed regulations (see Patton, 1993).
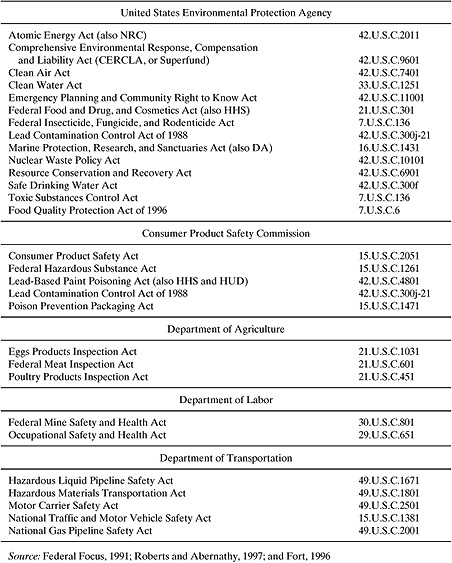
Table 2.4-1 lists selected United States safety, health, and environmental statutes that require or suggest human health risk assessment before regulations are promulgated. The list is enormous, and will probably grow with time. Chapter 3 describes some of these statutes in greater detail.
2.5 General Overview Of Risk Assessment Concepts
In 1983, the National Research Council (NRC, 1983) developed a risk assessment framework for federal regulatory agencies that is still in place today. That framework states that a risk assessment should estimate adverse impacts to health or the environment and determine whether these impacts pose a serious threat. Risk assessment consists of four major components: hazard assessment, dose-response, exposure assessment, and risk characterization.
1. Hazard Assessment. What are the adverse health effects of the chemical(s) in question? Under what conditions? For example, does it cause a certain kind of cancer? Toxicologists usually perform this analysis. Since this information is pertinent to use of a chemical, sometimes hazard information can be obtained from reference data.
2. Dose-Response. How much of the chemical causes a particular adverse effect? There may be multiple adverse health effects, or responses, for the same chemical at different concentrations. Each adverse effect has a unique doseresponse curve. The dose-response curve is non-linear because some members of the population are more sensitive than others.
For our purposes, dose is defined as the quantity of a chemical that crosses a boundary to get into a human body or organ system. The term applies regardless of whether the substance is inhaled, ingested, or absorbed through the skin. Dose-response, then, is a mathematical relationship between the magnitude of a dose and the extent of a certain negative response in the exposed population.
3. Exposure Assessment. Who is exposed to this chemical? How much of the chemical reaches the boundary of a person, and how much enters the person’s body? Exposure may be measured, estimated from models, or even back-calculated from measurements called biomarkers taken from exposed people.
4. Risk Characterization. How great is the potential for adverse impact from this chemical? What are the uncertainties in the analyses? How conclusive are the results of these analyses?
This general risk assessment framework has been tailored to human health risk assessment from exposure to chemicals. A risk assessment team may decide that specific aspects of the eco-assessment require attention. This level of activity is critical for new plant siting (grass-roots), which must include a thorough examination of the ecosystems in-place as well as unique areas (wetlands, forests, endangered species habitat).
Table 2.4-1 United States Safety, Health, and Environmental Statutes That Imply Risk Assessment.
The risk assessment process can be iterative. That is, if a cursory or screening risk assessment identifies concerns, a more rigorous process may be called for. This process may in turn illustrate that there are important data gaps that need to be filled to render the process sufficiently conclusive for risk management. The data gaps may be filled with recommendations for special studies with varying cost and time requirements, such as:
• proceeding with testing for health effects;
• evaluating the effectiveness of engineering controls and personnel protective equipment (PPE) to limit exposures;
• defining the kinetics and decomposition products of a waste stream and the impact of the chemical waste and its degradation products on local flora and fauna.
If it is reasonably clear from the risk assessment that a risk exists, the next step is risk management.
Risk management is the process of identifying, evaluating, selecting, and implementing actions to reduce risk to human health and to ecosystems. The goal of risk management is scientifically sound, cost effective, integrated actions that reduce or prevent risks while taking into account social, cultural, ethical, political, and legal considerations. (Presidential Commission, 1997)
Risk managers must clearly answer many questions, some of which are:
• What level of exposure to a chemical risk agent is an unacceptable risk?
• How great are the uncertainties and are there any mitigating circumstances?
• Are there any trade-offs between risk reduction, benefits, and additional cost?
• What are the chances of risk shifting, that is, transferring risk to other populations?
• Are some of the risks worse than others?
The answers to these questions often depend on the culture and values of the organization that commissioned the risk assessment. Minimizing risk through improved engineering design and proactive process development should be core values of the engineer.
2.6 Hazard Assessment
In the context of this text, a hazard is an adverse health effect related to chemical exposure. This section begins with a discussion of hazard assessment. It continues with a discussion about structural activity relationships, which are tools used to screen hazards in the absence of chemical-specific laboratory data, based on the known hazards of materials with similar chemical structures. A brief description of readily available references concerning known hazards may be found at the end of this Hazard Assessment section.
As noted above, a chemical exposure hazard assessment answers the question: What are the adverse effects of a chemical? The most common adverse effects, or endpoints, studied are various kinds of cancer, but other types of adverse health effects such as endocrine disruption or reproductive toxicity are also currently being studied. Effects immediately dangerous to life or health may result from a high but brief or acute exposure, while long-term effects may result from chronic exposures to low levels of a toxin that are insufficient to cause any acute effects. Health effect studies are usually performed on rodents; these studies are called subchronic effects studies, and provide the basis for estimating a particular hazard or hazards.
Example 2.6-1: Endocrine Disruptors.
There is evidence that domestic animals and wildlife have suffered adverse consequences from exposure to environmental chemicals that interact with the endocrine system. These problems have been identified primarily in species exposed to relatively high concentrations of organochlorine pesticides, PCBs, dioxins, and synthetic and plant-derived estrogens. Whether similar effects are occurring in the general human or wildlife populations from exposures to ambient environmental concentrations is unknown. For example, while there have been reports of declines in the quantity and quality of sperm production in humans over the last four decades, other studies show no decrease. Reported increases in incidences of certain cancers (breast, testes, prostate) may also be related to endocrine disruption. Because the endocrine system plays a critical role in normal growth, development, and reproduction, even small disturbances in endocrine function may have profound and lasting effects. This is especially true during highly sensitive prenatal periods, such that small changes in endrocrine status may have delayed consequences that are evident much later in adult life or in a subsequent generation. Furthermore, the potential for synergistic effects from multiple contaminants exists.
2.6.1 Cancer and Other Toxic Effects
Cancers of various organs or systems are among the most thoroughly studied toxic effects. Other examples of toxic effects which are known to be caused by chemical substances are decreased pulmonary capacity caused by inhalation of asbestos, and damage to the nervous system and internal organs resulting from ingestion of lead, mercury, and other metals. Chemical exposures may also induce neurotoxicity, reproductive toxicity, or developmental toxicity. A relatively new discipline, developmental toxicity, refers to birth defects and other toxic effects which become apparent after birth, and which may be rooted in the prenatal period.
From the perspective of hazard assessment, cancer can be caused by two different types of chemical substances—genotoxic carcinogens and nongenotoxic carcinogens. Genotoxic chemicals are believed to have no threshold amount below which they will NOT cause cancer. Theoretically, one molecule of a genotoxic carcinogen could alter DNA and cause a mutation. In most cases, such an exposure would not cause cancer because of natural mechanisms which can repair internal damage caused by exposures at this level. Unfortunately, only (expensive) mechanistic studies can distinguish whether a carcinogen is genotoxic or not. In the absence of these studies, genotoxicity is generally assumed (Velazquez et al. 1997).
In contrast, nongenotoxic carcinogens are believed to have a safe threshold quantity. This becomes clearer from dose-response assessment, which is discussed below. For the purpose of risk assessment, nongenotoxic substances are analyzed much like chemicals with endpoints other than cancer by using the concept of a Hazard Quotient, which is also discussed below. There are other concepts for addressing quantitative estimates of risk, but they are beyond the scope of this chapter.
2.6.2 Hazard Assessment for Cancer
US EPA has developed guidelines for hazard assessment of chemical carcinogens. There are three types of information used to make the hazard determination: human data, animal data, and supporting data. The data are first evaluated as to their conclusiveness. Then, the substance is classified, usually as part of one of the following groups:
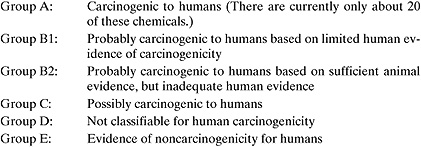
Organizations other than US EPA have developed alternative classification schemes for toxic chemicals. For example, Table 2.6-1 lists thirteen chemical substances, by name and CAS number, regulated by OSHA as human carcinogens. The previous use of the substance is also listed. Due to the ecotoxic concerns of these chemicals, many are no longer in commerce and/or have been replaced with less hazardous alternative chemistries. Other organizations such as the American Conference of Governmental Industrial Hygienists (ACGIH) also classify chemicals according to the evaluated risk for human carcinogenicity.
Once this determination of Carcinogen Group is made using US EPA’s or other guidelines, supporting information, such as mechanistic data, is considered. This information may be used to shift the above classification. The determination of classification requires careful professional judgment and peer review.
Example 2.6-2: Cancer Slope Factor.
A study of the potential of acrylonitrile to produce brain tumors in Fischer 344 rats was conducted by administering the carcinogen in drinking water for twenty-four months. The results of the study for female rats are tabulated below. Use a linear model of the relationship between the administered dose and the incidence of tumors to calculate the slope factor for acrylonitrile (Monsanto, 1980).
Table 2.6-1 Thirteen OSHA-Regulated Carcinogens (29CFR 1910.1003).

Tumor data for acrylonitrile-induced brain tumors in the Fischer 344 rats
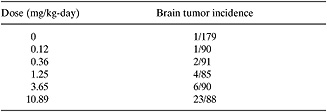
Solution: Convert the data to decimal equivalents and subtract the deaths at zero concentration to obtain the excess risk at each dose level. Fit the data with a linear equation, excess deaths m * dose rate (mg/kg-day), where m is the slope factor. Finally compare the deaths predicted with the regression data with the observed frequencies.

m=∑(excess risk)/∑(dose, mg/kg-day) 0.3802/16.27 mg/kg-day 0.0234/(mg/kg-day)
2.6.3 Hazard Assessment for Non-Cancer Endpoints
Adverse effects other than cancer and gene mutations are generally assumed to have a dose or exposure threshold. As a result, a different approach is used to evaluate potential risk for these non-cancer effects, which include liver toxicity, neurotoxicity, and kidney toxicity. The first step in this approach requires the identification of a critical effect for which the magnitude of the response can be assessed. The Reference Dose (RfD) or Reference Concentration (RfC) approach is used to evaluate such chronic effects. The RfD is defined as “an estimate (with uncertainty spanning perhaps an order of magnitude) of a daily exposure to the human population that is likely to be without appreciable risk of deleterious effects during a lifetime” (US EPA, 2000) and is expressed as a mg pollutant/kg body weight/day. The RfC is expressed as a concentration, or mg/m3. Roughly speaking, it is the baseline “safe” dose or concentration to which a real exposure may be compared (US EPA, 2000).
The RfD or RfC is usually based on the most sensitive known effect—i.e., the effect that occurs at the lowest dose. The basic approach for deriving an RfD or RfC involves determining a “no-observed-adverse-effect level (NOAEL)” or “lowest-observed-adverse-effect level (LOAEL)” from an appropriate animal study or human epidemiologic study, and applying various uncertainty and modifying factors to arrive at the RfD/RfC. Each factor represents a specific area of uncertainty. The uncertainty surrounding these terms spans about an order of magnitude. For example, an RfD based on an NOAEL from a long-term animal study might incorporate a factor of 10 to account for the uncertainty in extrapolating from the test species to humans, and another factor of 10 to account for the variation in sensitivity within the human population. Another common uncertainty factor may be used to extrapolate from subchronic test exposures to potentially chronic human exposures. An RfD based on an LOAEL typically contains an additional factor of 10 to account for the extrapolation from LOAEL to NOAEL. Finally, another modifying factor (between 1 and 10) is sometimes applied to account for uncertainties in data quality (Roberts and Abernathy, 1997; Cicmanec et al., 1997).
The combination of these uncertainty factors can result in highly conservative interpretations. One can conclude from an RfD that a chemical is quite toxic when the reality is that little is known about the chemical’s toxicity. The engineer must be sure to use appropriate caveats when presenting data, and should understand the reason or reasons for a specific RfD value.
The NOAEL described above is based on a single study, or data point from a more complete data set. However, it is well known that when drawing conclusions, it is preferable to use all of the available data rather than a single point. To this end, the US EPA is moving to a method that entails developing the RfD or RfC from a dose-response relationship derived from all the data. This new approach, the Benchmark Dose concept, has a goal of improving the quality of the RfD and RfC estimates, and reducing the number of uncertainty factors used (US EPA 2000).
Example 2.6-3: Reference Dose.
Reference doses are used to evaluate noncarcinogenic effects resulting from exposure to chemical substances. The reference dose (RfD) is the threshold of exposure below which protective mechanisms are believed to guard an organism from adverse effects resulting from exposure over a substantial period of time. When valid human toxico-logical data are available, it forms the basis for the reference dose. When human exposure data are not available, the animal species believed to be most sensitive to the chemical of concern is used to determine the lowest level at which an adverse effect is detected, often called the LOAEL. Similarly the NOAEL is the greatest test-dose level at which no adverse effect is noted. When animal data are used the reference dose for human populations is adjusted by extrapolation factors to convert the NOAEL or LOAEL into a human subthreshold or reference dose.
![]()
where FA is an adjustment factor to extrapolate from animal to human populations;
FH is an adjustment factor for differences in human susceptibility;
FS is an adjustment factor used when data are obtained from subchronic studies;
FL is an adjustment factor applied when the LOAEL is used instead of the NOAEL; and,
FD is an adjustment factor applied when the data set is dubious or incomplete.
Each adjustment factor should account for the systematic difference between the two measures bridged by the extrapolation and incorporate a margin of safety in accordance with the uncertainty associated with the extrapolation. For example, in a three-month subchronic study in mice, the NOAEL for tris (1,3-dichloro-2-propyl) phosphate was 15.3 mg/kg body weight per day; the LOAEL was 62 mg/kg at which dose abnormal liver effects were noted. (Kamata, 1989) If each of the adjustment factors is equal to 10, the reference dose for this chemical is:
Using the NOAEL:
![]()
Using the LOAEL:
![]()
The lesser of the two values, 0.0062 mg/kg-day, would be selected as the reference dose for humans in this instance.
2.6.4 Structure Activity Relationships (SAR)
Structure Activity Relationships (SAR) are an effective technique for estimating the hazard, as well as other properties (see Chapter 5), of a chemical. The US EPA often use SARs when estimating hazard and other elements of risk. SARs estimate hazards by drawing analogies with chemically similar substances whose hazard has been studied. The similar substance is called a structural analog. This technique requires the expert judgment of toxicologists. Although an engineer should not be expected to perform this kind of analysis (for assessing hazard), an engineer might request that such an analysis be conducted. Therefore, a brief explanation is provided here.
The definition of structural activity, as it applies here, is the relationship between the structural property of a molecule and its biological activity. Health effects which can be evaluated are many, and include absorption into the body; metabolism by the body, oncogenicity (capability to produce tumors); mutagenicity (capability to induce DNA mutations); and acute, chronic, and subchronic toxicity, neurotoxicity, developmental, and reproductive effects (adverse effects on fertility). Some examples of chemical classes of concern that are amenable to SAR review are: acrylamides, vinyl sulfones, dianilines, sulfoniums, epoxides, benzothiazoliums, hindered amines, acrylates, and dichlorobenzene pigments.
The basis for choosing an appropriate structural analog may be structure, substructure, or physical/chemical properties. For example, an unsaturated ketone may be a good analog for an unsaturated ester. In some instances, the toxicologist predicts metabolites (biotransformation products) of the chemical of interest and assesses the hazards of the metabolites.
Some information about environmental fate is required to complete an SAR assessment. Environmental fate is determined by physical-chemical properties of the chemical. Examples are octanol/water partition coefficient and water solubility. Models for estimating these parameters are frequently used by engineers and are described in Chapter 5.
The intrinsic problem with using Structural Activity Relationships to estimate toxicity is the uncertainty associated with extrapolating information from one chemical to another. This uncertainty limits the accuracy of toxicity estimates made using SAR techniques, although they can be helpful when no other data are available. However, direct, accurate data on hazard should be used rather than SAR estimates whenever the data are available.
2.6.5 Readily Available Hazard References
Listed below are references commonly used to inform hazard assessment. The list is intended as a starting point for the engineer charged with hazard assessment and is not comprehensive. A comprehensive list for the entire text is located in Appendix F.
1. MSDS. The Material Safety Data Sheet is a document developed by chemical manufacturers. The MSDS contains safety and hazard information, physical and chemical characteristics, and precautions on safe handling and use. It may also include hazards to animals, especially aquatic species. The manufacturer is required to keep it up to date. Any employer that purchases a chemical is required by law to make the MSDS available to employees. Development of an MSDS is required under OSHA’s Hazard Communication Standard.
2. NIOSH Pocket Guide to Chemical Hazards. NIOSH is the National Institute for Occupational Safety and Health; this is the organization that performs research for OSHA, the Occupational Safety and Health Administration. The Pocket Guide may be found on-line at:
www.cdc.gov/niosh/npg/pgdstart.html
It includes safety information, some chemical properties, and OSHA Permissible Exposure Limit concentrations, or PELs. PELs are human exposure concentration limits that have been set by OSHA for commonly used chemicals. The lower the permissible concentration, the greater the hazard to human health. By law, these concentration values cannot be exceeded in the workplace. Concentration measurements of these chemicals must be taken so that exposure levels are known and any documented overexposures can be addressed.
3. IRIS. IRIS is a database maintained by the United States Environmental Protection Agency. IRIS stands for Integrated Risk Information System. It is available through:
http://www.epa.gov/ngispgm3/iris/index.html
IRIS is a database of human health effects that may result from exposure to various substances found in the environment.
4. The National Library of Medicine has a Hazardous Substances Data Bank. The web address is:
http://chem.sis.nlm.nih.gov/hsdb/
The Hazardous Substances Data Bank (HSDB®) is a toxicology data file that focuses on the toxicology of potentially hazardous chemicals. It is enhanced with information on human exposure, industrial hygiene, emergency handling procedures, environmental fate, regulatory requirements, and related areas.
5. Also available from the National Library of Medicine is Toxnet. The web address is:
Toxnet is a cluster of databases on toxicology, hazardous chemicals, and related areas. Both IRIS and the HSDB are available through Toxnet.
6. Casarett and Doull’s text Toxicology, the Basic Science of Poisons(Casarett and Doull, 1995). This is the classic text in the field for interested readers. It is published by Macmillan and is updated every few years.
7. Patty’s Industrial Hygiene and Toxicology. This set of volumes is a starting point for readers who want more information than exposure limits, but who are not experts in toxicology. It is published by John Wiley & Sons.
8. The American Conference of Governmental Industrial Hygienists (ACGIH). This organization publishes workplace chemical exposure concentration limits which are voluntary, unlike the legally enforceable OSHA PELs. These limits are known at Threshold Limit Values (TLVs). The documentation for the TLVs contains detailed information on the relevant toxicity and exposure concerns related to each chemical with an established TLV.
2.7 Dose-Response
A dose response curve (Figure 2.7-1) is a graph of the quantitative relationship between exposure and toxic effect. This analysis enables risk assessors to estimate a “safe” dose. Actual dose is compared to safe dose to estimate risk. Dose-response answers the question: How large a dose causes what magnitude of effect? Larger doses cause greater and more serious effects. For a given chemical, there is a separate curve for each adverse health effect.
The basic shape of the dose-response curve is determined by the biological mechanism of action. On a subtler level, the curve illustrates the sensitivity of different members of the population. It is a plot of dose in mg chemical per kg of body weight, versus percent of the population affected by that dose. For example, an LD50, or lethal dose 50%, is a statistic frequently tabulated for some chemicals. It is the dose, in mg/kg, at which 50% of the rats or other tested species die. This statistic emerges from a dose-response assessment. Rats, mice and rabbits are frequently tested species. They are like humans in that they are mammals, but they are also small, and breed and mature quickly, which can make the testing process more manageable. Nonetheless, these species may react very differently from humans to exposure to a particular chemical. Significant research efforts have been under way for some time to find reliable substitutes for animal testing of chemical hazards.
The curvature of the dose-response curve illustrates the varying sensitivity of different members of the exposed population. That is, if sensitivity to the chemical were constant, dose-response would be a straight line. The curvature illustrates that some people (or, more likely, rodents) are especially vulnerable, while others are more resistant. Among humans, common examples of sensitive subpopulations are children, the elderly, and the immunosuppressed.
Section 8.2 of Chapter 8 uses Threshold Limit Values (TLVs) and Permissible Exposure Limits (PELs) to generate dose-response curves, and lists TLVs and PELs for several compounds (Table 8.2-4).
Figure 2.7-1 Dose-response curves for two compounds that have different relative Threshold Limit Values.

Example 2.7-1
The toxic response of two chemicals, A and B, as a function of dose is shown in Figure2.7-1. Chemical A has a higher threshold concentration, at which no toxic effects are observed, than chemical B. Once the threshold dose is exceeded, however, chemical A has a greater response to increasing dose than chemical B. If the TLV were based on the dose at which 10% of the population experienced health effects, then chemical B would have a lower TLV than chemical A. In contrast, if the TLV were based on the dose at which 50% of the population experienced a health impact, chemical A would have the lower TLV. So, which chemical is more toxic?
Solution: The answer depends on the precise definition of toxicity and the specifics of the dose-response relationship. This conceptual example is designed to illustrate the dangers of using simple indices as precise, quantitative indicators of environmental impacts. There is value, however, in using these simple indicators in rough, qualitative evaluations of potential environmental impacts.
Developing the data to support a dose-response curve is expensive, time-consuming, and rigorous. It is generally not performed until some screening has suggested that it could be useful. When this testing is performed, it often begins with a rangefinder study. The purpose of this preliminary study is to determine what order of magnitude of dose generates adverse effects. This improves the quality of the dose-response testing.
The outcome of the overall dose-response effort helps tell the assessor what the toxicological endpoint of concern is. Are we concerned about neurotoxicity in young children, whose nervous system is still developing? Are we studying cancer in a particular organ? The dose-response study also provides the NOAEL and the benchmark dose (BMD). These quantities can provide a basis for risk assessment.
Since dose-response testing is so resource-intensive, risk assessors sometimes use structural-activity relationships to estimate a NOAEL or BMD, generally incorporating a coefficient to account for uncertainty. That is, we find a chemical whose NOAEL or BMD is known and has similar (chemical) functional groups to the substance of interest. The structural analog is then used to estimate a NOAEL or BMD for the substance with no dose-response curve available (Auer et al., 1990).
For cancer, dose-response analysis is appropriate for Group A and B substances. Fewer than 10% of the 80,000 or so chemicals in commerce currently have dose-response curves.
There are several important concerns associated with dose-response analysis.
1. Different species may have different responses. We don’t know if humans are more or less sensitive than the most sensitive species of rodent. In the absence of data, risk assessors use a safety factor of 10 to account for this uncertainty. With data, a scaling factor of body weight to the 3/4 power is used to convert from rodents to humans. Similar scaling factors are available for a large number of laboratory animals.
2. Very high doses, to the point of acute poisoning of the test animal, are sometimes necessary to generate a statistically significant effect. The shape of the curve below the lowest dose tested is truly unknown, and often very relevant. Actual exposures are often well below the lowest tested dose. Models have been developed to approximate this portion of the dose-response curve.
3. Since it may take a long time for cancers to be detected in laboratory animals, some otherwise well-designed experiments may have been too brief. Furthermore, the time-to-tumor may be a function of dose, which further complicates the entire analysis.
4. The route of exposure can also effect the outcomes of an analysis. For example, Chromium (VI) is hazardous when inhaled; however, laboratory experiments have not shown evidence that exposure through ingestion causes any adverse effects. Therefore, it is extremely important to be cognizant of the route of exposure when assessing risk.
2.8 Exposure Assessment
The amount of a substance that comes into contact with the external boundaries of a person is called exposure. The quantity that crosses the external boundary is defined as dose and the amount absorbed is the internal dose. The ratio of the internal dose to exposure is called the bioavailability of the substance. While some organizations and older sources of information use slightly different definitions, these have been adopted by the US EPA.
Two common routes of exposure to chemicals are through the skin (dermal) and the lungs (inhalation). Because exposure to chemical in the workplace can occur through inhalation and skin absorption, the engineer must be aware of potential pathways into the body. In Section 6.2.2, the exposure pathway model highlights potential pathways leading from the process to the worker and provides a framework for evaluating pathways for exposure to chemical in the workplace. Most dermal exposures result from hand contact and may occur while performing common worker activities such as sampling, drumming, filter changing, and maintenance. Since skin is a protective barrier for many kinds of chemicals, the bio-availability of these substances is often low, perhaps 5%. Inhalation exposure may be in the form of vapors, aerosols, or solid particulates. Exposure to vapors, for example, may occur due to vapors generated during activities such as drumming and sampling, or from fugitive emissions from small process leaks. Unlike dermal exposure, the bioavailability of these inhaled vapors can be quite high, often close to 100%. Section 8.3 describes US EPA’s AP-42, a document on emissions issues and estimation methods.
A third route of exposure is ingestion, through either eating or drinking. Exposure through ingestion is not usually of interest in scenarios likely to be assessed in occupational settings. However, the engineer should note that ingestion can be a major source of exposure to workers who may eat, drink, or smoke on the job without adequate time or facilities for washing up, or where clean rooms are not available in situations where surfaces are contaminated with chemicals and eating, drinking, or smoking is allowed. A fourth route of exposure is percutaneous exposure, or injection through the skin. However, this type of exposure is rarely seen in the workplace. A notable example is the potential for needlesticks in healthcare settings.
The preferred approach for assessing exposure is to use personal monitoring data for the chemical of interest at the site. If not available, monitoring data for the chemical at sites with similar operations is the next choice. If there are no data available on the chemical of interest, exposure can be assessed using data for a surrogate chemical. A surrogate chemical is one whose physical and chemical properties are as similar as possible, and is used in similar operations. Finally, in the absence of any relevant data, exposure can be assessed using models. For example, a mass balance model can be used to estimate inhalation exposure to vapors (see Chapter 6).
A different approach to addressing exposure is to measure some appropriate biomarker. This applies to people who have already been exposed. A biomarker is a measurable substance whose presence in the body is a direct result of exposure to a specific chemical. Exposure may be estimated from models and based upon the biomarker measurements. Unfortunately, there are few substances that pose an exposure concern for which a biomarker has already been identified and measured. Some substances have metabolites which can be detected in blood or urine; these are common testing approaches for biomarkers.
As the engineer proceeds down this hierarchy of methods for assessing exposure, the degree of uncertainty increases. Information about this uncertainty must be communicated before risk management decisions are made. On the other hand, a high degree of uncertainty may be acceptable for some decisions. In addition to workplace exposure, exposures in the ambient environment resulting from plant emissions may also be part of the exposure assessment (Ott and Roberts, 1998). Using emissions as a starting point, exposure can be estimated from a variety of models which consider environmental fate and transport.
Techniques for modeling workplace exposure are described in more detail in Chapter 6. A discussion of exposure assessment for the ambient environment is also presented.
Example 2.8-1
A facility produces a liquid waste which contains several hazardous chemicals. There are several improper methods of disposal which, if used, would potentially expose the general population in the area surrounding the plant to these chemicals.
1. Set open-top drums containing the hazardous waste behind the plant and allow the waste to evaporate.
2. Pour the liquid waste into a ditch leading to a creek behind the plant.
3. Bury drums containing the liquid waste behind the plant.
For each of these improper disposal options, identify the pathways by which the population in the area surrounding the plant might be exposed to the hazardous chemicals.
Solution:
1. Allowing volatile wastes to evaporate will expose persons near or downwind from the open drums. The primary route of exposure will be by inhalation of air containing the volatile chemicals. If the chemical substances are corrosive, they may also irritate the skin and eyes.
2. Liquids discharged into drainage ways, either intentionally or by accident spillage, will flow quickly into nearby rivers or streams. The flow may be enhanced by precipitation runoff which washes the liquid discharge into the waterway. Persons whose drinking water comes from downstream surface waters could be exposed to the chemical substance if it is not removed during treatment by the local water supply authority. In arid areas, the chemical may seep into the ground and be carried downward by subsequent precipitation. Persons in these areas using ground water as a source of drinking water would be exposed to the chemical by ingestion of the chemical.
3. Improperly buried drums may leak their contents into surrounding soils. The leakage will flow downward by gravity until it reaches the water table. If soluble, the chemical will dissolve in the ground water and may be ingested by persons using local ground water as a source of water supply. Also, liquid leaking from buried drums can be carried by shallow ground water to nearby residences; the chemical could vaporize and accumulate in basements when air flow is stagnant. Persons in these residences would be exposed to the chemical vapors when inhaling the basement air.
2.9 Risk Characterization
Risk characterization is the amalgamation of available hazard and exposure information—i.e., risk, as well as all major issues developed during the assessments, including the uncertainty of all aspects of the analysis. It embodies the effects of potential concern, the route and the magnitude of the expected exposure and the numbers of the populations estimated to be exposed. As stated above, the primary human health concern is carcinogenicity. Generally, the potential for carcinogenicity is assessed using pharmaco-kinetics, chronic toxicity data from analogs, and mechanistic information (when these data are available).
2.9.1 Risk Characterization of Cancer Endpoints
The classical treatment of cancer risk defines risk as the probability of developing cancer from a particular chemical if a sub-population is exposed to that chemical over a lifetime. A person can contract cancer from many sources besides exposure to a particular chemical. This concept is called the background cancer level, and must be separated from the probability of developing cancer from a particular chemical exposure. Thus, risk is defined in this particular context as the cancer probability in excess of the background cancer level. Our basic equation of risk is:
Risk = f(Hazard, Exposure)
The basis for cancer risk assessment is the dose-response curve (risk of incidence of cancer vs. dose of an agent). Unfortunately, for cancer, bioassays are usu-ally run at only two doses to describe the carcinogenic response of the test species. The relationship is typically non-linear. Since it is assumed that carcinogens do not have thresholds, the “cancer” model generates a non-linear curve. There is never enough data to provide a complete dose-response curve. To deal with this reality, the risk assessor is left with the option of applying one of a number of mathematical models to the limited data set so as to describe the relationship. For a new chemical, with limited dose-response data, one methodology is to use the slope of the dose-response curve or (percent response per mg pollutant per kg of body weight per day) as a measure of hazard. Exposure is the quantity that arrives at the surface of a person’s body, in mg of pollutant per kg body weight per day. This simple application of the basic risk equation often provides the risk manager with sufficient information to make risk management decisions.
2.9.2 Risk Characterization of Non-Cancer Endpoints
Non-cancer risk also has a dose-response curve. The model relationship in this case is linear. Therefore, simplifying assumptions allow us to characterize the risk of adverse health effects as a simple ratio or Hazard Quotient. The Hazard Quotient is the ratio of the estimated chronic dose or exposure level to the RfD or RfC.
Hazard Quotient values below unity imply that adverse effects are very unlikely. The more the Hazard Quotient exceeds unity, the greater the level of concern. However, the Hazard Quotient is not a probabilistic statement of risk.
2.9.3 Adding Risks
The discussion above presumes risk occurs from one chemical at one source. In fact, there are multiple chemicals, multiple pathways, and multiple exposure routes. It is necessary either to estimate what the most important risks are, or to calculate all sources and pathways. Aggregate and Cumulative Risk are fairly recent terms in the lexicon. Aggregate means adding risks together from multiple exposure routes: dermal, inhalation and ingestion.
The use of the term endpoint becomes important in the emerging area of Cumulative Risk assessment. Sometimes, the risks from one chemical may be too low to generate concern. However, several different chemicals may have the same toxicological endpoint. That is, they affect an organ or system adversely in the same way. Exposures from these chemicals need to be combined to determine whether the adverse effect may occur as a result of a combination of chemical exposures.
Summary
Risk is a quantitative assessment of the probability of an adverse outcome. Risk may result from voluntary exposure to hazardous conditions in one’s occupation, involuntary exposure to radiation, chemicals, pathogens, or the reckless behavior of others, or natural disasters.
There are four components of risk assessment: hazardous assessment; doseresponse; exposure assessment; and risk characterization. The engineer should work with chemists, toxicologists, and others when a risk assessment is needed. Although there may be uncertainties in performing risk assessments, it can assist in choosing between process options.
The risk concepts presented will be expanded on in later chapters throughout the text, and their direct application in assessing risk in the manufacturing and use of chemical processes and products will be shown.
References
Auer, C.M., Nabholz, J.V., and Baetcke, K.P., Mode of Action and the Assessment of Chemical Hazards in the Presence of Limited Data: Use of Structure-Activity Relationships (SAR) under TSCA, Section 5, Environmental Health Perspectives. Vol. 87, pp. 183–197, 1990.
Casarett, L.J. and Doull, J., Toxicology, the Basic Science of Poisons Fifth Edition, Macmillan Publishing Co., Inc. New York, 1995.
Cicmanec, J.L., Dourson, M.L., and Hertzberg, R.C., Noncancer Risk Assessment: Present and Emerging Issues in Toxicology and Risk Assessment, Chapter 17, Fan, A.M., Academic Press, 1997.
Cooke, R. and Jager, E., A probabilistic model for failure frequency of underground gas pipelines, Risk Analysis, 18(4), 511–523, 1998.
Fan, A.M. and Chang, L.W., Toxicology and Risk Assessment: Principles, Methods, and Applications, Marcel Dekker, Inc. New York, NY, 1996, p. 247.
Federal Focus, Inc. Towards Common Measures: Recommendations for a Presidential Executive Order on Environmental Risk Assessment and Risk Management Policy, Federal Focus Inc. and The Institute for Regulatory Policy, Washington, D.C., 1991.
Fort, D.D., “Environmental Laws and Risk Assessment,” in Toxicology and Risk Assessment: Principles, Methods, and Applications, Fan, A.M. and Chang, L.W. ed., Marcel Dekker, Inc. New York, NY, p. 653–677, 1996.
Hammond, E.C., and Selikoff, I.J.: Relation of cigarette smoking to risk of death of asbestos-associated disease among insulation workers in the United States, in Biological Effects of Asbestos, P. Bogovski, J.C. Gilson, V. Timbrell, J.C. Wagner, and W. Davis, editors, Int. Agency Res. Cancer, Scientific Publication No. 8, Lyon, France, p. 312–317, 1973.
Kamata E. et al., Acute and subacute toxicity studies of tris(1,3-dichloro-2-propyl) phosphate on mice. Bull Natl Inst Hyg Sci, 107:36–43 (1989).
Lednar, W.M., Tyroler, H.A., McMichael, A.J., and Shy, C.M., The occupational determinants of chronic disabling pulmonary disease in rubber workers, J. Occup. Med. 19(4), p. 263–268, 1977.
Monsanto Company, St. Louis, MO, 1980.
NRC, National Research Council, “Risk Assessment in the Federal Government: Managing the Process,” Committee on Institutional Means for Assessment of Risks to Public Health, National Academy Press, Washington, D.C., 1983.
Ott, W.R. and Roberts, J.W. “Everyday Exposure to Toxic Pollutants,”Scientific American, February 1998.
Patton, D.E., “The ABCs of Risk Assessment,”EPA Journal, Volume 19, Number 1. January 1993. Document Control Number EPA 175-N-93-014
Presidential/Congressional Commission on Risk Assessment and Risk Management; Final Report, Vol 1, 1997; p.1.
Roberts, W.C. and Abernathy, C.O., “Risk Assessment: Principles and Methodologies,” in Toxicology and Risk Assessment: Principles, Methods, and Applications, Fan, A.M. and Chang, L.W. ed., Marcel Dekker, Inc. New York, NY, p. 245–270, 1996.
Roberts, W.C. and Abernathy, C.O., “Risk Assessment: Principles and Methodologies,” in Toxicology and Risk Assessment, Chapter 15, Fan, A.M. ed., Academic Press, 1997.
Selikoff, I.J., Hammond, E.C., and Churg, J., Asbestos Exposure, Smoking, and Neoplasia, J. Am. Med. Assoc. 204(2): p. 106–112, 1968.
US EPA, United States Environmental Protection Agency, Guidelines for Exposure Assessment, FR Vol. 57, No. 104, May 29, 1992.
US EPA, United States Environmental Protection Agency, Terminology Reference System (TRS 2.0), September 11, 2000, http://oaspub.epa.gov/trs/prc_qry.keyword.htm.
US EPA, United States Environmental Protection Agency, National Center for Environmental Assessment, Benchmark Dose Software,http://www.epa.gov/ncea/bmds.htm. Velazquez et al. “Cancer Risk Assessment: Historical Perspectives, Current Issues, and Future Directions,” Chapter 14 of Toxicology and Risk Assessment, Fan, A.M., Academic Press, 1997
Problems
1. Each year, approximately 45,000 persons lose their lives in automobile accidents in the United States (population 281 million according to the 2000 census). How many fatalities would be expected over a three-day weekend in the Minneapolis-St. Paul, Minnesota metropolitan area (population 2 million)?
2. A collection sump has two control systems to prevent overflowing of the sump (see figure below). The first is a level sensor connected to an alarm which alerts the operator to the high liquid level. A second level sensor is connected to a solenoid valve which opens a drain to lower the liquid level in the sump. Draw the fault tree diagram for this system.

3. Toxicological testing is performed on non-human species: mice, rats, rabbits, dogs, and others. If a no observed adverse effect level (NOAEL) is determined in a non-human species, what safety factor should be applied to this NOAEL to set an exposure level that is acceptable for humans?
4. Repeat the reference dose calculation of Example 2.6-3 for tris(2-chloroethyl) phosphate for which the NOAEL was determined to be 22 mg/kg-day and the LOAEL was found to be 44 mg/kg-day for increased weights of liver and kidneys in rats.
5. A colleague has requested your advice on selection of a safe solvent for a photoresist. A photoresist consists of an acrylate monomer, polymeric binder, and photoinitiator applied to the surface of a copper-clad laminate or silicon wafer. After the solvent evaporates, the photoresist is exposed to ultraviolet light through a mask containing the pattern to be etched on the circuit board or silicon wafer. When exposed, the resist polymerizes and becomes insoluble to the developer. The circuit board or silicon wafer is subsequently washed with the developer solution to remove unpolymerized photoresist, exposing the pattern to be etched with acid into the copper metal or the silicon wafer. Your colleague has identified the following solvents as suitable for formulation of the photoresist.

(a) Using the OSHA Permissible Exposure Limit as a surrogate for relative hazard, a higher OSHA PEL connoting a lower hazard, rank these solvents from highest hazard to lowest.
(b) Using the vapor pressure as a surrogate for the magnitude of worker exposure to the solvent vapors, rank these solvents from highest exposure potential to lowest.
(c) Considering both hazard and exposure potential, which of these solvents would you recommend to your colleague for the photoresist solution?
(d) What alternatives can be used to reduce the risk associated with solvents even further?
6. Carcinogenic Risk Assessment Near a Petroleum Refinery: A petroleum refinery on the east coast has initiated a voluntary program to evaluate sources of environmental emissions. As one important step in this evaluation, the company wishes to perform a quantitative risk assessment on the atmospheric releases of volatile organic compounds, some of which are toxic, from the facility. As a test case, perform a risk assessment on benzene released to the air from the facility and its impact on human health (carcinogenic impact, inhalation only) in a hypothetical residential area located 1 km from the center of the facility (assume that the center is the emission source). The dose-response carcinogenic slope factor (SF) for benzene inhalation is 2.9 10-2 [mg benzene/(kg body weight • day)] 1). The maximum average annual concentration of benzene in the outside air (CA) within a residential area downwind from the facility is 82 µg/m3.
Using the following exposure properties,

where RR is the efficiency of the lungs to retain benzene and ABS is the efficiency of the lung tissue to absorb the retained chemical. These values were set to default values (1.0) for this problem and may actually be much lower.
(a) Calculate the inhalation dose of benzene to a typical resident using the following equation

(b) Calculate the inhalation carcinogenic risk for this scenario using the following equation.
(c) Is the risk greater than the recommended range of < 10-4 to 10-6 for carcinogenic risk?
(d) Discuss possible reasons that this methodology might over-predict the actual risk based on the discussions in this chapter and on the information given in the problem statement.