
Chapter 9
Unit Operations and Pollution Prevention
9.1 Introduction
In developing a flowsheet for the production of a chemical, it is desirable to consider the environmental ramifications of each unit operation in the process rather than postponing this consideration until the flowsheet is finished. This “front end” environmental assessment is more likely to result in a chemical process that has less potential to cause environmental harm. In many instances, this environmentally benign design will also be more profitable, because the improved design will require lower waste treatment and environmental compliance costs and will convert a higher percentage of raw materials into salable product.
In considering pollution prevention for unit operations in the design of chemical processes, the following considerations are important.
1. Material Selection: Many of the environmental concerns can be addressed by reviewing material properties and making the correct choice of unit operation and operating conditions. The materials used in each unit operation should be carefully considered so as to minimize the human health impact and environmental damage of any releases that might occur.
2. Waste Generation Mechanisms: Often, a careful evaluation of the mechanisms of in-process waste generation can direct the process designer toward environmentally sound material choices and other pollution prevention options.
3. Operating Conditions: The operating conditions of each unit should be optimized in order to achieve maximum reactor conversion and separation efficiencies.
4. Material Storage and Transfer: The best material storage and transfer technologies should be considered in order to minimize releases of materials to the environment.
5. Energy Consumption: Energy consumption in each unit should be carefully reviewed so as to reasonably minimize its use and the associated release of utility-related emissions.
6. Process Safety: The safety ramifications of pollution prevention measures need to be reviewed in order to maintain safe working conditions.
In the following sections, we apply this framework for preventing pollution in unit operations by considering choices in materials, technology selection, energy consumption, and safety ramifications. In Section 9.2, material choices that are generic to most chemical processes, like process water and fuel type, are analyzed with respect to in-process waste generation and emission release. Other process materials that are more specific to various unit operations are discussed in subsequent sections of this chapter. Chemical reactors are the topic in Section 9.3. The environmental issues related to the use of reactants, diluents, solvents, and catalysts are discussed first. Then the effects of reaction type and order on product yield and selectivity are covered. The effects of reaction conditions (temperature and mixing intensity) on selectivity and yield are illustrated. Finally, the benefits of additional reactor modifications for pollution prevention are tabulated. In Section 9.4, the most important topics include the choice of material (mass separating agent) to be used in separations, design heuristics, and examples of the use of separation technologies for recovery of valuable components from waste streams, leading eventually to their reuse in the process. Separative reactors are the topic in Section 9.5. These hybrid unit operations have special characteristics to help achieve higher conversions and yields in chemical reactors compared to conventional reactor configurations. Section 9.6 discusses methods for reducing emissions from storage tanks and fugitive sources. The safety aspects of pollution prevention and unit operations are the topic of Section 9.7. It is shown that many pollution prevention efforts tend to make chemical processes more complex, necessitating a higher level of safety awareness.
In making pollution prevention decisions that include choices of materials, unit operations technologies, operating conditions, and energy consumption, it is very important to consider health and environmental risk factors. It is also important to incorporate cost factors and to be aware of safety ramifications. In Section 9.8, we review a method for minimizing the potential environmental impact of unit operations by considering the optimum reactor operating conditions as an example application. Although no generally accepted method exists for these assessments, the method outlined in Chapter 8 and applied in Section 9.8 is useful for incorporating multiple risk factors into decisions regarding unit operations.
Finally, it is also important to introduce the concept of “risk shifting.” Pollution prevention decisions that are targeted to reduce one kind of risk may increase the level of risk in other areas. For example, a common method of conserving water resources at chemical manufacturing facilities is to employ cooling towers. Process water used for cooling purposes can be recycled and reused many times. However, there is an increased risk for workers who may be exposed to the biocides used to control microbial growth in the cooling water circuit. Also, in some cooling water processes, hazardous waste is created by the accumulation of solids— for example, from the use of hexavalent chromium (a cancer causing agent) as a corrosion inhibitor.
Another example of shifting risk from the environment and the general population to workers involves fugitive sources (valves, pumps, pipe connectors, etc.). One strategy for decreasing fugitive emissions is to reduce the number of these units by eliminating backup units and redundancy. This strategy will decrease routine air releases but will increase the probability of a catastrophic release or other safety incidents. Simply put, the objective of pollution prevention is to reduce the overall level of risk in all areas and not to shift risk from one type to another.
9.2 Pollution Prevention in Material Selection for Unit Operations
One very important element of designing and modifying process units for pollution prevention is the choice of materials that are used in chemical processes. These materials are used as feedstocks, solvents, reactants, mass separating agents, diluents, and fuels. In considering their suitability as process components, it is not sufficient to consider only material properties that are directly related to processing; it is increasingly important to consider the environmental and safety properties as well. Use of materials that are known to be persistent, bioaccumulative, or toxic should be avoided as they are under increasing regulatory scrutiny and many manufacturers are moving away from their use. Questions regarding material selection include:
a) What are the environmental, toxicological, and safety properties of the material?
b) How do these properties compare to alternative choices?
c) To what extent does the material contribute to waste generation or emission release in the process?
d) Are there alternative choices that generate less waste or emit less while maintaining or enhancing the overall yield of the desired product?
If processing materials can be found which generate less waste and if the hazardous characteristics of those wastes are less problematic, then significant progress may be made in preventing pollution from the chemical process.
Materials are involved in a wide range of processing functions in chemical manufacturing, and depending on the specific application, their environmental impacts vary greatly. For example, reactants for producing a particular chemical can vary significantly with respect to toxicity and inherent environmental impact potential (global warming, ozone depletion, etc.), and they can exhibit various degrees of selectivity and yield toward the desired product. In addition, the properties of reaction byproducts can vary widely, similarly to reactants. Some catalysts are composed of hazardous materials or they may react to form hazardous substances. For example, catalysts used for hydrogenation of carbon monoxide can form volatile metal carbonyl compounds, such as nickel carbonyl, that are highly toxic (Gates, 1993). Many catalysts contain heavy metals, and environmentally safe disposal has become an increasing concern and expense. After the deposition of inhibitory substances, the regeneration of certain heterogeneous catalysts releases significant amounts of SOx, NOx, and particulate matter. For example, the regenerator for a fluid catalytic cracking unit (FCCU) is a major source of air pollutants at refineries (Upson and Lomas, 1993). Note that the removal of the FCCU would result in very low yields and consequently unacceptable waste generation at facility level.
The choice of a mass separating agent for solids leaching or liquid extraction applications can affect the environmental impacts of those unit operations. Agents that are matched well to the desired separation will consume less energy and release less energy-related pollutants than those that are not well suited for the application. Typically, agents that have lower toxicity will require less stringent clean up levels for any waste streams that are generated in the process.
The choice of fuel for combustion in industrial boilers will determine the degree of air pollution abatement needed to meet environmental regulations for those waste streams. As an illustration, using fuel types having lower sulfur, nitrogen, and trace metals levels will yield a flue gas with lower concentrations of acid rain precursors (SOx, and NOx) and particulate matter, as shown by the following example.
Example 9.2-1
Compare the emission of sulfur dioxide (SO2) resulting from the combustion of three fuel types that will satisfy an energy demand of 106 BTU. The fuel types are No. 6 fuel oil (F.O.), No. 2 fuel oil, and natural gas. The elemental compositions by weight for each fuel are listed below along with the density and lower heating value.
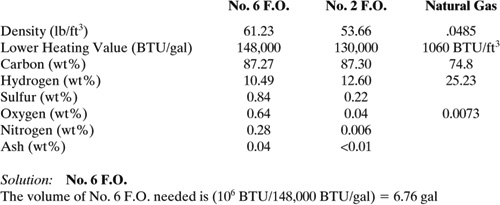
The mass of No. 6 F.O. needed is (6.76 gal)(1 ft3/7.48 gal)(61.23 lb/ft3) = 55.18 lb
Therefore, the mass of SO2 generated is (55.31 lb)(.0084 lb S/lb)(64.06 lb SO2/32.06 lb S) = .928 lb SO2
No. 2 F.O.; similarly as for No. 6 F.O.
The mass of SO2 is .243 lb SO2
Natural Gas
The mass of SO2 is 0.0 lb SO2
The percent reduction in SO2 generated for No. 2 F.O. compared to No. 6 F.O. is (0.928 lb SO2 – 0.243 lb SO2)/0.928 lb SO2 × 100 = 73.81%.
Discussion: Focussing on the sulfur content of each fuel is a useful approach for reducing acid rain. However, there are other risk factors that need to be considered. Other considerations could include a) toxicological properties of each fuel, b) difference in emission rates to air from storage and transfer operations, c) smog formation potential of fuel components, and d) the cost of the fuel.
(Adapted from a problem by John Walkinshaw in Motivating Pollution Prevention Concepts: Homework Problems for Engineering Curricula, editors M. Becker, I. Farag, and N. Hayden, 1996.)
Less toxic materials, such as water and air, can still have important environmental implications due to the waste streams that are generated in their use. Air is often used in chemical reactions either as a diluent or as a source of oxygen. For certain high temperature reactions, the nitrogen and oxygen molecules in the air react, forming oxides of nitrogen. Upon release, NOx will participate in photochemical smog reactions in the lower atmosphere. Therefore, it is important to consider alternative sources of oxidants, such as enriched air or pure oxygen, and diluents, such as carbon dioxide or other inert reaction byproducts. Water is used for many purposes in chemical processes; as boiler feed, a cooling medium, reactant, or a mass separating agent. The following example illustrates that the quality of the feed water can have a profound influence on the generation of hazardous waste in a refinery.
Example 9.2-2
Figure 9.2-1 shows the many uses of process water in a refinery. Water is brought into contact with crude oil in order to remove salts and other solid contaminants that could disrupt the operation of downstream equipment. The spent water from this operation is sent to the wastewater treatment facility to recover residual oil and to remove toxic constituents. Water that is used as feed to the boilers is softened in an ion exchanger. Steam generated in the boilers is used for process heating and a fraction is returned to the boiler as condensate.
Problem
Solids accumulate in the boiler and excessive levels of suspended solids lead to fouling of heat transfer surfaces in the process, a decrease in heat transfer efficiency, and requires periodic shut-down and cleaning of these surfaces to restore normal operation.
Figure 9.2-1 Conceptual diagram of process water at a refinery. Source: Allen and Rosselot, Pollution Prevention for Chemical Processes © 1997. This material is used by permission of John Wiley & Sons, Inc.
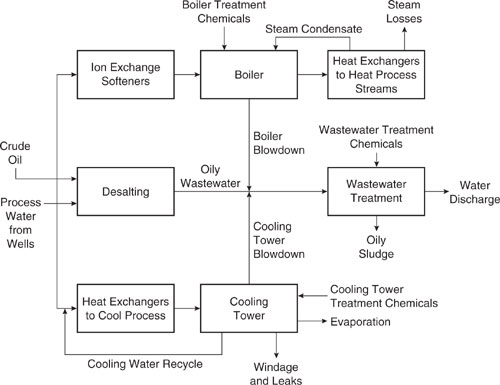
To control solids accumulation, the contents of the boiler are sent to wastewater treatment when the dissolved solids content is above a cut-off level, in a step termed “blowdown.” Similarly, in the cooling system of the refinery, dissolved solids accumulate because the mechanism of cooling in the cooling tower is evaporation, which effectively retains solids in the process. When the high calcium solids from the cooling tower blowdown meet the alkaline boiler blowdown, precipitation occurs. This precipitate can clog wastewater treatment equipment and can form oily sludges upon being blended with the wastewater from the desalter unit. It has been shown that every pound of solids precipitate in oily wastewater creates about 10 pounds of oily sludge. The oily sludge is a RCRA hazardous waste and is costly because of expensive disposal fees and the oil lost from the process that could have been made into products.
Pollution Prevention Solution: At a southwest United States petroleum refinery, the solution to this waste disposal problem involved the pretreatment of all process water using reverse osmosis to separate dissolved solids from the feed water, thereby eliminating the source of solids for the oily sludge (Rosselot and Allen, 1996). This solution proved to be cost effective because the savings in disposal costs alone was enough to pay for the pretreatment equipment and its operation. Additional savings were realized because fewer boiler and cooling tower treatment chemicals were needed (90% reduction in use). Also, maintenance costs were lower since scale build-up on the cooling waste heat exchanger surfaces was reduced.
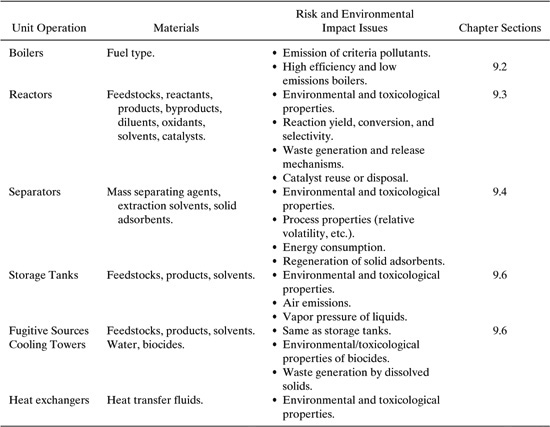
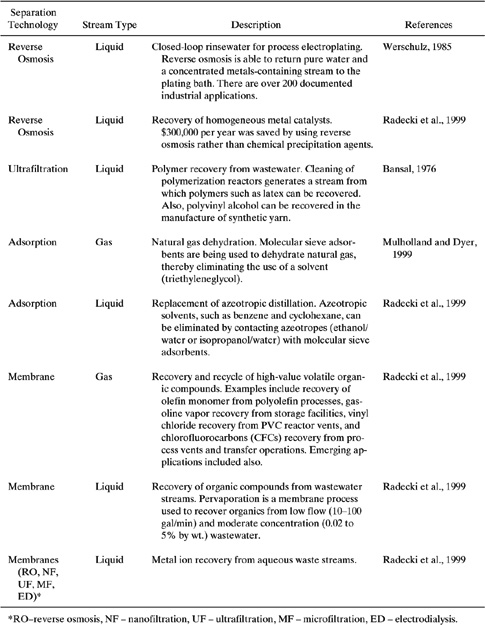
Additional examples of material use and pollution prevention in unit operations will be provided in the sections of this chapter on chemical reactors and separation equipment. A summary table relating unit operations, materials selection, and risk factors is presented in Table 9.2-1.
9.3 Pollution Prevention For Chemical Reactors
From an environmental perspective, reactors are the most important unit operation in a chemical process. The degree of conversion of feed to desired products influences all subsequent separation processes, recycle structure for reactors, waste treatment options, energy consumption, and ultimately pollutant releases to the environment. Once a chemical reaction pathway has been chosen, the inherent product and byproduct (waste) distributions for the process are to a large extent established. However, the synthesis must be carried out on an industrial scale in a particular reactor configuration and under specified conditions of temperature, pressure, reaction media (or solvent), mixing, and other aspects of the reactor operation.
In designing chemical reactors for pollution prevention, there are many important considerations. The raw materials, products, and byproducts should have a relatively low environmental and health impact potential. This means that the environmental and toxicological properties of the chemicals involved should indicate that they are relatively benign. In addition, the conversion of reactants to desired products should be high and their conversion toward byproducts should be low. In other words, the reaction yield and selectivity for the desired product should be as high as possible. Finally, energy consumption for the reaction should be low. Another consideration that is beyond the scope of this chapter is that the life cycle impacts of reactants, products, and byproducts should be relatively low (see Chapters 13 and 14). For example, cumulative emissions and impacts of raw materials should be relatively low, environmental impacts during subsequent use by consumers should be small, and if possible the reaction products should be recyclable. Engineers must balance all of these considerations. For the discussion in this chapter, these reactor considerations will be classified as
1) material use and selection,
2) reaction type and reactor choice, and
3) reactor operation.
Table 9.2-1 Summary of Material Selection Issues for Unit Operations in Chemical Processes.
The following discussion proceeds from the most general to the more specific topics on preventing pollution for chemical reactors.
9.3.1 Material Use and Selection for Reactors
Issues involving the use of materials in a chemical reactor include the choice of feed entering the reactor, the catalyst if one is needed, and solvents or diluents. Many of these material choices were already made in previous design steps in the generation of a flowsheet, particularly using the assessments methods described in Chapters 5–8. However, it is important to mention material selection here in light of their influence on the environmental impacts of reactors in chemical processes.
Raw Materials and Feedstocks
Raw materials used in chemical reactions can be highly toxic or can cause undesirable byproducts to form. Although some of these raw materials may be converted to relatively benign chemicals through chemical reactions in the process, their presence may be a concern because of the potential for uncontrolled release and exposure to humans in the workplace and also in the environment. An important strategy for environmental risk reduction for chemical processes is to eliminate as many of these toxic raw materials, intermediates, and products as possible.
The elimination of a raw material or the use of a more benign substitution may necessitate the adoption of new process chemistry. For example, phosgene is used in large volumes all over the world in the manufacture of polycarbonates and urethanes. Phosgene – COCl2 is highly toxic and may pose risks for workers at manufacturing facilities and to the surrounding population if large releases occur. In the phosgene process for producing polycarbonates, polycarbonate is produced from bisphenol-A monomer and phosgene in the presence of two solvents, methylene chloride and water. A new process for polycarbonate synthesis has been demonstrated using solid-state polymerization in the absence of both phosgene and methylene chloride (also toxic) (Komiya et al., 1996), by including diphenyl carbonate (DPC) and phenol instead. Similarly, alternative phosgene-free routes to urethanes have recently been developed (see citations in the Green Chemistry Expert System (GCES) available at http://www.epa.gov/greenchemistry/). The “Tier 1” environmental performance tools outlined in Chapter 8 (Section 8.2) are very useful for evaluating these and other alternative reactions chemistries.
In the production of fuels for transportation, petroleum refineries are required to remove sulfur from their products. If not removed, SO2 is released to the atmosphere upon combustion of the fuels in automobiles, trucks, or stationary combustion sources. Exposure to SO2-contaminated air causes lung irritation and other more serious health effects, and SO2 emissions contribute to acidification of surface water and ecosystem damage. Choosing a crude oil raw material with lower sulfur content (sweet crude) reduces the amount of sulfur that needs to be removed and reduces operating costs, but is considerably more expensive to purchase. Another option to consider would be to use, and therefore incur the associated costs with, a hydrodesulfurization or a hydrotreating unit to remove the sulfur. The sulfur can then become a salable product.
In partial oxidation reactions of hydrocarbons to form alcohols or other oxygenated organics, air has traditionally been the source of oxygen in the reaction, and the nitrogen in the air has acted as a heat sink agent (diluent) to help control temperature rise for the exothermic reaction. Some CO2 and H2O are produced, and due to the presence of N2, some NOx is formed. NOx is a precursor in the formation of photochemical smog in urban atmospheres and its emission from industrial facilities is regulated under the Clean Air Act. One method to reduce or eliminate the formation of NOx in partial oxidation reactions is to use pure oxygen or enriched air as the oxidizing agent, thus preventing NOx formation. Carbon dioxide that is recovered and recycled from the reactor effluent or water vapor could be used as the heat sink instead of nitrogen. Another method is to install NOx control equipment on the original process. An important issue in this case is whether the costs associated with purchasing and operating the CO2 recovery equipment are lower than operating NOx control equipment. Another consideration is whether the additional pollutant releases associated with NOx prevention equipment are lower than the releases in the original process.
Solvents
Another important class of raw materials used in chemical reactors is solvents. This is especially true in “solution” and “emulsion” polymerization reactions in which the reaction of monomers to create high molecular weight polymers occurs either within the solvent phase or within dispersed droplets of monomer in the solvent phase. In some polymerizations, addition of solvents can enhance precipitation of polymer in solid form, co-solubilize monomer and initiator, and act as a diluting medium to modulate the rate of reaction and rate of heat removel (Elias, 1984). The highest production polymers in the United States are low-density polyethylene (LDPE), high-density polyethylene (HDPE), polyvinyl chloride (PVC), polypropylene, and polystyrene, with approximately 20%, 15%, 15%, 13% and 8% of annual mass production, respectively (Aggarwal and Caneba, 1993). Solvents used in the production of some of these high volume polymers include xylene, methanol, lubricating oil, hexane, heptane, and water. Solvents are a concern due to their high volatility and potential to cause low-level ozone during smog formation reactions in the atmosphere. They may also be a health concern for workers and the general population in the vicinity of the facility. Candidate substitute solvents having similar solubility parameters can be found in standard references and handbooks (Hansen, 2000; Sullivan, 1996; Barton, 1983; Flick, 1985). In addition, there are several on-line resources for evaluating substitute solvents (see Appendix F). The solubility, toxicological, cost, and environmental properties of the candidate solvents can be compared with each other and with the original solvent, using the methods in Chapter 8.
Supercritical carbon dioxide is being studied as a substitute solvent in many reaction systems (Morgenstern et al., 1996). Applications include both homogeneous and dispersed phase polymerization reactions (DeSimone et al., 1992, 1994) in which the supercritical CO2 replaces volatile organic compounds and chlorofluorocarbons as traditional solvents in the reaction mixture.
Catalysts
A catalyst is a substance that is added to a chemical reaction mixture in order to accelerate the rate of reaction. Catalysts are either homogeneous, being dissolved in the reaction mixture, or heterogeneous, typically existing as a solid within a reacting fluid mixture. The choice of catalyst has a large impact on the efficiency of the chemical reactor and ultimately upon the environmental impacts of the entire chemical process. Advances in catalysts can improve the environmental performance of a chemical reactor in several ways. Catalysts can allow the use of more environmentally benign chemicals as raw materials, can increase selectivity toward the desired product and away from unwanted byproducts (wastes), can convert waste chemicals to raw materials (Allen, 1992), and can create more environmentally acceptable products directly from the reactions (Absi-Halabi, et al., 1997).
The production of reformulated gasoline (RFG) and diesel fuels from crude oil is a clear example of how improved catalysts can create chemicals that are better for the environment. Because of recent trends in the petroleum refining industry, improved catalysts are being used in several reaction processes within modern refineries. These trends include
a) increased processing of crude oils with lower quality (higher percentages of sulfur, nitrogen, metals, and carbon residues),
b) more demand for lighter fuels and less for heavy oils, and
c) environmental regulations that limit the percentages of sulfur, heavy metals, aromatics, and volatile organic compounds in transportation fuels.
In particular, the inclusion of RFG in the Clean Air Act (CAA) has prompted many changes in catalyst formulation and reactor configurations. Table 9.3-1 is a summary of conventional and improved catalytic reaction processes for RFG and diesel production. As seen in the table, the major emphasis is on catalyst improvements for sulfur and nitrogen removal from heavier crude fractions, reduced aromatics content, and increased production of branched C5-C7 alkanes for octane enhancement.
In this section, we presented examples of how material selection in chemical reactors can impact the environment and reviewed cases where waste generation or toxicity were reduced. In the next part of Section 9.3, we investigate the effects of reaction type and reactor choice on waste generation in chemical reactors.
9.3.2 Reaction Type and Reactor Choice
The details of any chemical reaction mechanism, including the reaction order, whether it has series or parallel reaction pathways, and whether the reaction is reversible or irreversible, influences pollution prevention opportunities and strategies for chemical reactors. These details will determine the optimum reactor temperature, residence time, and mixing. In addition, reactor operation influences the degree of reactant conversion, selectivity, and yield for the desired product, byproduct formation, and waste generation. As a general rule, in designing chemical reactors for pollution prevention, one would like a reaction with a very high conversion of the reactants, high selectivity toward the desired product, and low selectivity toward any byproducts. A typical reactor efficiency measure pertaining to pareactant conversion is the reaction yield, defined as the ratio of the exiting concentration of product to inlet reactant ([P]/[R]o). Reaction selectivity is defined as the ratio of exiting product concentration to the undesired byproduct concentration (Fogler, 1992). We define a modified selectivity as the ratio of exiting product concentration to the sum of product and byproduct (waste) concentrations ([P]/([P] + [W])= [P]/[Reactant consumed]). This allows us to display both yield and selectivity on the same scale, from 0 to 1. Yields and selectivity values that are very close to unity indicate an efficient reaction, with little waste generation or reactant to separate in downstream unit operations.
Table 9.3-1 Summary of Conventional and Improved Catalysts for Reformulated Gasoline and Diesel Production (Adapted from Absi-Halabi, et al., 1997).

Parallel reaction pathways are very common in the chemical industry. An example of an industrial parallel reaction is the partial oxidation of ethylene to ethylene oxide, whereas the parallel reaction converts ethylene to byproducts, carbon dioxide, and water.
We will begin our discussion of reaction types and their implications for pollution generation with the simple irreversible first-order parallel reaction mechanism shown below.

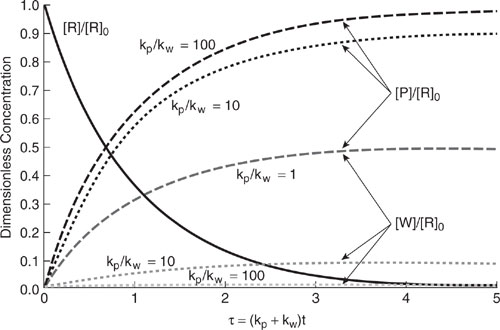
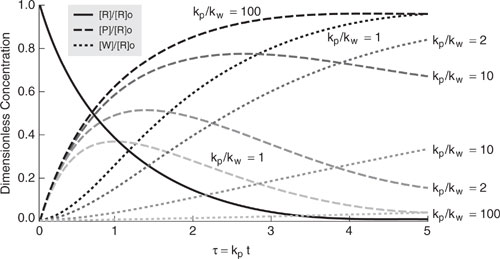
R is the reactant, P the product, W a waste byproduct, and kp and kw are the first-order reaction rate constants for product formation and waste generation (time -1), respectively. The relative concentrations of products and waste components are significantly affected by the ratio of the first order reaction rate constants, kp/kw. Figure 9.3-1 illustrates the dependence of the reactor effluent concentrations of products and waste as a function of reactor residence time for several values of these rate constant ratios. In order to achieve maximum reactor yields, the residence time must be about 5 times the reaction time constant (kp + kw)-1. The reaction selectivity is constant and independent of reactor residence time for first-order irreversible, isothermal parallel reactions. As shown next, in a series reaction, selectivity is affected by reactor residence time, and therefore this parameter must also be considered for pollution prevention in chemical reactors.
In a series reaction, the rate of byproduct (waste) generation depends on the rate of product formation, as shown by the first-order irreversible series reaction below.
![]()
Longer reactor residence times lead to not only more product formation but also more byproduct generation. The amount of waste generation for a series reaction depends on the ratio of product formation rate constant (kp) to the byproduct generation rate constant (kw) and also on the residence time in the reactor. Figure 9.3-2 illustrates the effect of reactor residence time on reactant, product, and byproduct concentrations for several reaction rate constant ratios (kp/kw). For each ratio, there is an optimum reactor residence time that maximizes the product concentration. Figure 9.3-3 shows the product yield ([P]/[R]o) and modified selectivity ([P]/([P] + [W])) over a range of reactor residence time for several reaction rate ratios. For irreversible series reactions, the modified selectivity continues to decrease with time. At longer residence times, the rate of waste generation is greater than the rate of product formation. To minimize waste generation in series reactions, it is important to operate the reactor so that the ratio kp/kw is as large as possible and to control the reaction residence time. Also, if there is a way to remove the reaction product as it is being formed and before its concentration builds up in the reactor, then byproduct generation can be minimized. We discuss this point more when the topic of separative reactors is covered later in this chapter.
Figure 9.3-1 Effect of kp/kw on the reactor outlet concentrations of products, reactants, and byproducts (waste) for a simple irreversible first-order parallel reaction mechanism.
Reversible reactions are another important category of chemical reactions. Figure 9.3-4 shows the reactant, product, and byproduct concentrations profiles in parallel and series reversible reactions for a wide range of reaction rate constants. It is evident that reversible reactions inhibit full conversion of reactants to products. Also, the reactor residence time is a key operating parameter for reversible reactions. Selectivity improvements for reversible reactions, operated at equilibrium, can be achieved by utilizing the concept of recycle to extinction. As an example of this concept, consider the steam reforming of methane to form synthesis gas (CO + H2) for methanol production.
Figure 9.3-2 Effect of product and waste reaction rate constants on product and waste concentrations in a first-order irreversible series reaction. The reactor residence time has been made dimensionless using the product reaction rate constant.
CH4 + H2O ↔ CO + 3H2
CO + H2O ↔ CO2 + H2
Both reactions are reversible and at equilibrium. When CO2 is recovered and recycled back to the reactor, it decomposes in the reactor as fast as it forms, and no net conversion of methane to CO2 occurs. This requires additional operating costs, but there is no selectivity loss of reactant, the process is cleaner, and it may be the lowest cost option overall (Mulholland and Dyer, 1999).
Figure 9.3-5 shows a process flow diagram for a reactor combined with a separator that recycles reactants and byproducts back to the reactor. This configuration can be operated such that all reactants fed to the reactor are converted to product with no net waste generation from the process. Selectivity improvements for reversible reactions can also be realized by employing separative reactors, as discussed later.
More complicated chemical reactions, compared to the few simplistic firstorder reactions mentioned above, are common in the chemical industry, and their pollution-generating potential must be evaluated on a case-by-case basis. However, the general trends discussed are expected to hold for more complex reaction networks.
Figure 9.3-3 Effect of product and waste reaction rate constants on product yield ([P]/[R]o) and product modified selectivity ([P]/([P]+[W])) for a first-order irreversible series reaction. The reactor residence time has been made dimensionless using the product reaction rate constant.

The choice of chemical reactor type within which the reaction is carried out is also an important issue for process design and pollution prevention. A continuous-flow stirred-tank reactor (CSTR) is not always the best choice. A plug flow reactor has several advantages in that it can be staged and each stage can be operated at different conditions to minimize waste formation (Nelson, 1992). In a novel application of a plug flow reactor, DuPont developed a catalytic route for the in-situ manufacture of methyl isocyanate (MIC) using a pipeline reactor, resulting in only a few pounds of MIC being inventoried in the process at any one time. This strategy minimizes the chance of a catastrophic release of MIC, such as happened at Bophal, India, in 1984 (Menzer, 1994; Mulholland, 2000).
When hot spots are a problem for highly exothermic reactions carried out in a fixed-bed catalytic reactor, a fluidized-bed catalytic reactor will likely avoid the unwanted temperature excursions. Good temperature control is critical for reducing byproduct formation reactions that are highly temperature-sensitive. An example where a fluidized-bed reactor succeeded in reducing waste formation is in the production of ethylene dichloride, an intermediate in the production of polyvinyl chloride (PVC) (Randall, 1994). The prior fixed-bed design operated with a temperature range of 230–300°C while the newer fluidized-bed design was able to run at between 220–235°C.
Figure 9.3-4 Product and byproduct profiles for reversible parallel and series reactions. Source: Levenspiel, Chemical Reaction Engineering, III © 1999. This material is used by permission of John Wiley & Sons, Inc.

Figure 9.3-5 Process flow diagram illustrating the concept of recycle to extinction for reversible reactions (R = reactant, P = product, and W = waste).Source: Allen and Rosselot, Pollution Prevention for Chemical Processes ©1997. This material is used by permission of John Wiley & Sons, Inc.

9.3.3 Reactor Operation
Reaction Temperature
Reaction temperature can influence the degree of conversion of reactants to products, the product yield, and product selectivity. We illustrate the effects of temperature on reaction selectivity by considering the simple irreversible first-order parallel reaction mechanism shown below.

where R is the reactant, P the product, W a waste byproduct, and kp and k w are the first-order reaction rate constants for product formation and waste generation (time-1), respectively. The ratio of the reaction rates for product formation to byproduct generation is an important indicator of reaction selectivity.

where A p and Aw are the frequency factors (time-1) and Ep and Ew are the activation energies (kcal/mole) for product and waste respectively, R is the gas constant (1.987x10⁻³ kcal/(mole•K)), and T is absolute temperature. Because the reaction rate constants, kp and kw, are functions of temperature, their ratio (S = kp/kw) is also a function of temperature. For the purpose of illustration, we can calculate the change in this ratio (Δ(kp/kw)) as the temperature is changed to a new value (T1) above or below a given initial temperature (To).
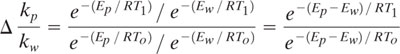
Figure 9.3-6 shows the expected change in the ratio of product/byproduct rate constants when temperature is changed (ΔT) above and below To. When Ep > Ew, the ratio increases with increasing temperature and decreases with decreasing temperature. Therefore, pollution can be prevented in parallel (and also series) reactions by increasing reactor temperature when Ep > Ew. The opposite holds true for when Ep < Ew. Also, as the difference between Ep and Ew increases, temperature has a more pronounced influence on the change in the rate constant ratios.
Mixing
When a reactant in one inlet stream is added to another reactant that already exists in a well-stirred reactor, the course of complex multiple reactions can be affected by the intensity of mixing in the vessel. For irreversible reactions, the reaction yield and selectivity may be altered compared to the case where the reactants are mixed instantaneously to a molecular level. This may lead to a greater amount of waste byproduct generation. In addition, the rate of reaction can be reduced because of diffusional limitations between segregated elements of the reaction mixture. The complications that arise from imperfect mixing are particularly evident for rapidly reacting systems. In these situations, reactants are significantly converted to products and byproducts before mixing is complete.
Figure 9.3-6 Effect of reaction temperature on the ratio of rate constants for a first-order parallel and irreversible reaction. For Ep > Ew, Ep was set to 20 kcal/mole and Ew to 10 kcal/mole. For Ep < Ew, Ep, was set to 10 kcal/mole and Ew to 20 kcal/mole. To = 500K.

To illustrate the effects of mixing, it is illustrative to examine the competitive-consecutive reaction carried out in a constant stirred tank reactor (CSTR), using the reaction mechanisms shown below (Paul and Treybal, 1971).

This reaction is also sometimes referred to as the series-parallel reaction. This reaction type is a good kinetic representation of the nitration and halogenation of hydrocarbons and saponification of polyesters, among its many industrially-relevant examples (Chella and Ottino, 1982). Reactant A is initially charged in the reactor and B is added as a solution through a feed pipe in a continuous manner until a stoichiometric amount of B is added. Species R is the desired product and S is a byproduct. If the reactions are first order, mixing will not affect selectivity. However, if the reactions are second order, the presence of local excess B concentrations can cause overreaction of R toS via the second reaction. This effect of mixing occurs for both homogeneous and heterogeneous reaction systems and for batch or semi-batch reactors (B added to an initial charge of A as described above).
A detailed experimental study of a homogeneous liquid phase second-order competitive-consecutive reaction was conducted to determine the effects of mixing on yield of reactants A andB to product R in a CSTR (Paul and Treybal, 1971). The reaction involved the iodization of L-tyrosine (A) in aqueous solution, as shown in Figure 9.3-7.
The authors investigated the effects of reaction temperature, initial concentration of reactant A (Ao), rate of addition of B, agitation rate of the vessel impeller, and presence or absence of baffling within the reactor. A correlating equation for all of these parameters was found between the ratio of measured reactor yield to expected yield (Y/Yexp) versus the dimensionless quantity (k1 Boτ)(Ao/Bo), where

Figure 9.3-7 Iodization of L-tyrosine in aqueous solution.

To give an idea of the range of observed yields in the experiments, values of Y/Yexp were measured from 0.66 to 0.98, depending upon mixing intensity and other parameters. A correlation fitting the data is presented in Figure 9.3-8. It was found that when the quantity (k1 Boτ)(Ao/Bo) was less than or equal to 10-5, Y ≈ Yexp. This criterion allows us to “set” the mixing intensity for any second-order competitive-consecutive reaction.
![]()
Rearranging for τ from the above equation, and incorporating the Kolomogoroff universal equilibrium theory for turbulent motion (Kolmogoroff, 1941), we get

where
Lf | = a characteristic length scale of the vessel (ft) |
u′ | = fluctuating turbulent velocity (ft/sec) |
ν | = kinematic viscosity (ft2/sec) |
We can rearrange the equation above for u′ and incorporate a correlation for turbulent fluctuation velocity in an agitated CSTR (Cutter, 1966) for feed entering at the impeller (u′ = 0.45 π D N). We arrive at
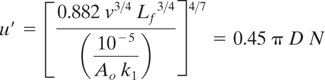
Thus, with this equation, we can establish the necessary impeller agitation speed (N, revolutions per second) to ensure that mixing will not adversely affect the yield, given k1, ν, Lf, and D, the impeller diameter (ft).
Figure 9.3-8 Correlation of reaction yield efficiency with the mixing parameters of Paul and Treybal (1971) for an irreversible consecutive-competitive second-order reaction.

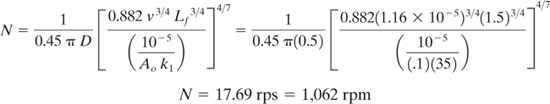
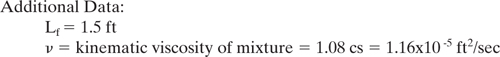
Example 9.3-1 CSTR Mixer Design to Maximize Yield
A second-order competitive-consecutive reaction is being carried out in an industrial reactor. Use the correlation derived above based on theo work of Paul and Treybal to determine the required impeller rotation rate (N) to eliminate mixing effects and achieve the expected yield.
Data: k1 | = 35 (liter/(gmole•sec)) |
Lf | = 1.5 ft |
ν | = kinematic viscosity of mixture = 1.08 cs = 1.16x10⁻⁵ ft2/sec |
Ao | = initial concentration of A in the CSTR = .1 (gmole/liter) |
D | = impeller diameter = 0.5 ft |
Solution: The equation above can be re-arranged to solve for N.
Example 9.3-2 Estimate the magnitude of the mixing effect on reaction yield.
A second-order competitive-consecutive reaction is being carried out in a CSTR. The initial concentration of reactant A in the vessel is 0.2 gmole/liter and the feed containing reactant B is introduced into the reactor at the impeller. The volume of the vessel is 100 liters, the impeller diameter is 0.5 ft, k1 is 35 liter / (gmole•sec), impeller speed is 200 rpm. Additional data are shown below. Estimate the reaction yield as a fraction of the expected yield.
Solution: The x-axis in Figure 9-3.8 requires that be calculated, and requires u′.
From Figure 9-3.8, the estimated value of Y/Yexp is approximately 0.92. Thus, the mixing in this reactor is almost sufficient to achieve the expected yield. Byproduct generation is not affected to a large degree by mixing in this CSTR, but could be improved slightly by operating the mixer at higher speeds.
Effect of Reactant Concentration
The selectivity of series and parallel chemical reactions can be sensitive to the initial concentration, since the rates of product formation and byproduct generation are dependent on concentration. For a parallel irreversible reaction, the rates of product formation and waste generation can be expressed as
![]()
and
![]()
where [R] is the concentration of reactant and np and n w are the orders of the reaction. The ratio of these rates is an indicator of the reaction selectivity toward product formation.

If np > nw, then increasing the concentration of reactant will increase the reaction selectivity toward the product and away from the waste byproduct. Conversely, if np < nw, then increasing reactant concentration will decrease selectivity toward the desired product.
Summary of Other Methods
There are numerous operational modifications for improving the environmental and economic performance of reactors. A summary of many important modifications is shown in Table 9.3-2, along with a short description of the nature of the problem addressed, the modification, and the observed benefit. Additional case studies involving improvement in reactor operation can be found elsewhere (US EPA, 1993a).
9.4 Pollution Prevention for Separation Devices
Separation technologies are some of the most common and most important unit operations found in chemical processes. Because feedstocks are often complex mixtures and chemical reactions are not 100% efficient, there is always a need to separate chemical components from one another prior to subsequent processing steps. Separation unit operations generate waste because the separation steps themselves are not 100% efficient, and require additional energy input or waste treatment to deal with off-spec products. In this section, we discuss the use of separation devices with respect to pollution prevention in chemical processes. First, the importance of the choice of material (mass separating agent) to be used in the separation step is presented. Next, design heuristics regarding the use of separation technologies in chemical processes are covered. Finally, we present examples of the use of separation technologies for recovery of valuable components from waste streams, leading eventually to their reuse in the process.
9.4.1 Choice of Mass Separating Agent
The correct choice of mass separating agent to employ in a separation technology is an important issue for pollution prevention. A poor choice may result in exposure to toxic substances for not only facility workers but also consumers who use the end product. This is especially important in food products, where exposure to residual agents is by direct ingestion into the body with the food. For example, decaffeinated coffee beans and instant coffee used to be extracted with a chlorinated solvent. While the solvent was extremely effective in extracting caffeine from the bean, residuals in the final product posed an unacceptable health risk to consumers. Caffeine is now extracted using supercritical carbon dioxide (among other benign agents), whose residuals pose no health risk. Edible oils are extracted from plant material using volatile solvents. The oil is recovered from the solvent using distillation while the solvent is recycled back to the process. Residuals can be present in the final product and therefore, it is important to use the lowest toxicity mass separating agent in these applications. In addition to these toxicological issues, a poor choice of mass separating agent may lead to excessive energy consumption and the associated health impacts of the emitted criteria pollutants (CO, CO2, NOx, SOx, particulate matter).
Table 9.3-2 Additional Reactor Operation Modifications Leading to Pollution Prevention (Nelson, 1992; Mulholland and Dyer, 1999).
Improve Reactant Addition |
Problem: Non-optimal reactant addition can lead to segregation and excessive byproduct formation. Solution: Premix liquid reactants and solid catalysts before their introduction into a reactor using static in-line mixers. |
Benefits: This will result in more efficient mixing of reactants and reduced waste generation by side-reactions for 2nd order or higher competitive-consecutive reactions. |
Solution: Improve dip tube and sparger designs for tank reactors. Do not add low-density material above the liquid surface of a batch reactor. Control residence time of gases added to liquid reaction mixtures. |
Benefits: Improved bottom-nozzle dip-tube design and improved gas residence time; control strategy reduced hazardous waste generation by 88% and saved $200,000 per year. |
Catalysts |
Problem: Homogeneous catalysts can lead to heavy metal contamination of water and solid-waste streams. |
Solution: Consider using a heterogeneous catalyst where the metals are immobilized on a solid support. |
Problem: Old catalyst designs emphasized conversion of reactants over selectivity to the desired product |
Solution: Consider a new catalyst technology that features higher selectivity, and better physical characteristics (size, shape, porosity, etc.). |
Benefits: Lower downstream separation and waste treatment costs for byproducts—for example, a new catalyst for making phosgene (COCl2) minimized for formation of carbon tetrachloride and methyl chloride, saving $1 million and eliminating an end-of-pipe treatment device. |
Distribute Flows in Fixed-Bed Reactors |
Problem: Reactants entering a fixed-bed reactor are poorly distributed. The flow preferentially travels down the center of the reactor. The residence time of the fluid in the center is too short and at the reactor walls is too long. Yield and selectivity suffer. |
Solution: Install a flow distributor at the reactor entrance to ensure uniform flow across the reactor cross-section. |
Control Reactor Heating/Cooling |
Problem: Conventional heat exchange design is not optimum for controlling reactor temperature. |
Solution: For highly exothermic reactions, use cocurrent flow of cooling fluid on the external surface of tubular reactors at the inlet where reaction rates and heat generation rates are highest. Use countercurrent flow of cooling fluid near reactor exit where reaction rates and heat generation rates are smallest. |
Problem: Diluents added to gas phase reactions, often nitrogen or air, help to dissipate heats of reaction but can result in the generation of wastes, such as oxides of nitrogen in partial oxidation reactions. |
Solution: Use a non-reactive substitute diluent, such as carbon dioxide in partial oxidation reactions or even water vapor. Carbon dioxide will need to be efficiently separated from product streams, cooled, and recycled back to the reactor. If water vapor is used, it can be condensed but might result in a wastewater stream for certain reactions. |
Additional Reactor Operation Issues |
• Improve measurement and control of reactor parameters to achieve optimum state. |
• Provide a separate reactor for recycle streams. |
• Routinely calibrate instrumentation. |
• Consider using a continuous rather than a batch reactor to avoid cleaning wastes. |
Choice of a mass separating agent in an adsorption application can be illustrated using a simple example. Adsorption is a technology whereby a chemical dissolved in a liquid or a gas phase will preferentially become immobilized on the surface of a solid matrix (adsorbent) packed within a column. Separation and recovery of toxic metal ions from aqueous streams is one very important application of adsorption. Granular activated carbon (GAC) is a very common type of adsorbent, but for the recovery of metals, it has been found that typical strong cation exchange resins have approximately a 20-fold higher capacity to adsorb Cu2+ (Mulholland and Dyer, 1999) than GAC. The metal must be recovered from the regenerated adsorbent using a strong acid. In this case, the use of GAC would require more energy consumption and would generate more acid waste than the cation exchange resin.
9.4.2 Process Design and Operation Heuristics for Separation Technologies
A typical chemical process might be depicted as shown in Figure 9.4-1, where a reactor converts feed materials into products and byproducts that must be separated from each other by the additional input of energy. There are waste streams leaving the process and entering the air, the water, and the soil compartments of the environment. While it may be difficult or impossible to eliminate all waste streams, there is every reason to believe that wastes can be minimized by the judicious choice of mass separating agent, by the correct choice and sequencing of separation technologies, and the careful control of system parameters during operation.
The first step in minimizing wastes generated from separation units in chemical processes is to choose the correct technology for the separation task. Making the correct choice, based on the physical and chemical properties of the molecules to be separated, will lead to processes that generate less waste and use less energy per unit of product. The separation task may pertain to a process stream or a waste stream. Table 9.4-1 shows unit operation choices and property differences between the components to be separated.
After selecting the best separation technology, it is worth considering several pollution prevention heuristics to guide the design of the flowsheet and operation of the units. Table 9.4-2 shows several design and operation heuristics for separation processes. Streams of similar enough composition can be combined in order to reduce the number of unit operations and their associated capital costs and emission sources. Corrosive materials should never be added unless necessary and if added or generated in the process, should be separated immediately. Their removal can minimize investment and the generation of trace metals. Unstable materials should be removed, preferably at low temperatures, to reduce the formation of undesirable waste products, such as tars. Removing the highest volume components first in a process will minimize downstream equipment investment, associated energy-related costs, and the addition of materials required for processing that could become another source of waste. If component properties are very close (difficult separation) or product purity requirements from the separation are extremely high, reducing the number of components involved will make the separation easier. Therefore, these cases should be left until the end in a separation sequence. Whereas raw materials and products add value to the design, mass separating agents only increase investment, operating cost, and waste loads. Therefore, mass separating agents should not be added to the process unless necessary. If a mass separating agent needs to be added, it should be removed (preferable recycled) in the next step of the process using an energy separating agent technology. The process should avoid separation technologies that operate far from ambient temperature and pressure. If departures from ambient are required, it is more economical to operate above rather than below ambient.
Distillation accounts for over 90% of the separation applications in chemical processing in the United States (Humphrey, 1995). Because of its prominence, we will present a number of pollution prevention techniques that are specific to distillation. Distillation columns contribute to process waste in four major ways;
a) by allowing impurities to remain in a product,
b) by forming waste within the column itself,
c) by inadequate condensing of overhead product (Nelson, 1992), and
d) by excessive energy use.
Product impurities above allowable levels must eventually be removed, leading to additional waste streams and energy consumption. Waste is formed within distillation columns in the reboiler where excessive temperatures and unstable materials combine to form high molecular weight tars or polymers on the heat transfer surfaces. The condenser vent must be open to the external environment to relieve non-condensable gases that build up in the column. If the condenser duty is insufficient for the internal vapor load in the column, excess vapor will exit the vent as a waste stream. Energy use leads to the direct release of criteria pollutants (CO, NOx, SOx, particulate matter, volatile organic compounds) and global warming gases (primarily CO2).
Figure 9.4-1 Typical chemical process (Adapted from Mulholland and Dyer, 1999).

Table 9.4-1 Unit Operations for Separations and Property Differences (Null, 1987).

The most common way to increase product purity in distillation is to increase the reflux ratio. However, this increases the pressure drop across the column, raises the reboiler temperature, and increases the reboiler duty. But for stable materials, this may be the easiest way to decrease waste generation due to inadequate product purity. If a column is operating close to flooding (increasing reflux ratio is not an option), then adding a section to the column leads to higher-purity products. Replacing existing column internals (trays or packing) with high-efficiency packing results in greater separation for an existing column, and results in both lower pressure drop and reboiler temperature. Changing the feed location to the optimum may increase product purity without changing any other system parameters. In one documented case, relocating the feed to the optimum position reduced the loss of product to waste from 30 to 1 lb/hr, increased column capacity by 20%, and decreased the refrigeration cooling load by 10% (Mulholland and Dyer, 1999). The net benefit of this single step was greater than $9,000,000 per year. Additional ways to increase column separation efficiency are to insulate the column and reduce heat losses; improve feed, reflux, and liquid distribution; and preheat the column feed, employing cross-exchange with other process streams. Finally, if the overheads product contains a light impurity, it may be possible to withdraw the product from a side stream near the top of the column. A bleed stream from the overhead condenser can be recycled back to the process to rid the column of the light component.
Table 9.4-2 Separation Heuristics to Prevent Pollution (Adapted from Mulholland and Dyer, 1999).
1. Combine similar streams to minimize the number of separation units. |
2. Remove corrosive and unstable materials early. |
3. Separate highest-volume components first. |
4. Do the most difficult separations last. |
5. Do high-purity recovery fraction separations last. |
6. Use a sequence resulting in the smallest number of products. |
7. Avoid adding new components to the separation sequence. |
8. If a mass separating agent is used, recover it in the next step. |
9. Do not use a second mass recovery agent to recover the first. |
10. Avoid extreme operating conditions. |
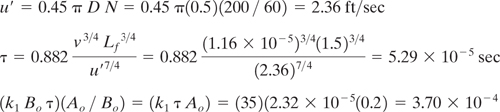
Example 9.4-1 Energy Savings in Ethanol-Water Distillation: Side Stream Case
When a product from a distillation is needed with a composition between the distillate (xD) and bottoms (xB) products, a side stream with this composition collected from the column will always save energy compared to combining the top and bottom product streams. Consider the distillation column with a side stream of composition xS and flow rate of S (moles/hr), as shown in Figure 9.4-2. Using a McCabe-Thiele analysis, demonstrate energy savings can be achieved using a side stream. Mole fractions are ethanol.
Solution: It can be easily shown, using graphical methods presented in any standard textbook (Wankat, 1988), that the required separation for this column, feed conditions, and separation requirements can be achieved using a column with 12 equilibrium stages operating with a reflux ratio of L/D = 2.5. The side stream is taken from the 5th stage from the top of the column. Similarly, for a 12-stage column without a side stream, the required separation for this feed can be accomplished using a reflux ratio of only 2.0. Nonetheless, the side stream has clear energy savings as shown in the table below.
Figure 9.4-2 Schematic diagram of distillation column with side stream.

Using a side stream design, the energy savings are (96.16-63.96)/96.16 × 100 = 33.5%. As shown in Chapter 11, the energy savings will translate to reduced impacts for global warming and acid rain/deposition.
![]()
In this example, the feed quality (q) is taken to be 1/2 (1/2 vapor and 1/2 liquid) and δW is the latent heat of vaporization of water (in the reboiler; 104 cal/mole).
There are several ways to decrease the generation of tars in the reboiler of the column. One way is to reduce the column pressure, resulting in lower reboiler temperatures. Caution must be taken, as this affects the condenser temperature and efficiency. The above step should be coupled with steps to reduce the steam temperature. Reboiler temperature can be reduced by desuperheating the steam, by using a lower pressure steam, by installing a thermocompressor, or by using an intermediate heat transfer fluid. The existing reboiler may be retrofitted with high flux tubes allowing for the use of lower pressure steam.
If the overheads condenser is undersized relative to the vapor loading in the column, it can be re-tubed or replaced with a larger capacity unit. This step will reduce the likelihood that fluctuations of column operation will result in hot vapor being expelled from the column vent. An additional way to reduce distillation column emissions and waste generation is by improving the process control technology. This step will assure that product purity specifications will be met and reduce the possibility that off-spec product will be created.
9.4.3 Pollution Prevention Examples for Separations
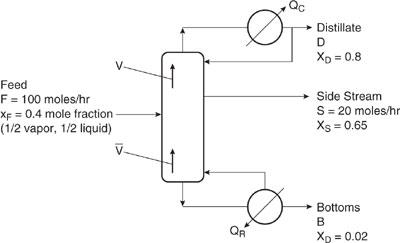
Pollution can be prevented using separation processes by selective recovery and reuse of valuable components from waste streams. Often, a good knowledge of the capabilities of separation technologies combined with markets for components recovered from waste streams can result in processes that are not only profitable but that also prevent pollution from entering the environment. Table 9.4-3 summarizes many successful applications of separation technologies for pollution prevention.
9.4.4 Separators with Reactors for Pollution Prevention
Separators can be combined with reactors to reduce byproduct generation from reactors and increase reactant conversion to products. These combinations of separators and reactors can involve either distinct units, as illustrated in Section 9.3, or integrated units as outlined in Section 9.5.
Table 9.4-3 Pollution Prevention Examples for Separation Processes

9.5 Pollution Prevention Applications for Separative Reactors
An exciting new reactor type that has a very high potential for reducing waste generation is the separative reactor. These hybrid systems combine chemical reaction and product separation in a single process unit. When chemical reaction and separation occur in concert, the requirements for downstream processing units are reduced, leading to lower capital costs. The key feature allowing for the prevention of waste generation and maximizing product yield is the ability to control the addition of reactant and the removal of product more precisely than in traditional designs. Unfavorable chemical equilibrium can be shifted to maximize reactant conversion and product yield. Unwanted byproduct generation can be minimized in series reactions by the removal of the desired product within the reaction zone and before significant secondary reactions can occur. Separation units that have been integrated with reaction include distillation, membrane separation, and adsorption. A recent review has been written on emerging uses of separative reactors for pollution prevention employing membranes and solid adsorbents (Radecki et al., 1999).
A good demonstration of reaction coupled with adsorption is oxidative coupling of methane (OCM). Methane reacts with oxygen in the presence of metal oxide catalysts at a temperature of about 1000K to form ethane and ethylene.
2CH4 + 1/2O2→C2H6 + H2O
2CH4 + O2→C3H4 + 2H2O
A parallel path in which methane is completely oxidized is shown below.
CH4 + 2O2→CO2 + 2H2O
There is also a concern that the ethylene product can be oxidized to carbon dioxide, thereby reducing product yield and increasing waste generation. Successful application of OCM in industry would allow the use of methane, a high-production chemical that is difficult to transport, as a feedstock for ethylene, an important intermediate in polymer production. The difficulty with traditional OCM in a fixedbed or fluidized-bed reactor is that the feed ratio of CH4/O2 must be kept around 50 or more to limit complete oxidation reactions from occurring. This results in relatively high selectivity (80–90%) but limits the yield of C2s to less than 20%. A separative reactor composed of a series of reactor/adsorber sections substantially improved the yield of C2 (50–65%) (Tonkovich, et al., 1993; Tonkovich and Carr, 1994). Each section contained a fixed-bed catalytic reactor operating at high temperature (1000K), followed immediately by a cooler adsorption bed. Figure 9.5-1 shows the arrangement of a four-section simulated countercurrent moving-bed chromatographic reactor (SCMCR) in which the smaller columns are the catalytic fixed-bed reactors and the larger columns are for adsorption. In section 1, the carrier gas (N2) sweeps unreacted adsorbed CH4 into the next section (feed section 2).
A small make-up feed stream comprised of CH4/O2 in stoichiometric amounts (to make up for consumption in reaction) is combined with a carrier gas stream from section 1, which then enters the reactor in the feed section. Reaction products (C2s) and unreacted CH4 are adsorbed in the large column of section 2, with the C2 products being retained in the upper portion and the more mobile CH4 in the bottom. Section 3 is isolated from flow, yet contains unreacted CH4 in the adsorption column. Section 4 is the product removal section in which the C2 products are swept off the adsorption bed and into a side stream roughly midway in the column. After maintaining the SCMCR in this configuration for a prescribed time interval, the flow configurations are advanced one section to the left so that section 1 is the product removal section, section 2 is the carrier section, section 3 is the feed section, and section 4 is the isolated section.
Another application of the coupled catalytic reactor with adsorbent beds is the partial oxidation of methane to methanol. Methanol is in demand as a fuel oxygenate, is a feedstock for other oxygenates in reformulated gasoline, and is being investigated as an alternative fuel for gasoline and diesel engines. Reformulated gasoline reduces emissions of CO, NOx, volatile organic compounds, and benzene from automobiles, as required by the Clean Air Act of 1990. The current process for methanol production is a costly two-step process, consisting of steam reforming of methane to produce CO and H2, followed by methanol formation by passing CO and H2 over a metal oxide catalyst. The overall reaction of CO and H2 to form methanol is endothermic by 125 kJ/mole, requiring significant energy input. In contrast, the partial oxidation reaction of methane has the overall reaction
CH4 + 1/2O2 → CH3OH
and is exothermic by 126 kJ/mole. However, in order to minimize over-oxidation of methanol to CO2 in a series reaction, the feed CH4/O2 ratio must be kept high, leading to disappointingly low per-pass methanol yields of less than 10%. In recent experiments, methanol yield increased from 3–4% in a tubular reactor to 17% when the reactor was interfaced with adsorber beds and operated in the SCMCR mode (Bjorklund and Carr, 1996). This demonstrated that the SCMCR mode of reaction is useful for increasing performance of low conversion per pass reactions.
Figure 9.5-1 Schematic of a four-section SCMCR for the oxidative coupling of methane. Adapted from Tonkovich et al., 1993.

Reaction coupled with membrane separation is another often-studied configuration for increasing the efficiency of chemical reactions. Much like adsorptionbased separative reactors, the equivalent membrane-based unit can be used to selectively remove either products or byproducts from the reaction zone, thereby overcoming low conversions in equilibrium-limited reactions and reduce waste generation in series reactions. However, membrane-based separative reactors can also be used to selectively permeate reactant into the reaction zone in order to control excessive byproduct formation (e.g., permeation of O2 in partial oxidation or oxidative coupling reactions). Both of these modes of operation are shown in Figure 9.5-2. Membrane materials can be organic, porous inorganic, or nonporous (dense) inorganic, and either can be constructed of inert (non-reactive) material or can contain catalysts in various configurations.
Figure 9.5-2 Main modes of operation for membranes Separative reactors: (a) Selective removal of products / byproducts and (b) Selective permeation of reactants.

Applicable reaction types that can be improved by membrane separative reactors include
a) thermodynamically-limited reactions (e.g., C6H12 ↔ C6H12 + 3H2),
b) parallel reactions in which product formation has a lower reaction order than byproduct generation,
c) series reactions such as selective dehydrogenations and partial oxidations, and
d) series-parallel reactions.
Applications of membrane separative reactors for partial oxidation have shown encouraging results. The test reaction of ethane oxidative dehydrogenation to ethylene showed that per pass yields increased from 12 to 52% (Tonkovich et al., 1996). Positive results were also demonstrated for membrane separative reactors for dehydrogenation of ethylbenzene to produce styrene, where conversions as high as 70% were observed, approximately 15% higher than conventional methods, and an increase from 2–5% in styrene selectivity (Radecki et al., 1999).
The potential for membrane separative reactors or other means to improve the environmental and economic performance of some of the top 50 commodity chemicals in the U.S. chemical industry formed through partial oxidation or by dehydrogenation reactions was recently studied (Tonkovich, 1994; Tonkovich and Gerber, 1995). The maximum energy saving was estimated to be 0.25 quadrillion BTU if every commodity chemical formed through either selective oxidation or dehydrogenation achieved maximum efficiency. Maximum annual savings in feedstocks were estimated to be $1.4 billion.
Additional challenges remain before commercial application of membrane separative reactors can be realized. These include
a) economical manufacture of thin, defect-free selective membrane layers over large surface areas,
b) leak-free reaction systems with high temperature seals,
c) elimination or reduction of sweep gases which dilute product streams, and
d) enhanced membrane and catalyst performance, including resistance to fouling and deactivation.
9.6 Pollution Prevention in Storage Tanks and Fugitive Sources
9.6.1 Storage Tank Pollution Prevention
Storage tanks are very common unit operations in several industrial sectors, including petroleum production and refining, petrochemical and chemical manufacturing, storage and transportation, and other industries that either use or produce organic liquid chemicals. Tanks are used for many purposes, including storage of fuels and for feedstock or final product buffer capacity. The main environmental impact of storage tanks is the continual occurrence of air emissions of volatile organic compounds from roof vents and the periodic removal of oily sludges from tank bottoms.
Tank bottoms are solids or sludges composed of rusts, soil particles, heavy feedstock constituents, and other dense materials that are likely to settle out of the liquid being stored. There are various methods of dealing with these materials once they are present. They may be periodically removed and either treated via land application or disposed of as hazardous waste. As long as the bottoms components are compatible with downstream processes, they may be prevented from settling to the tank bottom by the action of mixers that keep the solid particles suspended in the liquid (API, 1991a). Another method is to use emulsifying agents that keep water and solids in solution and out of the tank bottoms. A concern with the use of this method is the potential to generate oily waste downstream in the refinery processes from the presence of the emusifiers (API, 1991b).
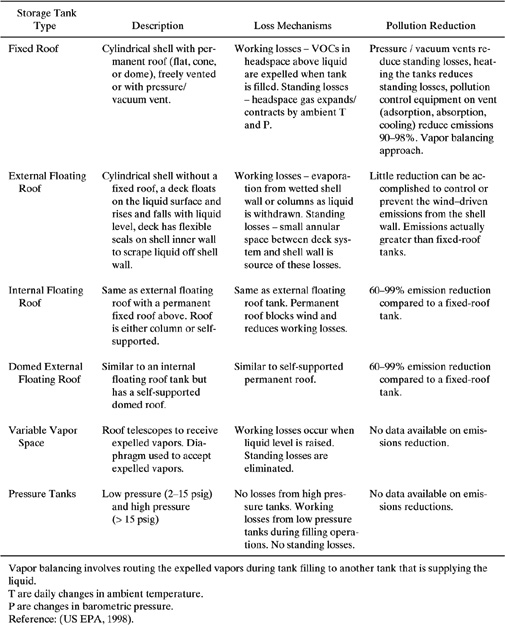
Air emissions of volatile organic compounds from storage tanks are a major source of airborne pollution from petroleum and chemical processing facilities. These emissions stem from the normal operation of these units in response to the changes in liquid level within the tank and the action of ambient changes in temperature and pressure. These loss mechanisms are termed working losses and standing losses, respectively. The emissions are dependent upon the vapor pressure of the stored liquids, tank characteristics such as tank type, paint color and condition, and also the geographic location of the tank. There are six major types of storage tanks. A listing of these tank types, short descriptions, a summary of emission mechanisms, and pollution reduction measures are listed in Table 9.6-1.
The following example will illustrate the emission reduction that is possible when substituting a floating-roof tank for a fixed-roof tank in a process design.
Example 9.6-1 Storage tank emissions
A toluene product stream (516,600 gal/yr) exits from a VOC recovery process for a gaseous waste stream at a facility in the vicinity of Detroit, MI. Using the TANKS (see Chapter 8) software (US EPA TTN, 1999), calculate and compare the uncontrolled annual emissions for a new tank design having the following dimensions and conditions:
Fixed-Roof Tank: Height = 20 ft, Diameter = 12 ft, Working Volume = 15,228.53 gallons, Maximum Liquid Level = 18 ft, Average Liquid Level = 10 ft, no heating, domed roof of height 2 ft and diameter of 12 ft, vacuum setting of - .03 psig and pressure setting of .03 psig.
Internal-Floating Roof Tank: Height = 20 ft, Diameter = 12 ft, Working Volume = 15,228.53 gallons, self-supporting roof, internal shell condition of light rust, floating roof type is pontoon, primary seal is a mechanical shoe, secondary shoe is shoe-mounted, deck type is welded, deck fitting category is typical.
Domed External Floating-Roof Tank: same as internal floating-roof tank.
Table 9.6-1 Storage Tank Types and Pollution Reduction Strategies.
Solution: The TANKS program allows the user to quickly calculate the annual emission rate for all three tank types. The results are
Fixed-Roof Tank: 337.6 lb/yr
Internal Floating-Roof Tank: 66.2 lb/yr.
Domed External Floating-Roof Tank: 42.8 lb/yr.
Discussion: The reduction in emissions for the floating-roof tanks compared to the vertical fixed roof tank are:
Internal Floating-Roof Tank: % reduction = (337.6-66.2)/337.6 x 100 = 80.4%
Domed External Floating-Roof Tank: % reduction = (337.6-42.8)/337.6 x 100 = 87.3%
The reductions are significant, and may help the facility achieve emission reduction targets established by local, state, and federal regulations. Floating-roof tanks are more expensive than fixed-roof tanks and this consideration would have to be incorporated into any design decision. Pollution control on fixed-roof tank vents can achieve even higher removal percentages (90–98%), but would require annual operating costs.
9.6.2 Reducing Emissions from Fugitive Sources
Fugitive emission sources in chemical processes include valves, pumps, piping connectors, pressure relief valves, sampling connections, compressor seals, and openended lines. There may be thousands of these components in a typical synthetic organic chemical manufacturing industry (SOCMI) facility and tens to hundreds of thousands in a large petroleum refinery. These emission sources are significant contributors to air pollution from SOCMI facilities, as estimates have shown that as much as one third of air emissions occur from fugitive sources (US EPA, 1986).
Within individual components, leaks are localized near seals, valve packings, and gaskets. Components in good working order rarely leak quantities of process fluids that are of significant concern. When leaks occur due to a seal, packing, or gasket failure, the exact timing, location, and rate of release is difficult to predict. These leaks are of two types—either low-level leaks that may persist for long periods of time until detected, or sudden episodic failures resulting in a large release. However, the leaks can be prevented or repaired, and leakless technologies are available for situations where even small rates of release cannot be tolerated.
In this section, we identify which of the components from fugitive sources listed above have the greatest potential for emission reductions as a result of pollution prevention efforts. Next, established methods for reducing or preventing fugitive emissions are presented. Finally, a study summarizing the emissions reductions that are possible in chemical manufacturing facilities is presented.
Fugitive Emission Profiles
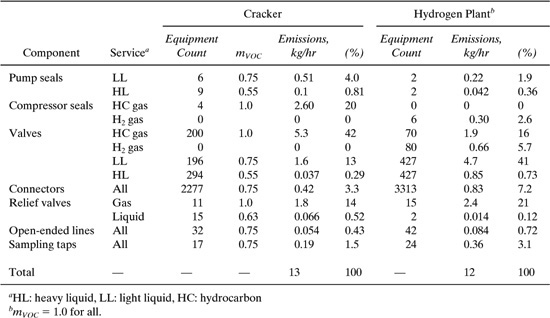
The average rate of emission of volatile organic compounds (VOCs) from fugitive components of different types can vary significantly within a given facility. To demonstrate this, we estimate the emission rate from all fugitive sources within two processing units at a refinery, a cracking unit and a hydrogen plant. The average emission factors presented in Table 8.3-3 will be used along with a knowledge of the numbers of sources within a given component type and the mass fraction of VOC in the stream serviced by the component. The equation used to calculate the emission rate for each component is
E = mVOCfav
where E is the emission rate (kg/hr/source), mVOC is the mass fraction of VOC in the stream, and fav is the average emission factor. The numbers of fugitive sources and their contributions to the emissions from the two processing units at a refinery are shown in Table 9.6-2. Valves in all service are by far the largest source for emissions from these process units, comprising 55.3% and 63.4% of the total for the cracker unit and H2 plant, respectively. These emissions are disproportionately large for the relative number of valves in the processes—22.5% and 22.8% for the cracker unit and H2 plant, respectively. The component present in the largest number is connectors in all service, being 74.4% and 75.1% of the total for the cracker unit and H2 plant, respectively. Relief valves appear to be significant emission sources, as do seals on pumps and compressors.
Table 9.6-2 Distribution of Fugitive Components and Emission Rates from a Cracking Unit and a Hydrogen Plant at a Refinery (Allen and Rosselot, 1997).
Methods to Reduce Fugitive Emissions
There are two methods for reducing or preventing emissions and leaks from fugitive sources. They are
1) leak detection and repair (LDAR) of leaking equipment, and
2) equipment modification or replacement with emissionless technologies.
Both methods can be effective in reducing low-level as well as large episodic leaks of process fluid.
In an LDAR program, equipment such as pumps and valves are monitored periodically using an organic vapor analyzer (OVA). The wand of the OVA is directed towards the suspected source of leakage on each piece of equipment, i.e. at a packing nut on a valve, at a shaft seal on a pump, or a gasket or weld on a flange or connector. Guidance documents are available from the US EPA on detailed procedures to monitor for leaks and estimate emissions for fugitive sources (US EPA 1993b). If the source registers an OVA reading over a threshold value (>10,000 ppm), the equipment is said to be leaking and repair is required. Progress towards achieving desired fugitive emission reduction targets can be measured by using the OVA screening values and US EPA emission correlations for fugitive sources, as shown in Table 9.6-3. The nature of the repairs depends upon the piece of equipment, but may involve something as simple as tightening a packing nut on a valve or it may require replacement of a seal on a pump or a gasket in a connector. Repairs may require shut-down of the process, and would be conducted during regularly-scheduled shut-down times in order to minimize the number of upsets in process operation and reduce repair-related emissions.
Industrial LDAR programs vary greatly in their frequency of monitoring and in their effectiveness. Constant monitoring of emissions using area monitors is possible when contaminants are detectable in very low concentrations. For cases where constant monitoring is either technically impossible or too expensive, periodic monitoring on a monthly, quarterly, or annual basis using an OVA is the preferred approach. Monitoring on a more frequent basis may be more costly, but has been shown to be more effective in reducing emissions. For example, monitoring and repairing valves in light liquid service at monthly intervals is a third more effective in reducing emissions compared to monitoring quarterly, and is three times as effective as monitoring every six months (US EPA 1982).
Equipment modification to reduce fugitive emissions might involve redesigning a process so that it has fewer pieces of equipment and connections, replacing leaking equipment with new conventional equipment, or the inclusion of new emissions-reducing technology, and sealant injection. In this discussion, we focus only on equipment replacement for the major fugitive emission sources, valves, connectors/flanges, compressors, and pumps. For a more complete treatment, the reader is referred to other textbooks on the subject (Allen and Rosselot 1997, Chapter 7). We discuss the types of equipment, where the leaks are likely to occur, and what equipment changes can be made to reduce or eliminate releases.
Table 9.6-3 Correlations for Estimating Fugitive Emissions and Their Default Values (US EPA, 1993b).
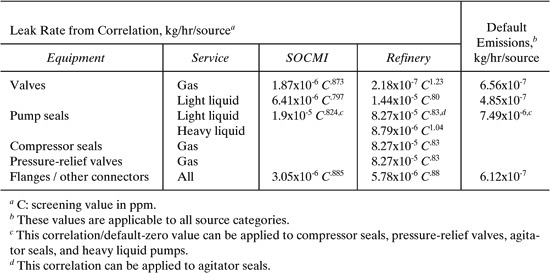
Connectors are the most numerous pieces of equipment and are used to connect pipe to other pipes or to equipment and vessels. Connectors on smaller piping (<2 inches in diameter) are either threaded pipes and couplers or nut-and-ferrule connectors. Flanges are connectors with a flexible seal junction that are used for pipes greater than 2 inches in diameter. Another connector type is welded pipe. Leaks may occur from connectors due to thermal deformation on correct assemblies or may result from cross-threading and incorrect assembly of nut-and-ferrule types. Monitoring of these pieces of equipment would occur near threaded junctions, gaskets, and welds.
Seals around moving parts are common locations of leaks for fugitive sources such as valves, pumps, and compressors. For valves, the moving part is the stem that connects the internal components of the valve with the outside. The packing is subject to degradation or the stem may have surface defects, both of which may promote leaks. Valve packing technologies that use rings to keep the packing from extruding and springs to maintain the packing under constant pressure and contact with the stem have been developed. These systems can reduce leak rates and reduce maintenance requirements for 10–50 times as long as conventional packing (Brestel et al., 1991). There are two main types of “leakless” valves that have no emissions through the stem. They are bellows valves, which are expensive and are mostly used in the nuclear power industry, and diaphragm valves, in which a physical barrier (diaphragm) exists between the process fluid and the valve stem.
Seals around pumps generally occur where a rotating shaft meets the stationary casing. Two main types of seals are used; packed seals and mechanical seals. Mechanical seals that are well-maintained are superior to packed seals, but because they are expensive and time-consuming to repair, a second packed or mechanical seal is commonly used. Sealless designs for pumps include canned motor pumps, where the bearings are in the process fluid, and diaphragm pumps, where a moving diaphragm pumps the fluid. Magnetic pumps are also available in which the impeller is driven by magnets. Mechanical seals for pumps have improved greatly over the last 10–20 years, making them a viable alternative for leakless pumps for many applications (Adams, 1991).
Compressors are similar to pumps in that they move fluid, but in this case the fluid is a gas. Both packed seals and mechanical seals are used, but packed seals are found only on reciprocating devices. Mechanical seals are not necessarily of the contact design used for pumps, but rather include carbon rings, labyrinth-type, and oil film seals.
The emissions control effectiveness of various emission reduction measures is shown in Table 9.6-4 as a percentage reduction. Leakless technologies are 100% effective in eliminating emissions for properly functioning equipment, but are expensive to purchase and maintain. For example, pumps with dual mechanical seals are estimated to have an amortized annual cost roughly 10 times quarterly or monthly LDAR. Compared to facilities that do not have emissions reduction programs, fugitive emissions from a moderately-sized petroleum refinery can be reduced by approximately 70% by using the most effective reduction techniques shown in Table 9.6-4 (Allen and Rosselot, 1997). Similarly, for SOCMI facilities, fugitive emission reductions are expected to be around 60–70%.
Table 9.6-4 Effectiveness of Various Fugitive Emission Reduction Techniques.

9.7 Pollution Prevention Assessment Integrated with Haz-Op Analysis
The hazard and operability study (HAZ-OP) is a formal procedure that can be applied to individual chemical process units to identify potential hazards (AIChE, 1985). Hazards are not only identified, but their possible causes are also investigated, the consequences of those hazards are defined, and actions to mitigate the hazard are summarized. It can be applied to a new process design before construction begins or can be applied to existing process units to improve safety performance. The study is typically conducted by a team of engineering and operations personnel who are familiar with the process. During the study, team members identify potential hazards through a structured examination of the design. One of the members of the team is assigned the task of recording the hazards and their suggested solutions. In this text, we demonstrate a limited use of HAZ-OP for the purpose of identifying hazards when process changes are made for pollution prevention. We do not identify actions to mitigate those hazards. Examples of complete HAZ-OP analyses can be found in standard textbooks on process safety (Crowl and Louvar, 1990).
The methodology for a HAZ-OP study is to apply a series of guide words to the process design intention. The design intention relates to what the certain steps or units in the process are intended to do. Examples of process intentions are a) cooling water flow through a reactor or distillation condenser, b) inerting system for a reactor, separator, or storage tank, or c) air supply for pneumatically-driven process control valves. The guide words associated with process intentions are shown in Table 9.7-1. For example, the use of the guideword “NO” in the process intention “cooling water flow through a reactor” would indicate a loss of cooling water. The consequences of this might be an overheated reactor, a run-away reaction, or, potentially, an explosion. If we apply each guideword to a process intention, we arrive at a set of possible consequences. The HAZ-OP approach is applied to each unit and to each pipeline into or out of each unit, and continues until every unit in the processes has been analyzed.
For large and complex processes, this approach can be very time-consuming and often tedious. Nonetheless, this procedure is finding increasing use in the chemical industry.
Table 9.7-1 HAZ-OP Procedure Guide Words (Adapted from Crowl and Louvar, 1990).
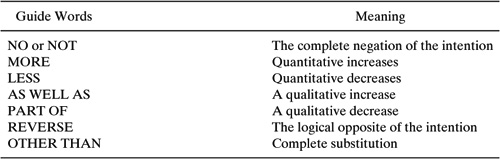
Example 9.7-1 Safety Aspects of Storage Tank Pollution Prevention
Consider the storage tanks shown in Figure 9.7-1. A facility is considering replacing the existing external floating-roof tank with an internal floating-roof tank in order to reduce uncontrolled volatile organic compound emissions. Calculate the toluene emission reductions for the tank configurations outlined in Example 9.6-1 using the TANKS software. Conduct a limited HAZ-OP analysis for each tank configuration to evaluate the hazards for explosion of accumulated vapors within each tank. The inlet and outlet pumps are intended to fill and then empty the tanks to the desired levels. The inerting system on the internal floating-roof tank is intended to maintain an oxygen-free environment in the headspace above the floating roof and below the tank roof.
Figure 9.7-1 Schematic diagram of storage tank alternatives.
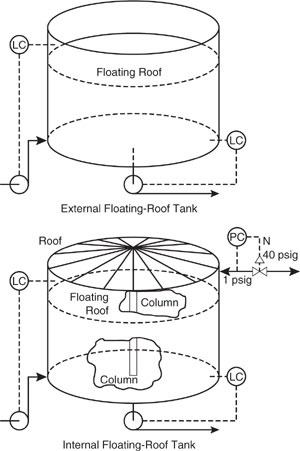
Emissions Analysis:
The TANKS program allows the user to quickly calculate the annual emission rate for both tank types. The results are
External Floating-Roof Tank: 1,102.7 lb/yr.
Internal Floating-Roof Tank: 66.2 lb/yr.
The Internal floating-roof tank shows nearly a 20-fold reduction in toluene emission rate.
HAZ-OP Analysis (limited):
The results of the HAZ-OP analysis of both storage tank configurations is shown in Table 9.7-2. The hazards associated with the pumps and streams entering and exiting each tank are identical. The internal floating-roof storage tank has additional hazards associated with the interting gas because of the need to maintain a non-flammable mixture above the tank surface. The flash point for toluene is only 40 F, therefore, it is necessary to preclude air from the space above the floating roof. Vapor accumulation sufficient for ignition in air might be created by the action of the floating roof and the possibility of faulty roof seals.
The storage tank pollution prevention example above exhibited a higher level of safety hazard for the internal floating-roof tank compared to the external floating-roof tank. The additional complexity of the internal floating-roof tank introduced more possible modes of failure. Although the safety hazards associated with any process modification for pollution prevention would have to be evaluated on a case-by-case basis, many would result in a more complicated process. The rule of thumb in avoiding safety hazards in processes is to “keep it simple.” The additional complexity of many pollution prevention applications makes safety assessment an important component of waste and risk reduction efforts in chemical process designs.
9.8 Integrating Risk Assessment With Process Design— A Case Study
Thus far in Chapter 9, we have incorporated environmental, health, and safety concerns into the design and operation of unit operations. We have used quantitative assessment measures only to a limited extent. It is very useful to provide a more quantitative risk assessment capability for the evaluation and optimization of unit operations. To this end, a screening-level risk assessment methodology is presented in this section using the Tier 1 assessment method presented in Chapter 8.
One important application could be screening of byproducts generated in a chemical reactor. Decisions regarding optimum reactor operation can then be made based on the risks posed by the individual byproducts generated rather than on just the mass rate of generation for each component. The case study deals with choosing residence time in a fluidized bed reactor for the production of acrylonitrile.
Table 9.7-2 Limited HAZ-OP Analysis of storage tank pollution prevention.
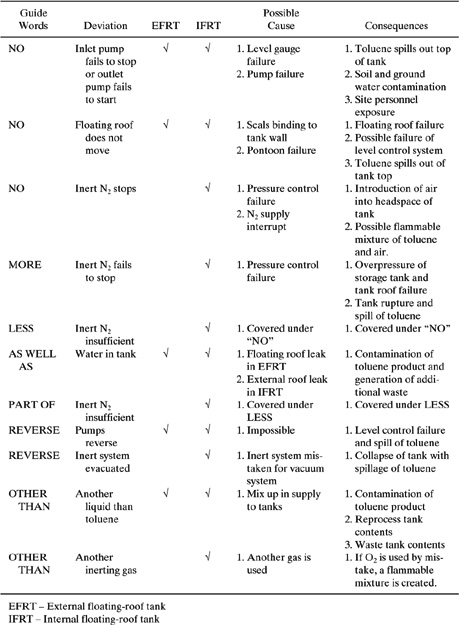
Acrylonitrile Reactor (Hopper et al., 1992) Risk-Based Input-Output Analysis of a Reactor.
Acrylonitrile is produced in a fluidized-bed reactor containing a catalyst (Bi-Mo-O).
The main reaction for acrylonitrile is ammonoxidation represented by
In addition there are five other possible side reactions including
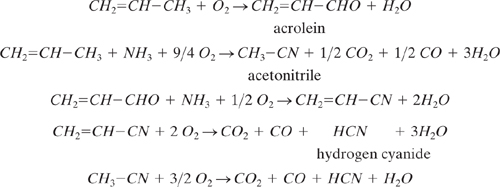
Hopper and coworkers (Hopper et al., 1992) constructed a set of reactor models for the above set of chemical reactions assuming first-order reaction kinetics with respect to the reactant, product, and byproduct species. The model also included mole balance and energy balance equations for the reactor. The model was used to predict the effects of reaction temperature, residence time, and reactor type—continuous flow stirred tank reactor (CSTR), plug flow reactor (PFR), and fluidized bed reactor (FBR)—on the generation of reaction byproducts in the acrylonitrile reaction. Here we illustrate the use of the FBR model predictions in determining the optimum residence time for minimum waste generation and acceptable economic performance. The evaluation is based on both mass generation as well as risk generation approaches.
The predicted concentrations of feed, product, and byproduct species from the reactor as a function of reactor residence time are shown in Figure 9.8-1. These results show that acrylonitrile concentration increases with residence time up to about 10 seconds. Thereafter, the increase in acrylonitrile concentration is slower and after 15 seconds, there is no further increase. Reactants (propylene and ammonia) continue to decline with increasing reactor residence time due to conversion of the reactant to product and byproduct species. Byproducts, hydrogen cyanide (HCN) and acetonitrile, exhibit complex profiles with respect to residence time. HCN is generated in significant amounts only above about 5 seconds residence time. HCN is the dominant reaction byproduct on a mass basis at higher residence times. Acetonitrile is generated in higher amounts than HCN at low residence times, but tends to remain at a constant concentration as residence time increases to 20 seconds. Based on these results, the authors (Hopper et al., 1992) recommended operating the reactor at a temperature of 400–480 °C, with a reactor residence time of 2–10 seconds, and to use a fluidized-bed reactor.
Figure 9.8-1 Effect of reactor residence time on the conversion of propylene and ammonia to product (acrylonitrile) and byproducts (hydrogen cyanide (HCN), and acetonitrile). The model is of a fluidized-bed reactor at 400 C. Byproduct generation is shown on a mass basis.
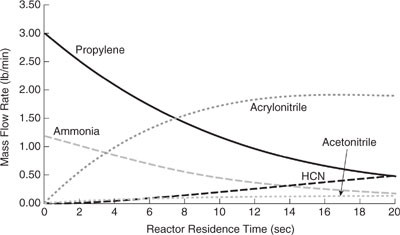
Figure 9.8-2 Effect of reactor residence time on the conversion of propylene to product (acrylonitrile) and byproducts (hydrogen cyanide (HCN), and acetonitrile). The model is of a fluidized-bed reactor at 400 °C. Byproduct generation is shown on a risk basis.

Figure 9.8-3 The total environmental index (Equation 8-2) as a function of reactor residence time for acrylonitrile production via the ammonoxidation pathway.
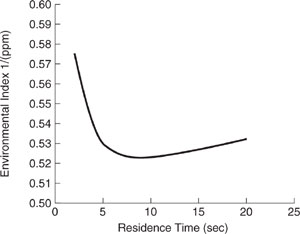
A presentation of the same reactor results on a risk basis is shown in Figure 9.8-2. In generating this figure, stoichiometric coefficients at each residence time were calculated using the data shown in Figure 9.8-1 by taking the ratio of the mass flow rates of reactants and byproducts with respect to acrylonitrile. In addition, Equation 8-2 was employed using the TLV values shown in Table 8.2-7. The environmental index of the product acrylonitrile dominates the other environmental indexes shown in Figure 9.8-2, regardless of the reactor residence time. The total environmental index for this reactor is shown in greater detail in Figure 9.8-3. There is a minimum in the total index at a residence time of 10 seconds. The raw material cost per mass of acryolnitrile produced is shown in Figure 9.8-4 as a function of reactor residence time. It is apparent that the costs of raw materials is less than the cost of acrylonitrile when the residence time in the reactor is greater than 5 seconds.
This case study demonstrates that the “Tier 1” environmental assessment from Chapter 8 combined with a screening economic analysis provides valuable insights into the overall performance of the reactor design (residence time). There is little economic benefit in operating at residence times greater than 10 seconds, and the total environmental risk index is a minimum at 10 seconds. Therefore, a residence time of 10 seconds is a logical operating point for this reactor and reaction system.
Figure 9.8-4 Raw materials costs per mass of acrylonitrile produced in ammonoxidation of propylene.
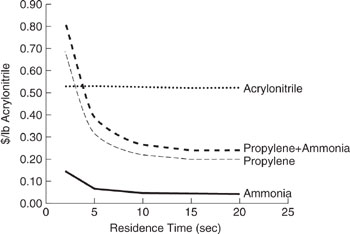
Questions for Discussion
1. This chapter has considered pollution prevention alternatives for a variety of types of unit operations—reactors, separation devices, storage tanks and others. For a typical chemical process, which of these unit operations will be responsible for the majority of the emissions? Does your answer depend on the type of pollutant or the environmental medium to which the pollutant is released? (Refer to the emission inventories in Chapter 8.)
2. The pollution prevention alternatives identified in this chapter frequently result in reduced energy use and reduced material use. If the environmental improvements result in a design that uses less energy and less materials, why might a design engineer not choose to implement these options?
3. In this chapter, pollution prevention alternatives have been considered for individual unit operations. Is it possible that a pollution prevention strategy implemented for one unit operation may increase wastes and emissions in another unit operation? (Consider, as one example, the addition of emulsifiers in tanks to reduce solids formation. Can you think of other examples?)
References
Absi-Halabi, W., Stanislaus, A., and Qabazard, H., “Trends in catalysis research to meet future refining needs,” Hydrocarbon Processing, Feb. 1997, p. 45-55.
Adams, W.V., “Control fugitive emissions from mechanical seals,” Chemical Engineering
Aggarwal, A. and Caneba, G.T., “Environmental Aspects of Polymers,” report submitted to the Center for Clean Industrial and Treatment Technologies, Michigan Technological University, Houghton, MI, 1993.
AIChE, American Institute of Chemical Engineers, “Guidelines for Hazard Evaluation Procedures,” New York, NY, 1985.
Allen, D.T., “The role of catalysis in industrial waste reduction,” in Industrial Environmental Chemistry, ed. D.T. Sawyer and A.E. Martell, Plenum Press, New York, NY, p. 89-99, 1992.
Allen, D.T. and Rosselot, K.S., Pollution Prevention for Chemical Processes, John Wiley and Sons, New York, NY, 1997.
API, American Petroleum Institute, “Waste Minimization in the Petroleum Industry: A compendium of Practices,” API Publication 849-00020, Washington, DC, 1991a.
API, American Petroleum Institute, “The Generation and Management of Wastes and Secondary Materials in the Petroleum Refining Industry: 1987-1988,” API Publication 4530, Washington, DC, 1991b.
Bansal, I.K., “Concentration of oily and latex waste waters using ultrafiltration inorganic membranes,” Industrial Water Engineering, October-November 1976.
Barton, A.F.M., CRC Handbook of Solubility Parameters and Other Cohesion Parameters, CRC Press Incorporated, Boca Raton, FL, 1983.
Becker, M, Farag, I.H., Hayden, N. (1996) (editors), Motivating Pollution Prevention Concepts: Homework Problems for Engineering Curricula, Northeast Waste Management Officials’ Association (NEWMOA), 129 Portland Street, Suite 502, Boston, MA 02114, phone: 617-367-8558.
Bjorklund, M.C. and Carr, R.W., presented at the AIChE National Meeting, Chicago, IL, paper 195a, 1996.
Brestel, R. et al., “Minimize fugitive emissions with a new approach to valve packing,” Chemical Engineering Progress, 87(8), 42-47, August 1991.
Chella, R. and Ottino, J.M., “Conversion and selectivity modifications due to mixing in unpremixed reactors,” Chemical Engineering Science, Vol. 39, No. 3, pp. 551-567, 1982.
Crowl, D.A. and Louvar, J., Chemical Process Safety: Fundamentals with Applications, Prentice Hall, Englewood Cliffs, NJ, 1990.
Cutter, L., AIChE Journal, “Flow and turbulence in a stirred tank,” Vol. 12, p. 35, 1966.
DeSimone, J.M, Guan, Z.G., and Elsbernde, C.S., “Synthesis of fluoropolymers in supercritical carbon dioxide,” Science, Vol. 257, 14 Aug. 1992, p. 945 - 947.
DeSimone, J.M. Maury, E.E., Menceloglu, Y.Z., McClain, J.B., Romack, R.J., and Combes, J.R., “Dispersion polymerizations in supercritical carbon dioxide,” Science, Vol. 265,15 July, 1994, p. 356–359.
Dimmick, W.F. and Hustveldt, K.C., “Equipment Leaks of VOC: Emissions and Their Control,” paper No. 84-62.1 presented at the 77th Annual Meeting of the Air Pollution Control Association, San Francisco, June 24-29, 1984.
Elias, H-G., Macromolecules, Volume 2: Synthesis, Materials, and Technology, Plenum Press, New York, 1984.
Flick, E.W. ed, Industrial Solvents Handbook, 3rd ed., Noyes Data Corporation, Park Ridge, N.J., 1985.
Fogler, H.S., Elements of Chemical Reaction Engineering, 2nd Edition, Prentice Hall, Englewood Cliffs, NJ, 1992.
Gates, B., “Catalysis,” in Encyclopedia of Chemical Technology, 4th edition, Volume 5, Editor Kroschwitz, J.I., John Wiley and Sons, New York, NY, p. 350, 1993.
Hansen, C.M., Hansen Solubility Parameters: A Users Handbook, CRC Press, Boca Raton, Florida, 2000.
Hopper, J.R., Yaws, C.L., Ho, T.C., Vichailak, M., and Muninnimit, A., “Waste minimization by process modification,” in Industrial Environmental Chemistry, Sawyer, D.T., and Martell, A.E. ed., Plenum Press, New York, NY, p. 25–43, 1992.
Humphrey, J.L., “Separation processes: Playing a critical role,” Chemical Engineering Progress, 91(10), 31-41, October 1995.
Jones, E.O., “Treating metal-bearing spent acids with a transportable test system,” paper presented at the 11th AESF/EPA Conference on Environmental Control for the Metal Finishing Industry, Orlando, FL, 1990.
Kolmogoroff, A.N., Compt. Rend. Acad. Sci. U.R.S.S. (N.S.), vol. 30, p. 301, 1941, “The local structure of turbulence in incompressible” and “On degradation of isotropic turbulence in an incompressible viscous liquid,” Vol. 31, p. 538-540 1941.
Komiya, K. et al., “New process for producing polycarbonate without phoshene and methylene chloride,” in Green Chemistry: Designing Chemistry for the Environment, Anastas, P.T. and Williamson, T.C., Eds., ACS Symposium Series 626, American Chemical Society, Washington, DC, 1996, p 20-32.
Levenspiel, O., Chemical Reaction Engineering, 3rd Edition, John Wiley & Sons, New York, NY, 1999.
Manzer, L.E., “Chemistry and catalysis, keys to environmentally safer processes,” in Benign by design alternative: Synthetic Design for Pollution Prevention, Anastas, P.T. and Farris, C.A., eds., ACS Symposium Series 577, American Chemical Society, Washington, DC, pp. 144-154, 1994.
Morgenstern, D.A., LeLacheur, R.M., Morita, D.K., Borkowsky, S.L., Feng, S., Brown, G.H., Luan, L., Gross, M.F., Burk, M.J., and Tumas, W., et al., “Supercritical carbon dioxide as a substitute solvent for chemical synthesis and catalysis,” in Green Chemistry: Designing Chemistry for the Environment, Ed. Anastas, P.T. and Williamson, T.C., ACS Symposium Series 626, American Chemical Society, Washington, DC, 1996, p. 132-151.
Mulholland, K.L. and Dyer, J.A., Pollution Prevention: Methodology, Technologies and Practices, American Institute of Chemical Engineers, New York, 1999.
Mulholland, K.L., personal communication, 2000.
Nelson, K.E., “Practical techniques for reducing waste,” in Industrial Environmental Chemistry, ed. D.T. Sawyer and A.E. Martell, Plenum Press, New York, NY, p. 3-17, 1992.
Null, H.R., “Selection of a separation process,” in Handbook of Separation Process Technology, Rousseau, R.W., Ed., Wiley and Sons, New York, NY, p. 982-995, 1987.
Palepu, P.T., Chauhan, S.P., and Ananth, K.P., “Separation technologies,” in Industrial Pollution Prevention Handbook, ed. Freeman, H.M., McGraw-Hill, New York, NY, p. 935, 1995.
Paul, E.L. and Treybal, R.E., “Mixing and product distribution for a liquid-phase, second-order, competitive-consecutive reaction,” AIChE Journal, Vol. 17, No. 3, pp. 718-724, 1971.
Perry, R.H. and Green, D.W., Eds., Perry’s Chemical Engineers’ Handbook, 6th Ed., McGraw-Hill, New York, 1984.
Radecki, P.P., Crittenden, J.C., Shonnard, D.R., and Bulloch, J.L., Eds., Emerging Separator and Separative Reaction Technologies for Process Waste Reduction, Center for Waste Reduction Technologies, American Institute of Chemical Engineers, New York, NY, pg. 319, 1999.
Randall, P.M., “Pollution prevention strategies for the minimizing of industrial wastes in the VCM-PVC industry,” Environmental Progress, Vol. 13(4), 269-277, 1994.
Rosselot, K.S. and Allen, D.T., “Upgrading process water to prevent pollution in petroleum refining,”Pollution Prevention Review, vol. 6(1), 95–99, 1996.
Sullivan, D.A., Solvents - Industrial, in Encyclopedia of Chemical Technology, Vol. 22, Kroschwitz, J.I. Executive Editor, John Wiley and Sons, 529–571, 1996.
Tonkovich, A.L.Y., Carr, R.W., and Aris, R., “Enhanced C2 yields from methane oxidative coupling by means of a separative chemical reactor,” Science, 262, 221-223, 1993.
Tonkovich, A.L.Y. and Carr, R.W., “A simulated countercurrent moving bed chromatographic reactor for the oxidative coupling of methane: Experimental results,” Chemical Engineering Science, 49, 4645-4656, 1994.
Tonkovich, A.L.Y., “Impact of Catalysis on the Production of the Top 50 U.S. Commodity Chemicals,” PNL-9432, report prepared for the U.S. Department of Energy, EE-Office of Industrial Technology, 1994.
Tonkovich, A.L.Y. and Gerber, M.A., “The Top 50 Commodity Chemicals: Impact of Catalytic Process Limitations on Energy, Environment, and Economics,” PNL-10684, report prepared for the U.S. Department of Energy, EE#-Office of Industrial Technology, 1995.
Tonkovich, A.L.Y., Zilka, J.L., Jimenez, D.M., Roberts, G.L., and Cox, J.L., “Experimental investigations of inorganic membrane reactors: a distributed feed approach for partial oxidation reactions,” Chemical Engineering Science, 51(5), 789-806, 1996.
Tucker, S.P. and Carson, G.A., “Deactivation of hazardous chemical wastes,”Environmental Science and Technology, 19(3), 215-220, 1985.
Upson, L.L. and Lomas, D.A., “Catalysts (Regeneration),” in Encyclopedia of Chemical Technology, 4th edition, Volume 5, Editor Kroschwitz, J.I., John Wiley and Sons, New York, NY, p. 431, 1993.
US EPA, United States Environmental Protection Agency, Fugitive Emission Sources of Organic Compounds—Additional Information on Emissions, Emission Reductions, and Costs, Publication EPA-450/3-82-010, Research Triangle Park, NC, 1982.
US EPA, United States Environmental Protection Agency, Emission Factors for Equipment Leaks of VOC and HAP, Publication EPA-450/3-86-002, Research Triangle Park, NC, January 1986.
US EPA, United States Environmental Protection Agency, DuPont Chambers Works Waste Minimization Project, EPA/600/R-93/203, 1993a.
US EPA, United States Environmental Protection Agency, “Protocols for Equipment Leak Emission Estimates,” available through National Technical Information Service (NTIS) as PB93-229219, 1993b.
US EPA, United States Environmental Protection Agency, Waste Minimization Prioritization Tool (WMPT), EPA 530-R-97-019, 1997.
US EPA, Compilation Of Air Pollutant Emission Factors, Volume I, Fifth Edition, AP-42, Air CHIEF CD-ROM, ClearingHouse For Inventories And Emission Factors, Air CHIEF CD-ROM, (EFIG/EMAD/OAQPS/EPA), Version 6.0, U.S. Environmental Protection Agency, Research Triangle Park, NC, EPA-454/F-98-007, 1998.
US EPA, Technology Transfer Network (TTN), United States Environmental Protection Agency, Office of Air Quality Planning and Standards, Technology Transfer Network website, TANKS storage tank emission estimation program, http://www.epa.gov/ttn/chief/tanks.html, June 1, 1999.
Wankat, P.C., Equilibrium Staged Separations, Prentice Hall, Englewood Cliffs, NJ, p. 707, 1988.
Werschulz, P., “New membrane technology in the metal finishing industry,” in Toxic and Hazardous Waste, ed. Klugman, I.J., Technomic Publishing, Lancaster, PA, 1985.
Problems
1. Solvent Choice for Caffeine Extraction from Coffee Beans
About 20% of the coffee consumed in the United States is decaffinated. There are many solvents and processes developed over the past century to accomplish this step. Critical issues in choosing a solvent are the caffeine/solvent affinity, the cost of the solvent, the ease of caffeine recovery from the solvent, safety aspects, and environmental impacts. The original process used a synthetic organic solvent to extract caffeine from un-roasted coffee beans. These solvents included trichloroethylene (C2HCl3) and methylene chloride (CH2Cl2). Today, caffeine is extracted using “natural” solvents including supercritical carbon dioxide, ethyl acetate (naturally found in coffee), oils extracted from roasted coffee, and water. Using Material Safety Data Sheets as a source of information, rank order these solvent candidates based only on their toxicological properties. Do not consider the “extracted oils” since the identity of these is not available. Use PEL and/or LD50 (rat) toxicological data.
Information Source on Coffee Extraction: Encyclopedia of Chemical Technology, Volume 6, Coffee chapter, John Wiley and Sons, 1991 (4th edition) and 1978 (3rd edition).
2. Optimum Plug Flow Reactor Design for a Series Reaction
A compound A reacts with S to form a desired product B. B also reacts with S to give a hazardous waste byproduct C that must be disposed of at great cost. The series reaction can be described as
![]()
The reactions are irreversible and because they occur in large excess of S, are first order,
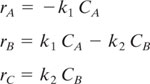
where k1 = 0.2 min-1 and k2 = 0.1 min-1. A feed stream of volumetric flow rate F = 100 gal/min contains reactant A at a concentration of CAo = 0.1 lbmole/gal.
(a) Determine the reactor volume in ft3 that will maximize the yield of B and minimize the generation of C, and calculate the concentrations of A, B, and C in the reactor effluent stream. Assume that the density of the fluid is unaffected by the reaction.
(b) Describe the situation if S were not present in large excess. For example, would the potential be greater or less for creating the hazardous waste component, C?
(Adapted from a problem by Alfred Donatelli in Motivating Pollution Prevention Concepts: Homework Problems for Engineering Curricula, editors M. Becker, I. Farag, and N. Hayden, 1996).
3. Energy Efficient Extraction Coupled with Distillation
Background:
There are many examples of liquid extraction coupled with distillation in the chemical process industry. One important example is the extraction of aromatic components (benzene, toluene, xylenes) from paraffins in the refining of petroleum using a suitable solvent. A listing of potential solvents for this purpose is shown in Perry and Green (1984, pp. 15.9 to 15.13), along with values for the distribution ratio, Kd y/x, where y and x are the mass fractions of solutes in the extract and raffinate phases, respectively. For this application, values for Kd tend to vary from 0.1 to 1.0. The choice of extraction solvent will affect the operation of the downstream distillation column in the following ways: a) by affecting the feed flow rate and solute composition that is fed to the distillation column and b) by affecting the relative volatility of the distillate compared to the bottoms product.
Problem:
In this problem, we wish to investigate the effects of extraction solvent choice on the consumption of energy in this process. Refer to the following diagram in solving this problem. We will assume that the major energy-consuming element is the reboiler of the distillation column.
(a) Determine the change in reboiler duty, QR = λV –, for Kd values of 0.3, 0.5, and 0.7 in the extractor for a constant relative volatility in the distillation column of αP,S = 3. The subscripts P and S refer to product and solvent, respectively and where is the latent heat of vaporization of the liquid in the reboiler and V is the stripping section vapor flow rate.

(b) Determine the change in reboiler duty for αP,S = 3, 5, and 7 in the distillation column for a constant value of Kd = 0.4 in the extractor.
(c) Which parameter, Kd or αP,S, has the greatest influence on QR?
(d) Would higher or lower values of Kd or αP,S result in a more energy-efficient process?
For this problem, make the following assumptions. The flow rates of raffinate and extract phases in the extractor are constant. The ratio of raffinate to extract flow rate must be 0.8 times the minimum ratio: (R/E) = 0.8 (R/E)min. Assume that the feed to the distillation column is a saturated liquid. Use a reflux ratio (L/D) of 1.2 times the minimum (L/D)min. The distillate mass fraction is xD 0.99 and the bottoms is xB = 0.001. Use a feed flow rate to the extractor of 1 kg/hr as a basis for these calculations. Use a latent heat of vaporization for the liquid in the reboiler of λ = 100 kcal/kg.
4. Effect of Storage Tank Type on Volatile Organic Compound (VOC) Emission Rates.
A liquid benzene product stream, having an annual throughput of 516,600 gal/yr, is to be recovered from a gaseous waste stream at a facility in the vicinity of Detroit, MI. Using the TANKS software (Appendix F, US EPA TTN, 1999, http://www.epa. gov/ttn/chief),
(a) Calculate the uncontrolled annual emissions for a new tank design. Each tank is colored white and the paint condition is good.
(b) What is the percentage reduction in benzene emission rates for both of the floating-roof tanks compared to the vertical fixed-roof tank?
(c) Compare answers to Example 9.6-1.
Each of the tank types have the following dimensions and conditions.
Vertical Fixed-Roof Tank: Height = 20 ft, Diameter = 12 ft, Working Volume = 15,228.53 gallons, Maximum Liquid Level = 18 ft, Average Liquid Level = 10 ft, no heating, domed roof of height 2 ft and diameter of 12 ft, vacuum setting of - .03 psig and pressure setting of .03 psig.
Internal Floating-Roof Tank: Height = 20 ft, Working Volume = 15,228.53 gallons, self-supporting roof, internal shell condition of light rust, primary seal is a mechanical shoe, secondary shoe is shoe-mounted, deck type is welded, deck fitting category is typical.
Domed External Floating-Roof Tank: same as Internal Floating-Roof Tank.
5. Net VOC Emissions Reduction from Painting an Existing Storage Tank.
You wish to reduce the “standing” or “breathing” losses of toluene from an existing vertical fixed-roof storage tank that has a grey/medium color paint in poor condition. One pollution prevention strategy would be to repaint the existing tank a lighter color. In answering the following questions, use the TANKS software (Appendix F, US EPA TTN, 1999, http://www.epa.gov/ttn/chief).
The tank has the following dimensions and conditions.
Vertical Fixed-Roof Tank: Height = 20 ft, Diameter = 12 ft, Working Volume = 15,228.53 gallons, Maximum Liquid Level = 18 ft, Average Liquid Level = 10 ft, no heating, domed roof of height 2 ft, vacuum setting of - .03 psig and pressure setting of .03 psig. The throughput is 516,600 gal/yr, and the location is Dearborn, MI.
(a) What is the annual toluene emission rate for the original tank having the poor condition paint and what is the percentage of the annual emission rate caused by standing losses?
(b) How much net emission reduction can be expected if the grey/medium color (poor condition) vertical fixed-roof tank is painted white? Assume that the paint is an oil-based paint with 50% by volume toluene solvent, that all of the toluene in the paint is emitted after its application, and that one gallon covers 100 square feet of tank external surface. Assume that the dome roof is flat for this calculation.