
Chapter 13
Life-Cycle Concepts, Product Stewardship and Green Engineering
13.1 Introduction to Product Life Cycle Concepts
Products, services, and processes all have a life cycle. For products, the life cycle begins when raw materials are extracted or harvested. Raw materials then go through a number of manufacturing steps until the product is delivered to a customer. The product is used, then disposed of or recycled. These product life-cycle stages are illustrated in Figure 13.1-1, along the horizontal axis. As shown in the figure, energy is consumed and wastes and emissions are generated in all of these life cycle stages.
Processes also have a life cycle. The life cycle begins with planning, research and development. The products and processes are then designed and constructed. A process will have an active lifetime, then will be decommissioned and, if necessary, remediation and restoration may occur. Figure 13.1-1, along its vertical axis, illustrates the main elements of this process life cycle. Again, energy consumption, wastes, and emissions are associated with each step in the life cycle.
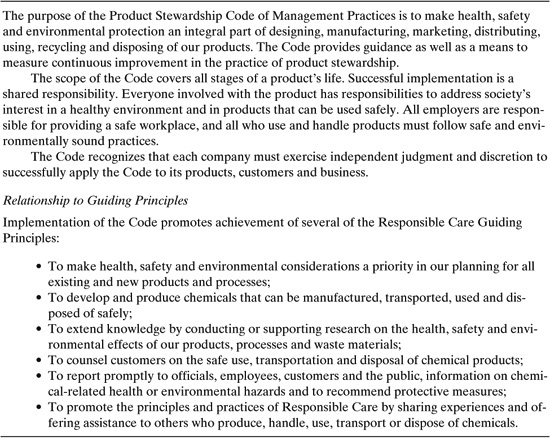
Traditionally, product and process designers have been concerned primarily with product life-cycle stages from raw material extraction up to manufacturing. That focus is changing. Increasingly, chemical product designers must consider how their products will be recycled. They must consider how their customers use their products. Process designers must avoid contamination of the sites at which their processes are located. Simply stated, design engineers must become stewards for their products and processes throughout their life cycles. These increased responsibilities for products and processes throughout their life cycles have been recognized by a number of professional organizations. Table 13.1-1 describes a Code of Product Stewardship developed by the Chemical Manufacturers’ Association (now named the American Chemistry Council).
Figure 13.1-1 Product life cycles include raw material extraction, material processing, use, and disposal steps, and are illustrated along the horizontal axis. Process life cycles include planning, research, design, operation, and decommissioning steps and are shown along the vertical axis. In both product and process life cycles, energy and materials are used at each stage of the life cycle and emissions and wastes are created.
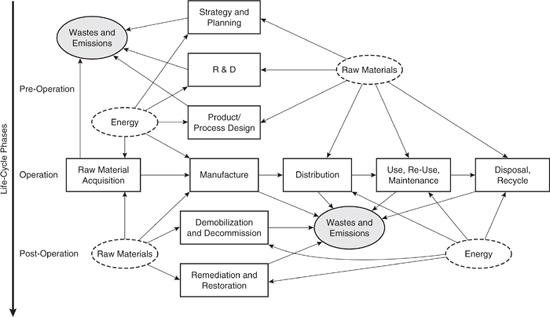
Table 13.1-1 The Chemical Manufacturers’ Association (American Chemistry Council) Product Stewardship Code.
Effective product and process stewardship requires designs that optimize performance throughout the entire life cycle. This chapter provides an introduction to tools available for assessing the environmental performance of products and processes throughout their life cycle. The primary focus is on product life cycles, but similar concepts and tools could be applied to process life cycles. Sections 13.2 and 13.3 present quantitative tools used in product life cycle assessments (LCAs). Section 13.4 presents more qualitative tools. Section 13.5 describes a number of applications for these tools and Section 13.6 summarizes the main points of the chapter.
13.2 Life-Cycle Assessment
Life-cycle studies range from highly detailed and quantitative assessments that characterize, and sometimes assess, the environmental impacts of energy use, raw material use, wastes, and emissions over all life stages, to assessments that qualitatively identify and prioritize the types of impacts that might occur over a life cycle. As shown in this chapter, different levels of detail and effort are appropriate for the different ways the life-cycle information is used. In this section, the steps involved in conducting detailed, highly quantitative life-cycle assessments are described.
13.2.1 Definitions and Methodology
There is some variability in life-cycle assessment terminology, but the most widely accepted terminology has been codified by international groups convened by the Society for Environmental Toxicology and Chemistry (SETAC) (see, for example, Consoli, et al., 1993). Familiarity with the terminology of life-cycle assessment makes communication of results easier and aids in understanding the concepts presented later in this chapter. To begin, a life-cycle assessment (LCA) is the most complete and detailed form of a life-cycle study. A life-cycle assessment consists of four major steps.
Step 1: The first step in an LCA is to determine the scope and boundaries of the assessment. In this step, the reasons for conducting the LCA are identified; the product, process, or service to be studied is defined; a functional unit for that product is chosen; and choices regarding system boundaries, including temporal and spatial boundaries, are made. But what is a functional unit, and what do we mean by system boundaries? Let’s look first at the system boundaries.
The system boundaries are simply the limits placed on data collection for the study. The importance of system boundaries can be illustrated by a simple example. Consider the problem of choosing between incandescent light bulbs and fluorescent lamps in lighting a room. During the 1990s the US EPA began its Green Lights program, which promoted replacing incandescent bulbs with fluorescent lamps. The motivation was the energy savings provided by fluorescent bulbs. Like any product, however, a fluorescent bulb is not completely environmentally benign, and a concern arose during the Green Lights program about the use of mercury in fluorescent bulbs. Fluorescent bulbs provide light by causing mercury, in glass tubes, to fluoresce. When the bulbs reach the end of their useful life, the mercury in the tubes might be released to the environment. This environmental concern (mercury release during product disposal) is far less significant for incandescent bulbs. Or is it? What if we changed our system boundary? Instead of just looking at product disposal, as shown in the first part of Figure 13.2-1, what if the entire product life cycle were considered, as shown in the second part of Figure 13.2-1? In a comparison of the incandescent and fluorescent lighting systems, if the system boundary is selected to include electric power generation as well as disposal, the analysis changes. Although mercury is a trace contaminant in coal, the burning of coal is the greatest contributor of Hg releases to the atmosphere. Since an incandescent bulb requires more energy to operate, the use of an incandescent bulb results in the release of more mercury to the atmosphere than the use of a fluorescent bulb. Over the lifetime of the bulbs, more mercury can be released to the
Figure 13.2-1 The importance of system boundaries in life-cycle assessment is illustrated by the case of lighting systems. As noted in the text, fluorescent bulbs contain mercury and if these bulbs are sent directly to municipal solid waste landfills, mercury might be released into the environment. Use of incandescent bulbs would result in a smaller amount of mercury in the municipal solid waste stream. Thus, an analysis focusing on just municipal solid waste disposal would conclude that fluorescent bulbs release more mercury to the environment than incandescent bulbs. If a larger system is considered, however, the conclusion changes. Mercury is a trace contaminant in coal, and when coal is burned to generate electricity, some mercury is released to the atmosphere. Since an incandescent bulb requires more energy to operate, the use of an incandescent bulb can result in the release of more mercury to the atmosphere than the use of a fluorescent bulb. Over the lifetime of the bulbs, more mercury can be released to the environment due to energy use than due to disposal of fluorescent bulbs.
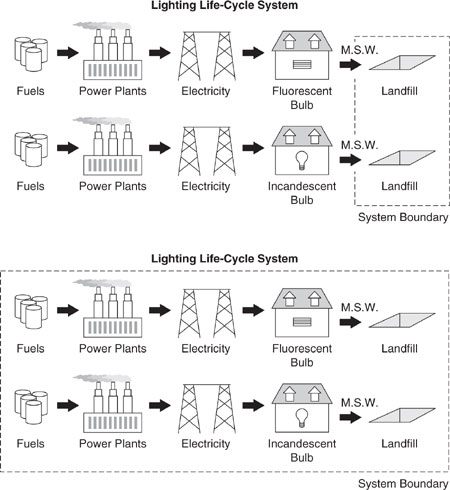
environment due to the burning of coal than due to the disposal of fluorescent bulbs. Thus, the simple issue of determining which bulb, over its life cycle, results in the release of more mercury depends strongly on how the boundaries of the system are chosen.
As this simple example illustrates, the choice of system boundaries can influence the outcome of a life-cycle assessment. A narrowly defined system requires less data collection and analysis, but may ignore critical features of a system. On the other hand, in a practical sense it is impossible to quantify all impacts for a process or product system. In our simple example, should we also assess the impacts of mining the metals, and making the glass used in the bulbs we are analyzing? In general, we would not need to consider these issues if the impacts are negligible, compared to the impacts associated with operations over the life of the equipment. On the other hand, for specific issues, such as mercury release, some of these ancillary processes could be important contributors. What is included in the system and what is left out is generally based on engineering judgement and a desire to capture any parts of the system that may account for 1% or more of the energy use, raw material use, wastes or emissions.
Another critical part of defining the scope of a life-cycle assessment is to specify the functional unit. The choice of functional unit is especially important when life-cycle assessments are conducted to compare products. This is because functional units are necessary for determining equivalence between the choices. For example, if paper and plastic grocery sacks are to be compared in an LCA, it would not be appropriate to compare one paper sack to one plastic sack. Instead the products should be compared based on the volume of groceries they can carry. Because fewer groceries are generally placed in plastic sacks than in paper sacks, some LCAs have assumed a functional equivalence of two plastic grocery sacks to one paper sack. Differing product lifetimes must also be evaluated carefully when using life-cycle studies to compare products. For example, a cloth grocery sack may be able to hold only as many groceries as a plastic sack, but will have a much longer use lifetime that must be accounted for in performing the LCA. As shown in the problems at the end of this chapter, the choice of functional unit is not always straightforward and can have a profound impact on the results of a study.
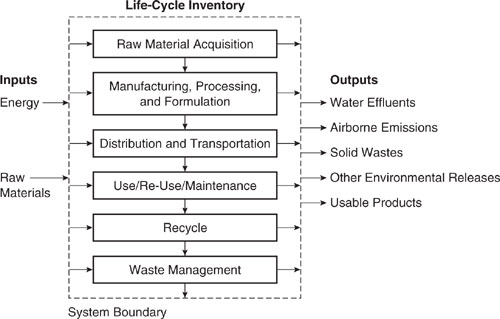
Step 2: The second step in a life-cycle assessment is to inventory the inputs, such as raw materials and energy, and the outputs, such as products, byproducts, wastes, and emissions, that occur and are used during the life cycle. This step, shown conceptually in Figure 13.2-2, is called a life-cycle inventory, and is often the most time consuming and data intensive portion of a life-cycle assessment. Examples of life-cycle inventories and more detail concerning the structure of a life-cycle inventory are provided in the next section.
Step 3: The output from a life-cycle inventory is an extensive compilation of specific materials used and emitted. Converting these inventory elements into an assessment of environmental performance requires that the emissions and material use be transformed into estimates of environmental impacts. Thus, the third step in a life-cycle assessment is to assess the environmental impacts of the inputs and outputs compiled in the inventory. This step is called a life-cycle impact assessment. This topic will be discussed in detail in Section 13.2.3.
Figure 13.2-2 Life-cycle inventories account for material use, energy use, wastes, emissions, and co-products over all of the stages of a product’s life cycle.
Step 4: The fourth step in a life-cycle assessment is to interpret the results of the impact assessment, suggesting improvements whenever possible. When life-cycle assessments are conducted to compare products, for example, this step might consist of recommending the most environmentally desirable product. Alternatively, if a single product were analyzed, specific design modifications that could improve environmental performance might be suggested. This step is called an improvement analysis or an interpretation step.
13.2.2 Life-Cycle Inventories
A life-cycle inventory is a set of data and material and energy flow calculations that quantifies the inputs and outputs of a product life cycle. Some of the values that are sought during the inventory process are objective quantities derived using tools such as material and energy balances. As is shown later in this section, other values are more subjective and depend on choices and assumptions made during the assessment.
Before describing in detail the data elements associated with a life-cycle inventory, take a moment to review the stages of a product life cycle. The first stage in a product life cycle, as shown along the horizontal axis of Figure 13.1-1, is raw material acquisition. Examples of raw material acquisition are timber harvesting, crude oil extraction, and mining of iron ore. After raw material acquisition is the material manufacture stage, where raw materials are processed into the basic materials of product manufacture. Felled trees are processed into lumber and paper, for example. Crude oil is processed into fuels, solvents, and the building blocks of plastics. These materials move to the product manufacture stage where they are used to make the final product. In this stage, paper and plastic may be made into cups, steel turned into car bodies, or solvents and pigments turned into paints. The next stage of the life-cycle stage is use. Some products, such as automobiles, generate significant emissions and wastes during use, while other products, such as grocery sacks, have negligible material and energy flows associated with the use of the product. The final life-cycle stage consists of disposal or recycling.
Recycling can occur in several ways. A product might be reused, which is what happens when a ceramic cup is washed and reused instead of being thrown away. The product could be re-manufactured, where the materials it contains are used to make another product. A newspaper, for example, might be made into another newspaper or might be shredded and used for animal bedding. Finally, products might be recycled to more basic materials, through processes such as plastics depolymerization or automobile disassembly which yield commodity materials such as monomers and steel.
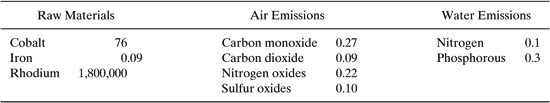
Tracking material flows, over all of the stages of a life cycle, is required for a comprehensive life-cycle inventory. Even for a simple product made from a single raw material in one or two manufacturing steps, the data collection effort can be substantial. Table 13.2-1 shows a summary of an inventory of the inputs and outputs associated with the production of one kilogram of a relatively simple product: ethylene. Consider each element in the table.
The first set of data in the table are energy requirements. These are the hydrocarbon fuels and electric power sources used in extracting the raw materials for ethylene production and for running the ethylene manufacturing process (an energy-intensive operation). The next set of data elements are referred to as feedstock energy. The main raw materials of ethylene production (oil and gas) are also fuels. The energy content of this feedstock for ethylene production is reported in units of energy rather than mass (a common practice among life-cycle study practitioners) so that it can be combined with the energy that was required in the production process.
A second set of entries in the table describes non-fuel raw material use. These include iron ore, limestone, water, bauxite, sodium chloride, clay, and ferromanganese. As shown in this table, these data are often aggregated over the life cycle and reported as aggregate quantities. Thus, water use would include water used in oil field production as well as steam used in the ethylene cracker. Some of the entries may seem obscure, but only serve to point out the complex nature of product life cycles. For example, the limestone use is due in part to acid gas scrubbing in various parts of the product life cycle.
A final set of inventory elements are the wastes and emissions. Some subjectivity is introduced here in deciding which materials to report. For example, some life cycle inventories do not report the release of carbon dioxide, a global warming gas, or the use of water. Neglecting these inventory elements implies that they are not important. More subtle subjectivity can arise in defining exactly what is and what is not a waste. Consider the example of a paper plant that debarks wood. The wood that is not used in the pulp making operation is commonly burned for energy recovery within the pulping operation. Some life-cycle practitioners may count this material as a waste that is subsequently used as a fuel. Other life-cycle practitioners might regard the material as an internal process stream. The environment does not recognize a difference between these two material accounting methods, but a life-cycle inventory applying one type of material accounting would appear to predict larger quantities of solid waste that a life-cycle inventory that employed different material accounting practices.
Table 13.2-1 Life-Cycle Inventory Data for the Production of 1 kg of Ethylene (Boustead, 1993).
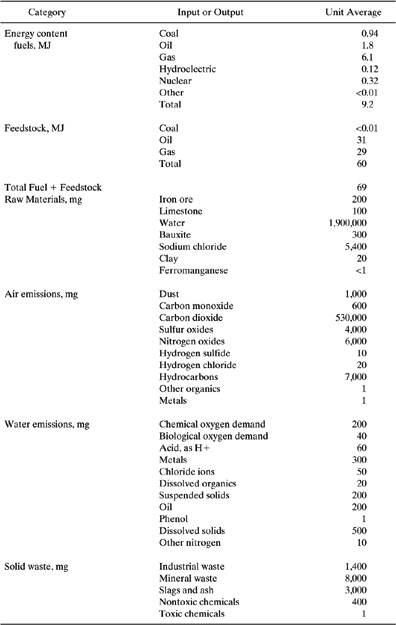
Take a moment to review the entries in Table 13.2-1 in order to obtain an idea of the level of effort necessary to inventory the inputs and outputs.
Table 13.2-1 provides life-cycle inventory data for a single material: ethylene. A complex product such as a computer would have a very complicated life-cycle framework. Computers are made up of many products (semiconductors, casing, display, etc.) that are themselves made from diverse materials, some of which require sophisticated manufacturing technologies. Life-cycle inputs and outputs for each of these sub-products would need to be inventoried in a life-cycle assessment of a computer (see, for example the life-cycle inventory of a computer workstation performed by the Microelectronics and Computer Technology Corporation (MCC, 1993)).
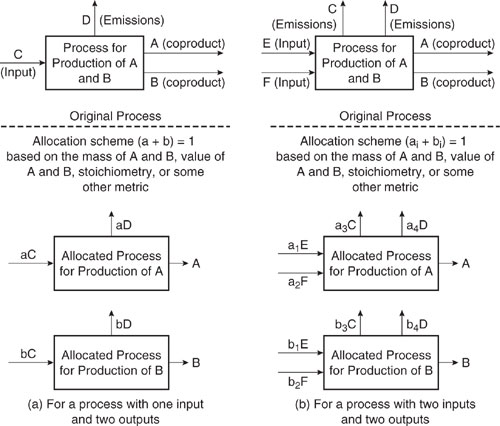
Other complexities in life-cycle inventories arise when processes have co-products. To illustrate the concept of co-product allocation, consider the allocation of inputs and outputs for the processes shown in Figure 13.2-3. The left-hand side of this figure shows a process where one input results in two products and one type of emission. If a life-cycle inventory is being performed on one of the two products, then the input and emissions must be allocated between the two products. Part of the life cycle of ethylene can be used as an example. Ethylene is made, in part, from a petroleum liquid referred to as naphtha. Naphtha is produced in petroleum refineries, which have crude oil as their primary input. The refinery produces a variety of products, including gases, gasoline, other fuels, asphalt, and the naphtha used to make ethylene. Data on emissions and crude oil usage are generally available for the refinery as a whole, and the fraction of the refinery’s crude oil use and emissions due to naphtha production must generally be assigned using an allocation procedure. One commonly used allocation procedure is based on mass of products. As shown in Figure 13.2-3, the input and emissions attributed to each of the products can be allocated based on the mass of the co-products. In the naphtha/refinery example, the crude oil usage and emissions might be assigned in the following way:
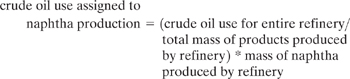
Figure 13.2-3 Allocating material use, energy use, and emissions among multiple products that are manufactured in the same processes can be difficult.
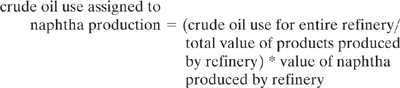
In most life-cycle inventories, allocation of material use, energy use, and emissions among co-products is based on mass. Sometimes, however, the co-product is a byproduct that would not be produced solely for its own merit, and allocation based on value might be more appropriate. As a graphic example, consider raising cattle, which produces beef and manure product streams. Clearly, the cattle rancher is in business to produce beef, not manure. Yet, if inputs and emissions to the cattle ranching were allocated based on the mass of the two products, most of the inputs and emissions would be assigned to the manure (other, less graphic examples could have been chosen, such as a pharmaceutical production process that creates a recyclable solvent by product). Clearly, in some situations, allocation based on mass is not appropriate. In such cases, inputs and emissions are sometimes allocated based on the value of the products generated.
Returning to the naphtha/refinery example, an alternative co-product allocation would be:
Issues of co-product allocation can be complex, even when single inputs exist. The situation can become more complex when the number of inputs and emissions increases. The right-hand side of Figure 13.2-3 shows a process where multiple inputs result in multiple products. Properly allocating inputs in this situation requires great understanding of the process. If there are multiple inputs and some are converted solely into one co-product, any allocation of those inputs to the other co-products would be misleading.
Another area of life-cycle inventories where subjective decisions are made is in allocation of inputs and outputs for products that are recycled or that are made from recycled goods. Some life-cycle practitioners treat products made from recycled materials as if they had no raw material requirements, while others allocate a portion of the raw material requirements from the original product to the product made from recycled materials. Consider the example of a synthetic garment made out of the polyethylene terephthalate (PET) recovered from recycled milk bottles. In performing a life-cycle inventory, it is clear that the total amount of raw materials required for the combined milk bottle/garment system has been reduced by recycling the PET. But, if a life-cycle inventory were to be done on one of these products, how would the raw materials be allocated? Would it be appropriate, for example, to assume that a garment made completely out of recycled PET required the use of no raw materials? Or, would it be more appropriate to assume that some fraction (say 50%) of the raw materials required to produce the milk bottles should be assigned to the life-cycle inventory of the garment? There are no correct answers to these questions, and different life-cycle practitioners make different assumptions. Sometimes these assumptions, which do not appear explicitly in tables of results such as Table 13.2-1, can have a significant effect on the inventory data.
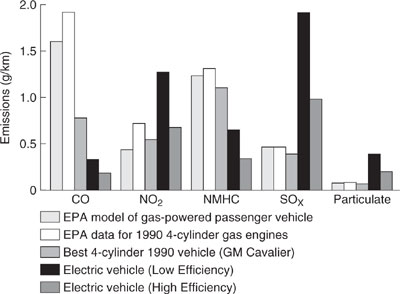
Perhaps the most important uncertainty in life-cycle inventories, however, is due to the quality of data available on the processes being inventoried and the level of aggregation of the data. Overall data quality issues, such as whether data are direct measured values or are based on engineering estimation methods, are fairly straightforward to identify and deal with. Data aggregation issues can be more subtle. Consider two examples of cases where data aggregation has impacted the findings of a life-cycle inventory. A first example is provided by the comparison of electric vehicles to gasoline-powered vehicles in the Los Angeles area. Table 13.2-2 and Figure 13.2-4 provide data summaries from two different life-cycle inventories that compared electric vehicles to gasoline-powered vehicles. The data shown in Table 13.2-2 indicate that driving an electric vehicle results in far less emission of reactive organic gases, nitrogen oxides, carbon monoxide and particulate matter, than driving an ultra-low emission vehicle (ULEV) an equivalent distance. In contrast, the data from Figure 13.2-4 indicates that an electric vehicle emits more of certain pollutants (such as NO2 and sulfur oxides) than a gasoline-powered vehicle (based on EPA emission data). Why is there such a dramatic difference? The answer is related to data aggregation. The data reported in Figure 13.2-4 were based on a life-cycle inventory that used nationally averaged emissions data for electric power generation. In contrast, the data reported in Table 13.2-2 were based on a life-cycle inventory that used emissions data for electric power generation in Southern California. Since emissions from power generation in Southern California are much lower than the average for the rest of the United States, and because a large fraction of the total emissions associated with an electric vehicle are due to the power generation required to fuel the vehicle, the studies lead to very different results. It can be presumed that both studies are technically correct, but they present a different picture of the relative benefits of electric vehicles.
Table 13.2-2 Comparison of Electric Vehicle and Gasoline Powered Vehicle Emissions Based on Electricity Generation within Southern California (Electric Power Research Institute, 1994).

Figure 13.2-4 Comparison of air pollutant emissions for gasoline- and electricity-powered motor vehicles. (Graedel and Allenby, 1995)
A second example of the importance of the level of data aggregation emphasizes the difference between well-operated and poorly operated facilities. Epstein (1995) tabulated the emissions and transfers of wastes associated with 166 refineries in the United States. She found that the total emissions and waste transfers re-ported by refineries, through the Toxic Release Inventory, averaged 7 pounds per barrel of refinery capacity. The 10% of the refineries with the highest reported emissions and waste transfers released more than 18 pounds per barrel, while the 10% of the refineries with the lowest reported emissions and transfers released less than 0.3 pounds per barrel. Thus, a life cycle inventory that used emissions data from a refinery with low emissions might lead to very different conclusions than a life cycle inventory based on data from a refinery that has high emissions.
In summary, this section has described the basic elements of a life-cycle inventory. In performing the inventory, a number of assumptions are made concerning functional units, system boundaries, co-product allocation, data aggregation methods, and other parameters. These assumptions, as illustrated in the simple examples in the text, and as illustrated by a number of the problems at the end of the chapter, can have a significant impact on the findings of a life-cycle inventory. It is prudent to define and explore these assumptions and uncertainties before arriving at conclusions based on life-cycle inventory data.
13.3 Life-Cycle Impact Assessments
Life-cycle inventories do not by themselves characterize the environmental performance of a product, process, or service. This is because overall quantities of wastes and emissions, and raw material and energy requirements must be considered in conjunction with their potency of effect on the environment. Simply stated, a pound of lead emitted to the atmosphere has a different environmental impact than a pound of iron emitted to surface waters. To develop an overall characterization of the environmental performance of a product or process, throughout its life cycle, requires that life-cycle inventory data be converted into estimates of environmental impact.
The process of producing life-cycle impact assessments is generally divided into three major steps (Fava, et al., 1992). They are:
• Classification, where inputs and outputs determined during the inventory process are classified into environmental impact categories; for example, methane, carbon dioxide, and CFCs would be classified as global warming gases.
• Characterization, where the potency of effect of the inputs and outputs on their environmental impact categories is determined; for example, the relative greenhouse warming potentials (see Chapter 11) of methane, carbon dioxide, and CFCs would be identified in this step.
• Valuation, where the relative importance of each environmental impact category is assessed, so that a single index indicating environmental performance can be calculated.
Note that the classification and characterization steps are generally based on scientific data or models. The data may be incomplete or uncertain, but the process of classification and characterization is generally objective. In contrast, the valuation step is inherently subjective, and depends on the value society places on various environmental impact categories.
Each of the three steps is discussed in more detail below.
13.3.1 Classification
As a first step in life-cycle impact assessment, inputs and outputs that were the subject of the inventory are classified into environmental impact categories. Examples of environmental impact categories are given in Table 13.3-1. Note that some impact categories might apply to very local phenomena (for example, aquatic toxicity to organisms found only in certain ecosystems), while other impact categories are global (for example, stratospheric ozone depletion and global warming).
As an example of classification, consider the list of air emissions inventoried for a study that examined polyethylene, shown in Table 13.3-2. Nitrogen oxides emissions would be classified as photochemical smog precursors, global warming gases, and acid precipitation and acid deposition precursors. Carbon monoxide emissions, on the other hand, would be classified as a smog precursor.
13.3.2 Characterization
The second step of impact assessment, characterization, quantifies impact for each inventory item by integrating the inventory amount with the potential to cause an impact; i.e., potency factor. For example, if the impact category is global warming, then relative global warming potentials can be used to weight the relative impact of emissions of different global warming gases. In Chapter 11, relative global warming potentials were described. Other weighting factors were presented for smog formation potential, atmospheric acidification potential, and other categories. Once these potency factors are established, the inventory values for inputs and outputs are combined with the potency factors to arrive at impact scores.
Table 13.3-1 Examples of Environmental Impact Categories.
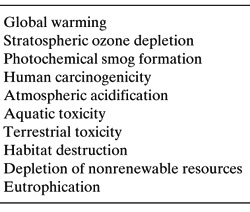
Table 13.3-2 Selected Air Emissions from the Production of One Kilogram of Polyethylene

The process of calculating impact scores was described in detail in Chapter 11. In this chapter, that discussion is not repeated. Rather, the emphasis in this chapter is on the new issues that arise when applying these impact scoring methods to life-cycle data, and on the range of variation in impact scoring systems that have been employed around the world.
Consider first the new issues that arise when impact scoring systems are applied to life-cycle data. In Chapter 11, impact scoring systems were applied to processes. For this type of application, the location of the emissions can be specified and the time at which the emissions occur can be specified. In contrast, for life-cycle assessment data, the spatial location of the emissions may not be known and the temporal distribution of the emissions may be uncertain. For example, in a life-cycle assessment for an automobile, emissions, energy use, and material use may be distributed all over the world since automotive components are manufactured all over the world and users may operate vehicles all over the world. The energy use, material use, and emissions would also be distributed over a product lifetime that may last for more than a decade. In general, life-cycle impact assessments do not account for this spatial and temporal distribution of energy use, material use, and emissions. Energy use, material use, and emissions are summed over the life cycle and the weighting or potency factors are then applied to these summed inventory elements. Does it make sense to sum the emissions of (for example) carbon dioxide from activities all over the world over a period of more than a decade, as would be done in a life-cycle impact assessment of an automobile? The answer to that question, of course, depends on project boundaries, and the spatial scales and time scales over which the impact occurs. It may be appropriate, for example, to sum worldwide emissions of global warming gases in a life-cycle study. It may be inappropriate to do the same summation for a type of impact that depends strongly on local conditions. Compounds that contribute to acid rain, for example, may not be an environmental concern in areas where the soil is well-buffered and acid rain is not a problem. Similarly, the release of nitrates in one area might cause eutrification, while the release of phosphates might be the cause of eutroification in another area.
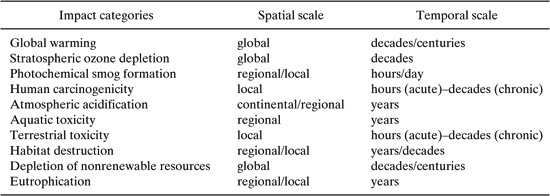
A summary of the concerns associated with spatial and temporal averaging of emissions is given in Table 13.3-3. Some recent life-cycle impact assessment methods have attempted to account for spatial and temporal variability of potency factors, but this remains a relatively underdeveloped area of life-cycle impact assessment. Most life-cycle impact assessments continue to assume that inventory data can be summed over the entire life cycle without accounting for spatial and temporal distributions.
Table 13.3-3 Impact Categories Frequently Considered in Life-Cycle Assessments. Listed in Table 13.3-1, these range from local to global in their spatial extent and operate over time scales ranging from hours to decades. These spatial and temporal characteristics of impacts should be compared to the spatial and temporal resolution of data collected in life-cycle studies (adapted from Owens, 1997).
Example 13.3-1 Impact assessment scores for the manufacture of polyethylene.
An inventory of the manufacture of a one kilogram of polyethylene showed that air emissions of carbon dioxide, carbon monoxide, nitrogen oxides, and sulfur oxides were 1.3 kg, 0.0009 kg, 0.012 kg, and 0.009 kg, respectively (Boustead, 1993). In a typical impact assessment scheme, emissions are multiplied by potency factors to arrive at impact scores. If carbon dioxide is assigned a characterization score of one for global warming, calculate the total global warming score for the polyethylene. Assume that the other emissions have no global warming potential. Assume that carbon monoxide, nitrogen oxides, and sulfur dioxide have been assigned characterization scores of 0.012, 0.78, and 1.2 for human toxicity, respectively. Calculate the impact scores for each compound and the overall score for each impact category. Also calculate the total human toxicity score. Remember that, while it would be incorrect to add the emissions of the four compounds together, their impact scores can be combined. Is it correct to add the overall global-warming score to the overall human toxicity score to arrive at a single impact score?
Solution: The global warming impact assessment score is
1.3 × 1 = 1.3
The human toxicity score for carbon dioxide is zero, while for carbon monoxide it is
0.0009 * 0.012 = 0.000011.
For nitrogen oxides it is
0.012 * 0.78 = 0.0094.
And for sulfur dioxide it is
0.009 * 1.2 = 0.011.
The overall score for this group of chemicals for global warming is 1.3 and the overall score for human toxicity is
0 + 0.000011 + 0.0094 + 0.011 = 0. 020.
Adding the global warming score for this set of compounds to the human toxicity score would be inappropriate.
Another issue that arises in impact assessment is the choice of potency factors. In Chapter 11, a single set of potency factors is presented. In practice, there are numerous impact scoring systems available. Many of these characterization schemes have been developed by life-cycle researchers (e.g., Guinée et al., 1996; Fava et al., 1993). Also, a number of schemes for weighting releases to the environment have been developed for reasons other than life-cycle assessment, and these can be adopted for life-cycle characterization (e.g., Wright, et al., 1997; Pratt et al., 1996; US EPA, 1997). At times, different life-cycle impact systems will lead to different results. As an example, consider an inventory of the releases of organochlorine compounds to the Great Lakes Basin, which was performed by Rosselot and Allen (1999). Three different potency factor schemes for human and ecological toxicity impact categories were used to rank the inventory data. The results of the rankings are shown in Table 13.3-4. Ideally, each of the potency factor schemes would result in the same rank ordering of chemicals; however, the data show that the different potency schemes lead to different rank ordering of some of the compounds. The potency schemes agree in their rankings of trichloroethylene, 1,2-dichloroethane, and PCBs, but disagree in their rankings of dichloromethane, endosulfan, and hexachlorobutadiene. Note that not all of the characterization systems listed in the table were created for the purpose of conducting life-cycle impact assessments. Instead, some of them were developed in order to rank emissions. Also note that ranking these compounds by mass of release (the order in which they are listed in the table) would give very different results than ranking them by potency of effect for any of the characterization schemes. Thus, while not all potency factors lead to identical results, ignoring the concept of potency and considering only the mass of emissions may place too great an emphasis on relatively benign compounds that are emitted in large amounts.
Why would different potency schemes lead to different results? The answer is simple. The methods are often based on different criteria. Some commonly used potency factors (Swiss Federal Ministry for the Environment (BUWAL), Postlethwaite and de Oude, 1996), are based on data from environmental regulations. In these systems, each emission is characterized based on the volume of air or water that would be required to dilute the emission to its legally acceptable limit. For example, if air quality regulations allowed 1 part per billion by volume of a compound in ambient air, then one billion moles of air (22.4 billion liters of air at standard temperature and pressure) would be required to dilute one mole of the compound to the allowable standard. This volume per unit mass or mole of emission is called the critical dilution volume and can vary across political boundaries. Other potency factor systems are based on relative risk, but establishing relative risks requires assumptions about the type of environment that the emissions are released to. These assumptions may differ in the various impact assessment schemes.
Table 13.3-4 Rankings of 1993 Releases of Chlorinated Organic Compounds in the Great Lakes Basin for Several Potency Factor Schemes. Compounds are listed in descending order of quantity released.

13.3.3 Valuation
The final step in life-cycle impact assessment, valuation, consists of weighting the results of the characterization step so that the environmental impact categories of highest importance receive more attention than the impact categories of least concern. There is no generally accepted method for aggregating values obtained from the evaluations of different impact categories to obtain a single environmental impact score. Some of the approaches that have been employed are listed in Table 13.3-5. Some methods assign valuations of high, medium, or low to the impact categories based on the extent and irreversibility of effect, so that stratospheric ozone depletion might receive a high rating and water usage might receive a low rating.
Table 13.3-5 Strategies for Valuing Life-cycle Impacts (Christiansen, 1997).

Valuation schemes based on the “footprint” of the inputs and outputs have been suggested. In these schemes, characterization would be conducted so that the air, water, land, and other resources required to absorb the inputs and outputs are quantified. These quantities could then be normalized according to the amount of each resource available, on either a local or global basis, and added within resource category. The resource with the highest combined normalized value is the one that is being most adversely impacted. In fact, it would be possible to arrive at a single value that represented the total fraction of the earth’s resources required to buffer the inputs and outputs over the life cycle being studied.
Data on the public’s willingness to pay for various environmental health categories have also been used in developing valuation schemes. However, there is very little data of actual scenarios where people paid a premium based solely on environmental preferability, and most willingness-to-pay information is based on surveys.
The following example illustrates the use of the Environmental Priority Strategy (EPS) system, developed in Sweden, which combines characterization and valuation into single values. Impact categories for this system include biodiversity, human health, ecological health, resources, and aesthetics. Environmental indices are assigned to compounds by considering six factors:
• Scope: the general impression of the environmental impact.
• Distribution: the extent of the affected area.
• Frequency or intensity: the regularity and intensity of the problem in the affected area.
• Durability: the permanence of the effect.
• Contribution: the significance of one kilogram of the emission of that substance in relation to the total effect.
• Remediability: the relative cost to reduce the emission by one kilogram.
Data from willingness-to-pay studies were used in developing the indices. Note that with this system, impacts are aggregated, and environmental value judgements and priorities are built into the indices.
Example 13.3 Selected Environmental Indices from the Environmental Priority Strategies System
In the EPS system, environmental indices are multiplied by the appropriate quantity of raw materials used or emissions released to arrive at Environmental Load Units (ELUs), which can then be added together to arrive at an overall ELU for the subject of the life-cycle study. Table 13.3-6 gives selected environmental weighting factors from the EPS system. Calculate the environmental load units due to air emissions from one kilogram of ethylene production. Emissions are 0.53 kg, 0.006 kg, 0.0006 kg, and 0.004 kg of carbon dioxide, nitrogen oxides, carbon monoxide, and sulfur oxides, respectively (Boustead, 1993).
Table 13.3-6 Selected Environmental Indices from the EPS System (in Environmental Load Units Per Kilogram) (Steen and Ryding, 1992).
Solution: Total ELUs due to air emissions are
0.53 kg CO2 H 0.09 ELU/kg CO2
0.006 kg NOx H 0.22 ELU/kg NOx
0.0006 kg CO H 0.27 ELU/kg CO
0.004 kg SOx H 0.10 ELU/kg SO x
= 0.05 ELU.
Note that if quantities of raw materials or water emissions were given, the ELUs for these inputs would be added to the ELUs for the air emissions.
Valuation occurs implicitly in every life-cycle study, because the attributes chosen for inventorying, such as air emissions and energy usage, reflect the values of the practitioners and the organization funding the study. Also, the choice of impact categories to be evaluated in the classification and characterization steps implicitly includes valuation. For example, odor is not typically included as an impact category, implicitly suggesting that it is of minimal importance relative to impacts such as ecotoxicity and human toxicity.
While there is no widely accepted procedure for aggregating impact scores across different impact categories, aggregation within impact categories takes place widely. It would be impractical, for example, to have a separate impact category for every biological species. Some impact assessment schemes have separate impact factors for aquatic and terrestrial life but within those broad categories, the response of different species to the same dose of a compound is very different.
Because valuation is subjective, many practitioners stop at the characterization step. If a life-cycle study was conducted to compare two products and the impact scores for each impact category were higher for one product than the other, valuation is not needed to determine which product is environmentally superior. This rarely happens, however; typically products being compared and design alternatives for a single product have some positive features and some less desirable features (recall the examples from Chapter 11). Each alternative has an environmental footprint with unique characteristics, meaning that any design choice typically means tradeoffs between categories of impacts.
13.3.4 Interpretation of Life-Cycle Data and Practical Limits to Life-Cycle Assessments
While the process of a life-cycle assessment might seem simple enough in principle, in practice it is subject to a number of practical limitations. In performing the inventory, system boundaries must be chosen so that completion of the inventory is possible, given the resources that are available. Even if sufficient resources are available, the time required to perform a comprehensive life-cycle inventory may be limiting. Then, even if the necessary time and resources are available, life-cycle data are subject to uncertainty for the reasons cited earlier in this section.
The limitations of life-cycle inventories are then carried forward into the impact assessment stage of life-cycle studies, and the impact assessment methodologies add their own uncertainties. For example, potency factors are not available for all compounds in all impact categories. Issues of temporal and spatial aggregation, as described in this section arise. Finally, valuation adds an element of subjectivity into the analyses.
This is not to say that life-cycle assessments are without value. Rather, despite the uncertainties involved, these assessments provide invaluable information for decision-making and product stewardship. They allow environmental issues to be evaluated strategically, throughout the entire product life cycle. The challenge is to take advantage of these valuable features of life-cycle assessments while bearing in mind the difficulties and uncertainties.
The next section describes methods for managing the uncertainties and effort required for life-cycle assessments. Once these tools are described, application and interpretation of life-cycle information will be examined.
13.4 Streamlined Life-Cycle Assessments
The use of life-cycle studies falls along a spectrum from a complete spatial and temporal assessment of all the inputs and outputs due to the entire life cycle (which may never be accomplished in practice, both because of a lack of information and because it would require a tremendous amount of effort and expense) to an informal consideration of the environmental stresses that occur over a product or process life cycle. This spectrum is illustrated in Figure 13.4-1. The further a study falls to the right on the spectrum, the more expensive and time-consuming the study will be. In this chapter, an analysis that includes an inventory of all inputs and outputs and all life-cycle stages (including an assessment of which ones are signifi-cant enough to be included in the inventory), an impact assessment, and an improvement analysis will be called a life-cycle assessment and a study that falls to the left in the spectrum of complexity will be said to involve the use of life-cycle concepts. Studies in between the two extremes will be called streamlined life-cycle assessments. Streamlined life-cycle assessments are conducted in order to find the most important life-cycle stages or type of inputs and outputs for more detailed study. Also, they can be used to identify where the most significant environmental issues occur.
13.4.1 Streamlined Data Gathering for Inventories and Characterization
The importance of product stewardship and growing awareness of the importance of product and process life cycles, coupled with a growing frustration with the complexity and data intensity of traditional life-cycle assessments has led to a new type of product life-cycle evaluation, often referred to as a streamlined life-cycle assessment. There are many ways that a life-cycle assessment can be streamlined. A study might build extensively on previously completed life-cycle assessments. A life-cycle assessment for polyethylene, for example, might rely on the data presented in the previous section on ethylene and focus on extending the supply chain through the polymerization of ethylene into polyethylene. Similarly, data collected in previous studies may indicate that certain impact categories or life-cycle inventory categories can be safely neglected without a meaningful effect on the results of the study
Figure 13.4-1 Life-cycle studies fall along a spectrum of difficulty and complexity, beginning with the use of life-cycle concepts and ending with complete life-cycle assessments.
![]()
Other approaches for making life-cycle studies easier to accomplish include omission of product components or materials. The omission can be based on whether the components or materials contribute significantly to the product’s overall environmental impacts. Some practitioners routinely exclude any component that accounts for less than 1% of the total product weight. This could result in inadequate study results, because some small components, such as semiconductor devices in computers, can have large environmental impacts relative to their weight (see Box 1). There are other ways to decide whether a component or material should be included or omitted in a life-cycle study, such as its economic value, which in turn reflects resource scarcity and ease of manufacturing and is at least loosely tied to environmental importance. Energy use (which is sometimes relatively simple to find data for) or toxicity might also be considered.
Environmental impact categories are sometimes neglected in streamlined life-cycle studies. Similarly, a selected set of inputs or outputs might be chosen for inventorying. Some products are known to have heavy impacts due to process wastes but require little energy, making an inventory of energy requirements less necessary than an inventory of gaseous, liquid, and solid residues.
Another possible shortcut to completing a life-cycle study would be to leave out life-cycle stages. Short-lived products, such as single-use packaging, usually have environmental impacts that are dominated by raw material acquisition and materials manufacture and disposal. In contrast, the use phase dominates for long-lived products that require resources during use. For example, in a streamlined life-cycle assessment of electric vehicle batteries, Steele and Allen (1998) considered only the recycling and disposal life-cycle stages.
13.4.2 Qualitative Techniques for Inventories and Characterization
One of the more common techniques employed in streamlined life-cycle studies involves conducting qualitative rather than quantitative analyses. For example, instead of quantifying the number of units of energy required to produce a product, the energy usage could be characterized as high, medium, or low. Qualitative evaluations can be enormously helpful in reducing the time and resources necessary for providing life-cycle information, because detailed inventory information is not necessary. However, there is a risk of failing to assess different life-cycle stages and products in a comparable manner. For example, energy usage during manufacture of a car may be high compared to manufacture of many products, but compared to the tens of tons of fuel required in the use stage of a typical car during its lifetime, an evaluation of high for energy use during manufacture would be inappropriate. Qualitative approaches for streamlined life-cycle assessments have been developed by a number of researchers.
Box 1 A streamlined life-cycle study of a computer workstation
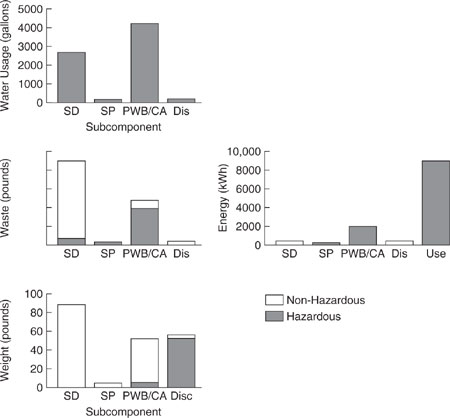
A computer workstation is a complex product involving an enormous range of materials and components. Conducting a full life-cycle assessment on a product of this complexity would be extremely difficult, yet life-cycle data can prove extremely useful in identifying areas for environmental improvement. A streamlined life-cycle assessment for a workstation was performed by an industry team coordinated by the Microelectronics and Computer Technology Corporation (MCC, 1993). The workstation components considered in the MCC study included the cathode ray tube (display), plastic housings, semiconductors, and printed wiring boards. A streamlined life-cycle assessment was able to identify, for a variety of life-cycle inventory categories, which workstation components were of primary concern. For example, product disposal was dominated by issues related to cathode ray tubes. Hazardous waste generation was dominated by semiconductor manufacturing. Energy use was dominated by the consumer use stage of the life cycle. Somewhat surprisingly, semiconductor manufacturing was identified as a significant factor in material use. Results are summarized in Figure 13.4-2. The study was used to guide research and technology development for the microcomputer industry.
Figure 13.4-2 Energy use, material use, water use, and waste generation in computer workstation life cycles. Note that different subcomponents of the workstation (SD = semiconductor device, SP = semiconductor packaging, PWB/CA = printed wiring board and computer assembly, DIS = display) dominate different inventory categories. (MCC, 1993)
Example 13.4-1 Computer Display Project: LCDs vs CRTs
The U.S. EPA’s Design for the Environment (DfE) Computer Display Project, in partnership with the electronics industry, has evaluated the life-cycle environmental impacts of liquid crystal display (LCD) and cathode ray tube (CRT) technologies that can be used in desktop computer monitors, by combining life-cycle assessment (LCA) and streamlined Cleaner Technologies Substitutes Assessment (CTSA) aproaches (U.S. EPA, 1995). The LCA examined environmental impacts through the collection of inventory data (i.e., material inputs/outputs) for all life-cycle stages, from raw materials acquisition through end-of-life. The material inventory was collected from dis-play and component manufacturers and suppliers in the U.S., Japan, Korea, and Taiwan (U.S. EPA, 1998).
By integrating the inventory amounts with the potential to cause an impact, the impacts of the CRT and LCD technologies were assessed for the following major impact categories: atmospheric resources, water quality, natural resource use, and human health/ecological impacts (see table below).
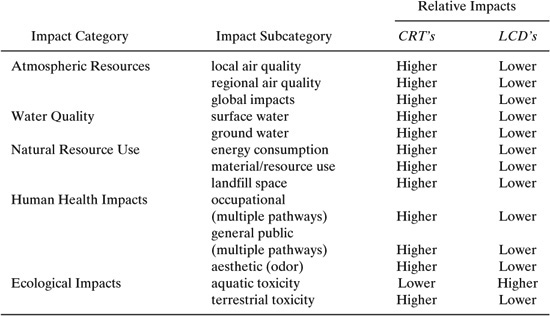
As presented in table above, preliminary results indicate that when aggregating data for all life-cycle stages, CRTs have greater potential impacts for most categories, except aquatic toxicity.
The study indicates numerous opportunities to improve both CRT and LCD designs (e.g., by reducing or eliminating mercury use in LCDs or lead in CRTs) and to reduce energy consumption during LCD and CRT manufacturing. Manufacturers can also evaluate substitutes or implement better management practices for particular problematic materials, such as sulphur hexaflouride, which is used in LCD manufacturing and contributes to global warming.
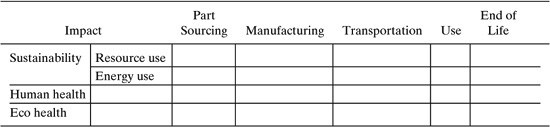
Some life-cycle practitioners evaluate both the quantity of the inputs and outputs and their impacts in a single qualitative process. An example of such a system is the Environmentally Responsible Product Assessment, developed at Bell Laboratories/Lucent Technologies, which relies on the use of expert evaluations of extensive checklists, surveys, and other information (Graedel, 1998). Scores from 0 to 4 (with 4 indicating environmental preferability) are assigned to the life stages and inventory categories listed in Table 13.4-1. The table shows that there are five life-cycle stages and five inventory categories to assess, for a total of 25 assessments per product. After all the scores are assigned, they are added together to arrive at an overall score. The maximum value for this overall score, therefore, is 4 × 25, or 100.
As an example, the scoring guidelines and protocols for just one of the 25 elements in the Environmentally Responsible Product Assessment matrix is given in Table 13.4-2. These guidelines and protocols are for the materials choice category of the premanufacture life-cycle stage. Parallel systems for assessing services, processes, facilities, and infrastructures have also been developed at Bell Laboratories/Lucent Technologies (Graedel, 1998).
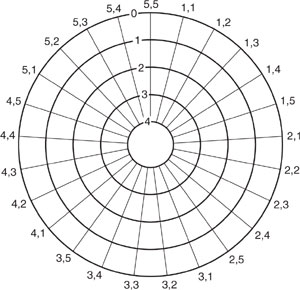
The results of the Environmentally Responsible Product Assessment can be plotted on a chart such as the one shown in Figure 13.4-3. A product that is relatively environmentally benign would have all the points of the chart clustered around the center, and an environmentally damaging product would have points that fell towards the outside circumference.
In these qualitative, streamlined life-cycle analyses, functional units and allocation methods are not explicitly considered. However, use of virgin materials is penalized, so credit is given for using recycled materials. Scores developed by different individuals tend to fall within 15% of each other, which is an indication of the uncertainty in the results. Evaluations tend to be based on comparisons to a standard and focus on whether or not best practices are being followed. Therefore, this scheme might be useful in improving already-designed products rather than a product that is in the early design phases; however, it is not as useful for comparing completely different means to fulfilling a need. For example, they may be helpful in identifying whether aqueous or chlorinated organic solvents are environmentally preferable, but not for comparing a process change that makes cleaning unnecessary compared to the use of aqueous or chlorinated solvents.
Table 13.4-1 Life Stages and Inventory Categories Evaluated in the Environmentally Responsible Product Assessment Matrix (Graedel, 1998).

Streamlined life-cycle assessment methods could be devised to produce results with an absolute basis. For example, inputs and outputs could be assigned qualitative inventory scores that correspond to a specific functional unit and an absolute value. Product inventory matrices with types of inputs and outputs for rows and life-cycle stages for columns would be filled out with evaluations of high, medium, low, and none. For illustrative purposes, consider the life-cycle inputs and outputs of one kilogram of glass. One might assign a score of low to compounds whose air emissions are believed to be greater than zero but less than 0.001 kilogram, a score of medium if air emissions of a compound are believed to be between 0.001 kilogram and 0.1 kilogram, and a score of high if air emissions of a compound are believed to be greater than 0.1 kilogram. While it might be difficult (or even impossible) to inventory the inputs and outputs of a life cycle to within one or two significant digits, less effort is required to arrive at estimates accurate to within an order of magnitude.
Table 13.4-2 Environmentally Responsible Product Matrix Scoring Guidelines for the Materials Choice Inventory Category During the Premanufacture Life-Cycle Stage (Graedel, 1998).

Figure 13.4-3 The target plot for the Environmentally Responsible Product Assessment matrix. Each radial axis represents one of the 25 life-cycle stage/inventory category combinations from Table 13.4-1 (Graedel, 1998).
Potency factor matrices with evaluations of high, medium, low, and none for each of the inputs and outputs from the product inventory matrix could also be devised. The rows of these matrices would be types of inputs and outputs and the columns would be environmental impact categories. Numerical scores could then be assigned to the qualitative evaluations. For example, low could be assigned a score of one; medium, a score of two; and high, a score of three. The inventory scores could then be added to the potency scores to arrive at impact assessment scores. This streamlined life-cycle assessment technique would require a large number of relatively simple evaluations. Complex products made from many sepa-rate components would be more amenable to this type of streamlined assessment because scores with an absolute basis could be weighted and summed over the components involved. Also, the potency factor scores would need to be developed only once for each type of input and output.
Many such streamlined assessments could be devised and it is beyond the scope of this chapter to review all of the methods that have appeared. Nevertheless, it is useful to keep in mind the features of a well-designed, streamlined study. A good streamlined life-cycle assessment has a goal, an inventory, an impact assessment, and an improvement analysis, just as a comprehensive life-cycle assessment does. All of the relevant life stages are evaluated, if only to say they are being omitted and why, and all of the relevant inventory categories are evaluated (again, perhaps only to say why they are being omitted). In a streamlined life-cycle assessment, evaluations for inventory categories and impact assessments may be qualitative instead of quantitative.
13.4.3 Pitfalls, Advantages, and Guidance
Streamlined life-cycle assessments and life-cycle concepts play a particularly important role in green engineering—more so than comprehensive life-cycle assessments. This is because of the nature of the design cycle of a product or process. There is a rule of thumb that 80% of the environmental costs of a product are determined at the design phase (Graedel, 1998). Modifications made to the product at later stages can therefore have only modest effects. Thus it is in the early design phase that life-cycle studies for improving the environmental performance of a product are most useful. However, in the design phase, materials have not been selected, facilities have not been built, packaging has not been determined, so a comprehensive, quantitative life-cycle assessment is impossible at the time when it would be most useful. Instead, preferable materials and processes can be identified through the use of an abbreviated life-cycle study early in the design cycle where it is most effective. This is discussed further in the later sections on design of products and processes.
13.5 Uses of Life-Cycle Studies
According to a survey of organizations actively involved in life-cycle studies, the most important goal of life-cycle studies is to minimize the magnitude of pollution (Ryding, 1994). Other goals include conserving non-renewable resources, including energy; ensuring that every effort is being made to conserve ecological systems, especially in areas subject to a critical balance of supplies; developing alternatives to maximize the recycling and reuse of materials and waste; and applying the most appropriate pollution prevention or abatement techniques. As discussed in this section, life-cycle studies have been applied in many ways in both the public and private sectors for uses such as developing, improving, and comparing products.
13.5.1 Product Comparison
The most widely publicized life-cycle studies are those that have been conducted for the purpose of comparing products. A life-cycle study comparing cloth and disposable diapering systems, another study comparing plastic and paper cups, and another one comparing polystyrene clamshells and paper wrappings for sandwiches are examples of studies that received a great deal of attention from the press (see problems at the end of the chapter). Product comparison studies are often sponsored by organizations that have a vested interest in the results, and because of the open-ended nature of life-cycle studies, there is always room for criticism of the assumptions that were made and the data that were gathered in the course of the study. Because the results of these high-profile product comparison life-cycle studies have generated a great deal of controversy and debate, they have created skepticism over the value of life-cycle studies. This has diverted attention away from some of the less controversial applications, such as studies conducted in order to improve products.
13.5.2 Strategic Planning
One of the most important uses for manufacturers of life-cycle studies is to provide guidance in long-term strategic planning concerning trends in product design and materials (Ryding, 1994). By their nature, life-cycle studies include environmental impacts whose costs are external to business (e.g., habitat destruction) as well as internal (e.g., the cost of waste generation). Assessing these external costs is key to strategic environmental planning, as regulations tend to internalize what are currently external costs of doing business.
13.5.3 Public Sector Uses
Life-cycle studies are also used in the public sector. Policymakers report that the most important uses of life-cycle studies are 1) helping to develop long-term policy regarding overall material use, resource conservation, and reduction of environmental impacts and risks posed by materials and processes throughout the product life cycle, 2) evaluating resource effects associated with source reduction and alternative waste management techniques, and 3) providing information to the public about the resource characteristics of products or materials (Ryding, 1994).
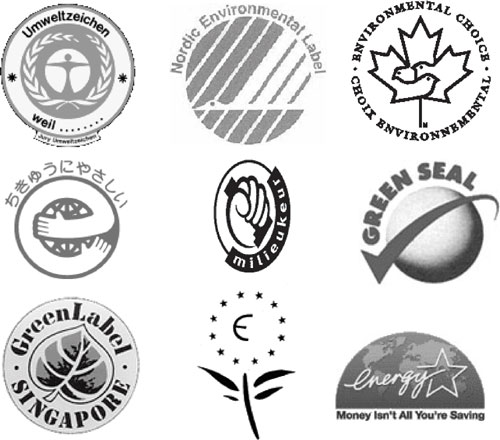
Some of the most visible of the applications of life-cycle studies are environmental or ecolabeling initiatives. Examples of ecolabels from around the world are given in Figure 13.5-1. Besides environmental labeling programs, public sector uses of life-cycle studies include making procurement decisions and developing regulations.
Figure 13.5-1 Ecolabels from Around the World.
For example, the United States Environmental Protection Agency used life-cycle information when making a decision about regulation of industrial laundries whose effluent was a problem because of the oily shop rags they laundered. The concern was that tighter regulations may have made the costs of industrial laundering so expensive that a shift from cloth shop rags to disposable shop rags would occur. Would this be a benefit to the environment? Life-cycle concepts provide some insights. A summary of this case and other the uses of life-cycle studies in public policy initiatives has been assembled by Allen, et al. (1997).
13.5.4 Product Design and Improvement
Product comparisons have received the most attention from the press, but in a survey, manufacturers state that the most important uses of life-cycle studies are 1) to identify processes, ingredients, and systems that are major contributors to environmental impacts, and 2) to compare different options within a particular process with the objective of minimizing environmental impacts (Ryding, 1994).
Manufacturers have more potential for influencing the environmental impacts of products than any other “owners” of life-cycle stages. This is because they can exert some influence over the environmental characteristics of the supplies they use, because manufacturing processes account for a large portion of the wastes generated in the United States, and because manufacturers determine to some extent the use and disposal impacts of the products they make.
Choosing Suppliers
As stated before, manufacturers have some potential to influence the environmental characteristics of the companies from whom they purchase supplies. This is illustrated by the efforts of Scott Paper Company in their procurement of pulp for paper products (Fava and Consoli, 1996). Scott decided to use a life-cycle approach to environmental impacts as opposed to its traditional focus on environmental concerns only at plants that it owns when it found that the issues of major concern were not in the life-cycle stages directly controlled by the company.
Scott’s first step was to require its pulp suppliers in Europe to provide detailed information about their emissions, energy use, manufacturing processes, and forestry practices. In their impact assessment, Scott ranked the environmental impact categories by consulting with opinion leaders. They found that there was considerable variation in performance among suppliers, and that the suppliers that were ranked worst in one environmental impact category tended to be worst in other categories as well. The poorest performing suppliers were shown the potential for improvement, and if they did not choose to proceed, Scott no longer used them as a supplier. As a result of this program, Scott changed about 10% of its pulp supply base. Scott publicized their efforts and its products were seen as environ-mentally preferable by consumers and environmental advocacy groups.
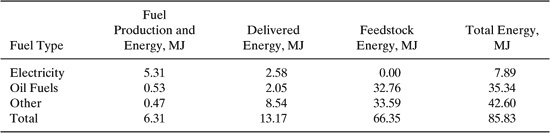
The results of a life-cycle study conducted for the purpose of product improvement are shown in Table 13.5-1. This table shows the results of an inventory of the energy required to produce one kilogram of polyethylene. The majority of fuel required to make polyethylene is in the organic matter that instead of being burned for energy is converted to polyethylene. In fact, the values in the column titled “Feedstock Energy” are about 75% of the total energy requirements. This inventory showed that the focus of efforts to reduce the life-cycle energy requirements of polyethylene are best spent on reducing the mass of polyethylene in products (i.e., to make them as light as possible).
Another life-cycle study conducted for the purpose of product improvement (Franklin Associates, Ltd., 1993) showed that the energy requirements of the use stage of a polyester blouse are 82% of the total energy requirements over the life cycle. Furthermore, the greatest potential for reducing the energy requirements over the life cycle consisted of switching to a cold water wash and line dry instead of a warm water wash and drying in a clothes dryer. Such a switch would reduce the energy requirements of the use stage by 90%. Thus, one of the greatest environmental improvements that could be made in a garment is to make it cold water washable.
In another life-cycle study for product improvement of clothing, it was shown that the means of transportation used in delivering a garment to a customer can have a profound impact on the garment’s life-cycle energy requirements (Hopkins et al., 1994). This study showed that in the case where next-day shipping is used, transportation and distribution energy requirements can be 28% of manufacturing life-cycle energy requirements. Transportation and distribution of products generally contribute negligibly to the energy requirements of a product and are frequently neglected in life-cycle studies. Prior to this study, the garment manufacturer was unaware that their choice of delivery mode could contribute significantly to the energy required over the life cycle of their products.
In yet another life-cycle study conducted for product improvement, the components of a computer workstation were assessed to reveal which were responsible for the majority of raw material usage, wastes, emissions, and energy consumption (Box 1; MCC, 1993). The components studied included semiconductors, semiconductor packaging, printed wiring boards and computer assemblies, and display monitors. One of the findings of the study was that the majority of energy usage over a workstation’s life cycle occurs during the use phase of the display monitor. Therefore, to reduce the overall energy usage of a computer workstation, efforts are best directed at reducing the energy consumed by the monitor. Semiconductor manufacture was found to dominate hazardous waste generation and was also found to be a significant source of raw material usage. This is in spite of the fact that by weight, semiconductors are a very small portion of a workstation.
Table 13.5-1 Average Gross Energy Required to Produce One Kilogram of Polyethylene (Boustead, 1993).
Another life-cycle study was conducted by a light switch maker in Europe as a result of a competitor gaining market share by claiming to manufacture a cadmium-free switch (Besnainou and Coulon, 1996). The life-cycle inventory showed that the cadmium contained in the contactor of the switch for both manufacturers was negligible compared to the cadmium used in plating operations during manufacture. In effect, only one of the manufacturers made switches that contained cadmium, but neither switch was truly “cadmium-free.” Also, the life-cycle study revealed that the biggest environmental gains could be had by reducing the electricity consumed by the switch over its ten-year lifetime. This result is surprising because the electricity consumed is small per event and only becomes important when totaled over the life cycle.
Using Life-Cycle Concepts in Early Product Design Phases
Traditionally, performance, cost, cultural requirements, and legal requirements have set the boundaries for the design of products. Increasingly, environmental aspects are included with this core group of design criteria and life-cycle studies can be used to assess environmental performance. Optimizing environmental performance from the beginning of the design process has the possibility of the largest gains, but it is a moving target as markets, technologies, and scientific understanding of impacts change. However, as stated earlier, roughly 80% of the environmental costs of a product are determined at the design phase, and modifications made to the product at later stages may have only modest effects. Thus it is in the early design phase that life-cycle studies for improving the environmental performance of a product are most useful.
Motorola has developed a matrix for streamlined life-cycle assessment that is intended in part to specifically address early design (Graedel, 1998). The matrix is shown in Table 13.5-2. There are five life-cycle stages and three impact assessment categories (one of which is divided into two subcategories) in the matrix. Motorola intends to use this matrix in three succeedingly quantitative phases: the initial design concept phase, the detailed drawings phase, and the final product specifications phase. In the initial design phase, the matrix elements can be filled out by asking a series of yes and no questions. An overall score is computed by adding the yes answers, and changes in that score show progress in the product’s environmental characteristics. This example is typical of emerging trends in product design.
Table 13.5-2 Motorola’s Life-Cycle Matrix (Graedel, 1998).
13.5.5 Process Design
Industrial process changes should be given strategic thought because they are generally in place for decades and retrofits tend to be expensive and difficult. While the life-cycle stages of a process are different from those of a product (as shown in Figure 13.1-1), the types of inputs and outputs and impact categories are the same. Generally, process choices (including choices of feed materials for the process) are likely to have more impact over the life cycle of the process than production of the equipment itself.
Jacobs Engineering has developed a life-cycle matrix tool that has been applied to processes (as opposed to products) (Graedel, 1998). This matrix is shown in Table 13.5-3. This tool identifies five inventory categories and seven environmental impact categories at two spatial scales (shop level and global). A base case process is determined and elements in the matrix are assigned +1, 0, or -1, depending on whether the alternative is an improvement, equivalent, or worse than the base case. Note that not all life-cycle stages are explicitly identified in this scheme.
Summary
Life-cycle studies are a uniquely useful tool for assessing the impact of human activities. These impacts can only be fully understood by assessing them over a life cycle, from raw material acquisition to manufacture, use, and final disposal. Life-cycle techniques have been adopted in industry and the public sector to serve a variety of purposes, including product comparison, strategic planning, environmental labeling, and product design and improvement.
Life-cycle assessments have four steps. The first is scoping, where boundaries are determined and strategies for data collection are chosen. The second step is an inventory of the inputs and outputs of each life-cycle stage. Next is an impact assessment, where the effects of the inputs and outputs are evaluated. The final step is an improvement analysis. Even for simple products, comprehensive life-cycle studies require a great deal of time and effort. Also, no matter how much care is taken in preparing a study, the results obtained have uncertainty.
Table 13.5-3 Jacobs Engineering Impact Analysis Matrix for Evaluating Alternative Processes.

Yet, life-cycle studies remain useful. Environmental concerns that are identified early in product or process development can be most effectively and economically resolved and life-cycle studies can be used as tools to aid in decision-making.
Questions for Discussion
1. Life-cycle assessments have been performed comparing the environmental impacts of beverage delivery systems, lighting systems, grocery sacks, and numerous other products. In all of these studies, determining a functional unit is a critical part of performing the comparison. For each of the product comparisons listed below, suggest a functional unit, describe how an equivalency between products could be established using the functional unit, and estimate that equivalency factor.
For example, if the goal were to compare paper and plastic grocery sacks, the functional unit would be providing packaging for a given market basket of groceries. Equivalency could be established by going to grocery stores, purchasing identical market baskets of goods and packaging the goods using both paper and plastic. Studies of this type have concluded that 2 plastic sacks are equivalent to one paper sack.
a) Fluorescent bulbs vs. Incandescent bulbs
b) Cloth vs. Disposable diapers
c) 12-ounce aluminum cans vs. 16-ounce glass beverage containers
2. Tables 13.4-1, 13.5-2 and 13.5-3 each present frameworks for performing streamlined or semi-quantitative analyses of impacts throughout a life cycle. Compare and contrast the features of the tables, keeping in mind the types of products or processes that the frameworks are designed for. For a product of your own choosing, develop a matrix which could be used in performing a streamlined life-cycle assessment (see, for example, Steele and Allen, 1998).
References
Allen, D.T., Bakshani, N., and Rosselot, K.S., “Homework and Design Problems for Engineering Curricula,” American Institute of Chemical Engineers, New York, 155pp. (1992).
Allen, D.T., Consoli, F.J., Davis, G.A., Fava, J.A., and Warren, J.L., “Public Policy Applications of Life Cycle Assessment,” SETAC, Pensacola, FL, 127 pp. (1997).
Besnainou, J. and. Coulon, R, “Life-Cycle Assessment: A System Analysis,” in Environmental Life-Cycle Assessment, M. A. Curran, ed., McGraw-Hill, New York, 1996.
Boustead, I., “Ecoprofiles of the European Plastics Industry, Reports 1-4,” PWMI, European Centre for Plastics in the Environment, Brussels, May 1993.
Christiansen, K, ed., “Simplifying LCA: Just a Cut? Final Report from the SETAC-EUROPE LCA Screening and Streamlining Working Group,” SETAC, Brussels, 1997.
Consoli, F., Allen, D., Boustead, I., Franklin, W., Jensen, A., de Oude, N., Parrish, R., Perriman, R., Postlethwaite, D., Quay, B., Seguin, J., Vigon, B., editors, “Guidelines for Life Cycle Assessment: A Code of Practice,” SETAC Press, Pensacola, Florida, 1993.
Epstein, L.N., Greetham, S., and Karuba, A., “Ranking Refineries,” Environmental Defense Fund, Washington, D.C., November, 1995.
Electric Power Research Institute, “EV Emission Benefits in California,” Technical Brief, Customer Systems Division, RB2882, Palo Alto, Ca., May, 1994.
Fava, J and Consoli, F. “Application of Life-Cycle Assessment to Business Performance,” in Environmental Life Cycle Assessment, M.A. Curran, ed. McGraw Hill, New York, 1996.
Franklin Associates, Ltd., “Resource and Environmental Profile Analysis of a Manufactured Apparel Product,” Prairie Village, KS, June 1993.
Graedel, T.E. and Allenby, B. R. Industrial Ecology, Prentice-Hall, Inc. Englewood Cliffs, New Jersey, 1995.
Graedel, T. E., Streamlined Life-Cycle Assessment, Prentice-Hall, Inc., Englewood Cliffs, New Jersey, 1998.
Guinée, J., L. van Oers, D van de Meent, T. Vermiere, M. Rikken, “LCA Impact Assessment of Toxic Releases,” Dutch Ministry of Housing, Spatial Planning and the Environment, The Hague, The Netherlands, May 1996.
Hopkins, L., Allen, D. T., and Brown, M., “Quantifying and Reducing Environmental Impacts Resulting from Transportation of a Manufactured Garment,”Pollution Prevention Review, 4(4), 1994.
Microelectronics and Computer Technology Corporation (MCTC), “Life-Cycle Assessment of a Computer Workstation,” Report no. HVE-059-94, Austin, TX, 1994.
Owens, J.W., “Life Cycle Assessment: Constraints on Moving from Inventory to Impact Assessment,”Journal of Industrial Ecology, 1(1) 37–49 (1997).
Postlethwaite, D and de Oude, N. T., “European Perspective,”Environmental Life-Cycle Assessment, M. A. Curran, ed., McGraw-Hill, New York, 1996.
Pratt G. C., Gerbec, P.E., Livingston, S. K., Oliaei, F., Gollweg, G. L., Paterson, S., and Mackay, D., “An Indexing System for Comparing Toxic Air Pollutants Based upon Their Potential Environmental Impacts,”Chemosphere, 27(8), 1350–1379, 1993.
Rosselot, K.S. and Allen, D.T., “Chlorinated Organic Compounds in the Great Lakes Basin: Impact Assessment,” submitted to Journal of Industrial Ecology, 1999.
Ryding, S., “International Experiences of Environmentally Sound Product Development Based on Life-Cycle Assessment,” Swedish Waste Research Council, AFR Report 36, Stockholm, May 1994.
Steele, N. and Allen, D.T., “An Abridged Life-Cycle Assessment of Electric Vehicle Batteries,”Environmental Science and Technology, Jan. 1, 1998, 40A-46A.
Steen, B. and Ryding, S., “The EPS Enviro-Accounting Method: An Application of Environmental Accounting Principles for Evaluation and Valuation of Environmental Impact in Product Design,” Stockholm: Swedish Environmental Research Institute (IVL), 1992.
United States Environmental Protection Agency (US EPA), Waste Minimization Prioritization Tool, EPA530-R97-019, June 1997.
United States Environmental Protection Agency (US EPA), Design for the Environment Computer Display Project (fact sheet), EPA 744-F-98-010, 1998.
United States Environmental Protection Agency (US EPA), Cleaner Technologies Substitutes Assessment: A Methodology and Resource Guide, EPA 744-R-95-002, 1995.
Wright, M., Allen, D., Clift, R., and Sas, H., “Measuring Corporate Environmental Performance: The ICI Environmental Burden System,”Journal of Industrial Ecology, 1 (4), 117–127 (1998).
Problems
1. (From Allen, et al., 1992.) At the supermarket checkstand, customers are asked to choose whether their purchases should be placed in unbleached paper grocery sacks or in polyethylene grocery sacks. Some consumers make their choice based on the perception of the relative environmental impacts of these two products. This problem will quantitatively examine life-cycle inventory data on the energy use and air emissions for these two products.
Life-cycle inventories for paper and polyethylene grocery sacks have resulted in the data given below, which will be used in comparing the two products. Assume that the functional unit to be used in this comparison is a defined volume of groceries to be transported, and that based on this functional unit, 2 plastic sacks are equivalent to one paper sack. The plastic and paper sacks weigh 7.5 and 61 grams, respectively.
Air Emissions and Energy Requirements for Paper and Polyethylene Grocery Sacks (Allen, et al., 1992).

a) Using the data in the table, determine the amount of energy required and the quantity of air pollutants released per plastic sack. Also determine the amount of energy required and the quantity of air pollutants released for the quantity of paper sacks capable of carrying the same volume of groceries as the plastic sack. Both the air emissions and the energy requirements are functions of the recycle rate, so perform your calculations at three recycle rates: 0%, 50% and 100% recycled. Note that a 50% recycle rate indicates that half of the sacks are disposed of and the other half are recycled after the product use stage of their life cycle.
b) Plot the energy requirements calculated in part a as a function of the recycle rate for both sacks. Do the same for the air emissions. Compare the energy requirements and air emissions of the sacks at different recycle rates.
c) Discuss the relative environmental impacts of the two products. Do the results allow for a comprehensive comparison?
d) The material and energy requirements of the plastic sacks are primarily derived from petroleum, a non-renewable resource. In contrast, the paper sacks rely on petroleum to only a limited extent and only for generating a small fraction of the manufacturing and transportation energy requirements. Compare the amount of petroleum required for the manufacture of two polyethylene sacks to the amount of energy necessary to provide 10% of the energy required in the manufacture of one paper sack. Assume 0% recycle and that 1.2 lb of petroleum is required to manufacture 1 lb of polyethylene. The higher heating value of petroleum is 20,000 BTU/lb.
e) In this problem, we have assumed that 2 plastic sacks are equivalent to one paper sack. Does the uncertainty in the equivalency between paper and plastic sacks affect any of your conclusions?
2. (From Allen, et al., 1992.) Disposable diapers, manufactured from paper and petroleum products, are one of the most convenient diapering systems available, while cloth diapers are often believed to be the most environmentally sound. The evidence is not so clear-cut, however. This problem will quantitatively examine the relative energy requirements and the rates of waste generation associated with diapering systems.
Three types of diapering systems are considered in this problem: homelaundered cloth diapers, commercially-laundered cloth diapers, and disposable diapers containing a super-absorbent gel. The results of life-cycle inventories for the three systems are given below.
Energy Requirements and Waste Inventory per 1000 Diaper Uses (Allen, et al., 1992).
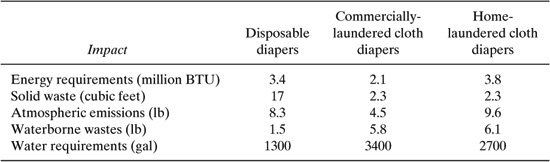
a) The authors of the report from which the data in the table are taken found that an average of 68 cloth diapers were used per week per baby. Disposable diaper usage is expected to be less because disposable diapers are changed less frequently and never require double or triple diapering. In order to compare the diapering systems, determine the number of disposable diapers required to match the performance of 68 cloth diapers, assuming:
15.8 billion disposable diapers are sold annually
3,787,000 babies are born each year
children wear diapers for the first 30 months
disposable diapers are used on 85% of children.
b) Complete the table given below. Remember to use the equivalency factor deter-mined for cloth and disposable diapers determined in part a. Based on the assumptions you made in part a, how accurate are the entries in the table?
Ratio of Impact to Home-Laundered Impact.

c) Using the data given below, determine the percentage of disposable diapers that would need to be recycled in order to make the solid waste landfill requirements equal for cloth and disposable systems.
Impact of Recycle Rate on Solid Waste for Disposable Diapers.

3. The University of Michigan has developed a case study analyzing the decision, made by McDonald’s, to replace polystyrene clamshell containers with other container systems. The case study is described at: http://www.umich.edu/~nppcpub/resources/compendia/chem.e.html. Review the materials on the web site and write a one-page summary of the case.
4. Choose two similar products and perform streamlined life-cycle assessments for them using the methods described in this chapter and the methods described by Graedel (1998). Assess whether the streamlined approach is effective in comparing the products you have chosen.