
Frequency analysis is a crucial part of many computational tasks, from communications to oil exploration to code breaking. Speed is critical: The faster a radar system can analyze the frequencies of a reflected signal, the faster it can respond to impending threats.
The fast Fourier transform (FFT) is the most common method of analyzing frequency information in signals. When a new digital signal processor enters the market, one of the first benchmarks engineers look at is how quickly it can compute an FFT. There have been many variations of this algorithm since J.W. Cooley and John Tukey wrote their famous 1965 paper, but the Cooley-Tukey FFT is still the most widely used.
This chapter is concerned with implementing the Cooley-Tukey FFT on the Cell—not just because of its popularity, but because IBM uses it in both of their FFT libraries. This presentation is divided into four sections:
Introduction to frequency analysis and the discrete Fourier transform (DFT)
Explanation of the fast Fourier transform (FFT)
The IBM FFT example library
The IBM FFT library
The first two sections are theoretical in nature. They explain what frequency analysis is and how it’s accomplished with the FFT. If you’re already familiar with Fourier analysis, you can safely skip these sections and proceed to the next two.
The SDK provides FFT routines in two separate libraries. The first is installed by default and can be found in the same folder as the vector and matrix libraries. This is called the Example FFT library or libfft_example. The second is a recent addition to the SDK and is called the FFT library or libfft. The functions in libfft_example are generally faster, but the libfft routines operate on a wider range of input data.
Let’s say there’s a song you love dearly. The double bass arrangement is finer than anything you’ve ever heard, but the song has one major flaw: the soprano. The squeaky, high-pitched singing nearly drowns out the double bass, and the song would be perfect if you could just remove the soprano’s voice from the recording. But how can this be done? The answer involves frequency analysis.
Your sound recording consists of digital values that change over time. If you wanted to, you could express the song with a function such as x(t), where t represents time in seconds, and x(5) is the value at exactly the fifth second. Because the song consists of values changing over time, it’s a time-domain signal. x(t) is the signal’s time-domain representation. Other time-domain signals include the variation in temperature over the course of a day and the fluctuation in a stock’s price over a fiscal year.
If you want to remove the soprano’s voice from the song, changing x(t) won’t do any good. For example, if you remove the values at x(2) and x(3), you’ll take away from both the vocals and the bass guitar. Unacceptable.
The trick is to stop thinking of the song as sound over time and start thinking about it in terms of frequencies. A signal’s frequency measures how many times the signal rises and falls (oscillates) over time. Real-world signals span a range of frequencies. The most common unit of frequency is the Hertz (Hz), which measures the number of times a signal oscillates during a second.
The strings of a double bass generally vibrate between 40 and 200 times per second, so its frequency range is between 40Hz and 200Hz. Similarly, a soprano’s vocal cords commonly produce sounds between 250Hz and 1KHz. These frequency ranges don’t overlap, so if you could remove content from the song at selected frequencies, you could take away the singing without losing the double bass.
Figure 17.1 displays an example of a musical selection and its corresponding frequencies. All the frequencies contribute to the signal, but some are more prominent than others. Both graphs were generated by the open source Audacity tool, which makes it possible to edit music files and view their frequency content.
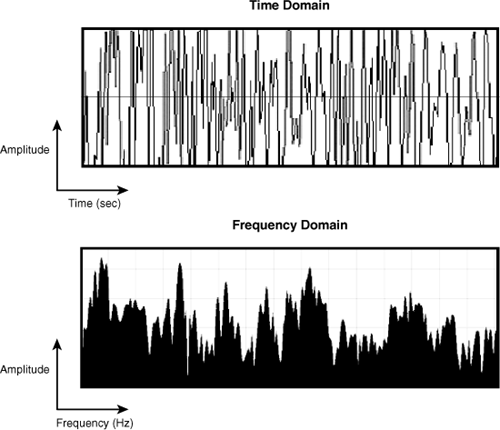
The lower graph shows how much the signal changes at a given frequency. This can be represented by a frequency-dependent function, and we’ll call this X(f). If X(f) is large, a significant portion of the signal oscillates with frequency f.
The frequency-domain representation provides a new perspective of the signal and a new way to manipulate its content. Returning to the example, you can silence the soprano in three steps:
Transform the time-domain signal x(t) into its frequency domain representation X(f).
Set X(f) to zero for f between 250Hz and 1KHz (the soprano’s range).
Transform X(f) back into x(t).
After this is done, the high-frequency portion of the signal will be gone, and you can listen to the double bass in unblemished clarity.
This transform-modify-transform process is commonly used to remove noise and scratches from music. It’s a crucial part of receiving GPS signals from satellites. But how is the time-domain representation of a signal, x(t), converted into its frequency domain representation, X(f)? And then how do you convert the modified X(f) back to a new x(t)? Both operations are made possible by the Fourier transform.
Let’s turn our attention to the digital recording of the song, which we’ll say lasts 3 minutes (180 seconds). When the bassist and soprano performed in the recording studio, they produced an infinite number of sounds during the 180-second period. But the recording takes up a limited amount of memory on your computer, so no matter how high definition the recording, you didn’t get all the music. That is, your recording doesn’t contain x(t) for every possible time, but for a series of selected times.
This selection process is called sampling, and the more samples you have, the more faithfully your recording matches the music in the recording studio. Samples must be taken at regular intervals, and this interval, Δt, determines how many sound values are stored in your file. A sound recording for a compact disk (CD) has been sampled at 44,100 samples/second. This means the sampling interval, Δt, equals 1/44,100 or .0023 milliseconds. Therefore, the CD recording of your song contains (180 seconds)(44,100 samples/second) = 7,938,000 samples. That’s a lot of information, but audiophiles will tell you it’s still not enough.
The recording contains a finite number of samples, so let’s change our terminology. Instead of representing the signal as x(t), which can take an infinite number of time values, let’s call it x[n]. The array-like notation makes it clear that we’re dealing with a vector of finite size, and we’ll call this vector the time vector. Unlike t, n isn’t a point in time, but identifies the index of a sample inside the vector. It should make sense that x[n] = x(nΔt).
As I explain shortly, the interesting frequency components of the time vector are also finite in number. These are stored in a frequency vector. The algorithm that converts time vectors to frequency vectors is called the discrete Fourier transform, or DFT. The algorithm that converts frequency vectors to time vectors is called the inverse discrete Fourier transform, or the IDFT.
The dot product of two vectors tells you how closely they resemble each other. The product is highest when the vectors are parallel, zero when they’re orthogonal, and lowest when they point in opposite directions. Imagine a vector whose values change at frequency f and only at frequency f. If the dot product of x[n] and this special vector is high, a significant portion of x[n] changes with frequency f. If the dot product is low, the frequency component of x[n] at f is less significant.
This dot product is the fundamental operation of the DFT. Once you have a clear understanding of how and why it produces the frequency components of x[n], everything else is simple. Well, mostly simple.
Back to the song. If the song lasts 180 seconds and is sampled at 44,100 samples/second, the time-domain vector x[n] contains 7,938,000 values. To find out how much of the vector changes at 300Hz, you need to compute the dot product of x[n] and a second vector that oscillates only at 300Hz. The 300Hz frequency falls within the soprano’s range, so the frequency content of x[n] at f = 300 should be significant.
At least two questions present themselves. First, we can’t take an infinite number of dot products, so what frequencies should we be interested in? Second, what are single-frequency vectors, and how are they generated?
Rather than perform a dot product for every possible value of f, we’re going to select a finite number of frequencies. The values of these frequencies depend on two factors: the length of time occupied by the signal (the period, denoted T), and the number of samples in x[n], denoted N. For the song, T = 180s and N = 7,938,000.
The lowest frequency that interests us, f1, represents one oscillation over the course of the signal’s period. That is,
This is the fundamental frequency of the signal or its first harmonic. For the song example, the fundamental frequency is 1/180s = 5.556mHz. The song probably doesn’t contain any sounds with such a low pitch, but according to the DFT rules, that’s where we have to start.
The other frequencies that interest us are multiples of the fundamental frequency. These are called harmonics, and are denoted fk. Just as f1 denotes the first harmonic, the second and third harmonics are given by the following equations:

Now that we can compute frequencies of interest, one question remains: How many harmonics do we want? The maximum answer depends on N, the number of samples in the signal. I won’t go into the details (research the Nyquist rate if you’re interested), but for real-valued signals like our song, the highest harmonic that concerns us is fN/2. That is, if there are N real-valued samples in x[n], we’re going to compute frequency components for only N/2 frequencies.
For example, the fundamental frequency of our song is given by the following:
This is the smallest frequency we’re interested in. The highest frequency that interests us is
To summarize, if the signal lasts for T seconds and consists of N samples, we’re interested in N/2 frequencies, from f1 = 1/T to fN/12 = N/2T. For the song, the frequencies that interest us range from 5.56mHz to 22.05KHz.
The frequency component of x[n] at f is computed by taking the dot product of x[n] with a vector whose values change at the single frequency f. We know what values of f interest us, but how do we compute their corresponding single-frequency vectors?
As it turns out, each value in a single-frequency vector is a complex number. The real part is a cosine, and the imaginary part is a negative sine. If the single-frequency vector has frequency f, the complex number at time t is denoted Wft:
wft = cos(2π ft)-isin(2π ft)
As explained earlier, we’re not interested in every value of f, just the harmonics: f1 through fN/2. At f1, the equation for W becomes
Figure 17.2 shows what W looks like as t ranges from 0 to T, the length of time represented by the signal. The graphs depict W at the signal’s fundamental frequency f1, so the sine and cosine only oscillate once. If the graph depicted W at f2, the graphs would cycle twice from 0 to T. You should ponder this until the relationships between W, fk, and T become clear.
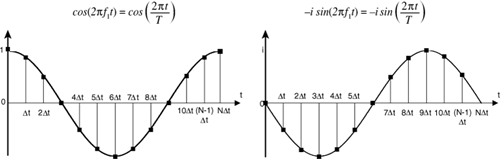
The square points on the graph are the values of W, where t is a multiple of the sampling interval Δt. These values are placed in the W vector, and there are just as many elements in W as there are in x[n]. The dot product of this W vector and x[n] equals the frequency component of x[n] at f1.
I’m almost finished explaining the DFT, but a change in notation is necessary. That is, Wft needs to be rewritten in a form that accounts for n, the index in the time-vector, and k, the index of the frequency harmonic.
To make this change, keep in mind that x[n] = x(nΔt) and fk = k/T. Further, the signal’s duration T can be divided into N samples, each of length Δt. This means T = NΔt. With these relationships, the formula for W can be changed to
This equation makes the values in W dependent on the values of n, k, and N. For this reason, the vector is commonly referred to as WNnk. The following equation makes this clear:
At this point, you should have a good idea what x[n] is and the significance of its dot product with values of WNnk. The DFT is an equation that shows how to obtain frequency components from a time vector. The frequency component of x[n] at fk is denoted X[k], and it’s computed by the DFT equation:
This is called the forward DFT because it converts time vectors to frequency vectors. The inverse DFT converts X[k] back to x[n], but its derivation lies beyond the scope of this book. Instead, let’s walk through a simple example of how the DFT works.
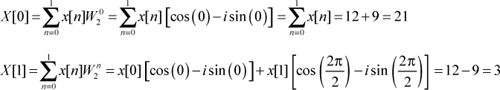
A rectangular pulse is a signal that begins with a constant, nonzero value and drops to zero. Figure 17.3 shows the graph of the time signal, x(t).
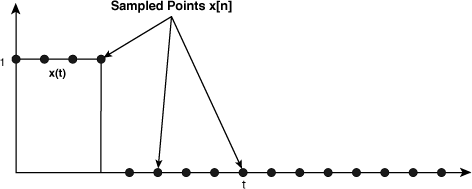
The time vector, x[n], is created by sampling x(t) at 16 equally spaced points: the first 4 equal 1 and the last 12 equal 0. This makes the DFT easy to compute. The first four values of X[k] are calculated here:
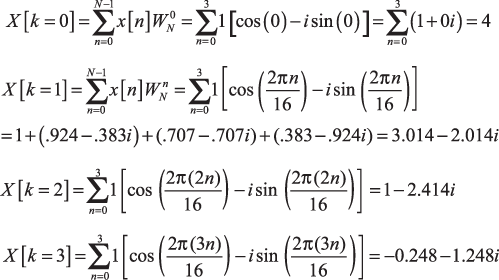
Figure 17.4 shows the real and imaginary parts of the 16 frequency values, X[0] through X[16].
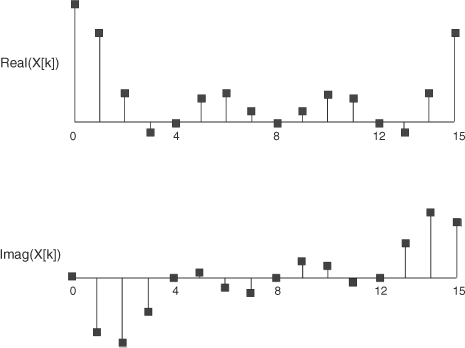
Figure 17.4 seems to contradict the discussion so far in two respects. First, the graphs display the value of X[0] despite the fact that f1 is supposed to be our lowest frequency of interest. But this value of f isn’t a harmonic; X[0] is the component of the time-domain signal that doesn’t oscillate at all. As shown by the DFT calculation, X[0] is just the summation of the values in the time-domain signal.
Second, Figure 17.4 shows the values of N frequency components despite the fact that we’re only interested in N/2 frequencies. If you look closely, however, you can see the symmetry in both graphs. For the values of Real(X[k]), the values from N/2 + 1 through N−1 are reflected across N/2. That is, Real(X[5]) = Real(X[11]), Real(X[6]) = Real(X[10]), and so on. For the values of Imag(X[k]), the values from N/2 + 1 through N−1 are reflected and negated. Imag(X[5]) = −Imag(X[11]), Imag(X[6]) = −Imag(X[10]), and so on.
The point here is that, for real-valued signals, computing frequency components beyond X[N/2] doesn’t provide any new information. As long as you have components for our frequencies of interest, you can use symmetry to determine the components at higher harmonics. The general DFT, however, assumes that the input signal is complex valued. Symmetry isn’t guaranteed for complex signals, and for this reason, the DFT computes frequency components for harmonics up to fN−1.
The N dot products of the DFT can be grouped together into a single matrix equation, X = WNx, where WN has the structure shown in Figure 17.5. This is called the DFT matrix.
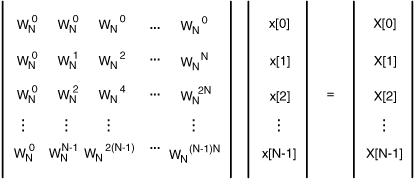
Examining this matrix, it should be clear that the DFT requires N2 complex multiply and accumulate operations. This can take a great deal of time, especially when tens or hundreds of thousands of samples are taken.
The FFT achieves the same result as the DFT, but only uses Nlog2N complex operations. It accomplishes this by taking advantage of mathematical characteristics of the sine and cosine functions.
The FFT performs the same task as the DFT: It transforms vectors in the time domain to vectors in the frequency domain, and vice versa. The difference is that the FFT takes advantage of certain properties of the DFT to speed up computation. These properties are as follows:
The stretching property—. What happens to the frequency response when you double the number of samples by adding 0s between signal values?
The shifting property—. What happens to the frequency response when you shift the signal in time?
The addition property—. What happens to the frequency response when you add two signals together?
These questions are fascinating in their own right, but when you understand the answers, you’ll understand how the FFT works and why it’s so much faster than the DFT. I’m not going to derive these properties mathematically, but I’ll do my best to provide an intuitive understanding of what they mean.
When it comes to sampled signals, stretching refers to doubling the number of samples by placing a zero after each of the original points. When the DFT is computed for the 2N values, all the old N frequency components remain. But there’s a significant change: The frequency response is repeated for the higher frequencies. That is, X[N...2N−1] = X[0...N−1]. Figure 17.6 illustrates this for a triangular signal.
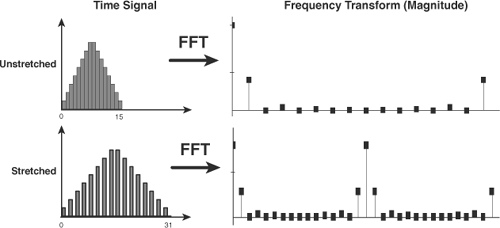
This property may seem bizarre at first. To understand why the frequency response is repeated for the stretched signal, you need to picture the sinusoids at frequencies k and k+N, where k is a frequency index between 0 and 2N. The sinusoid at k+N oscillates so quickly that, not only does it complete a cycle within two samples, but it also reaches the same values of the sinusoid with frequency k.
Shifting is simpler to understand than stretching. A signal is shifted if it is pushed left or right in the time domain. The magnitude of a shifted signal’s frequency response doesn’t change: A shifted sound from a double bass will still have the same low pitch. But shifting changes the real and imaginary parts of the frequency response. This is shown in Figure 17.7, which presents the frequency responses of a pulse before and after shifting.
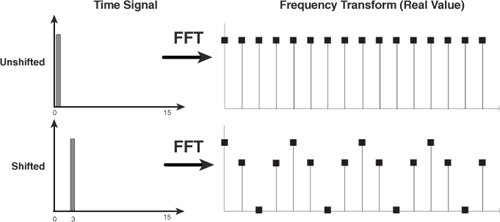
In this example, the real part of the DFT of the shifted signal is the same as the real part of the DFT of the original signal multiplied by a cosine. The imaginary part is multiplied by a negative sine. This can be demonstrated mathematically. If x[m] equals x[n-n0], the DFT of x[m] is given by
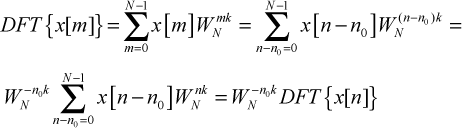
This relationship means we can shift signals however we like as long as we multiply the real and imaginary parts of the unshifted frequency response by a cosine and sine.
The addition, or superposition, property is the simplest of the three DFT properties under discussion. If signal x[n] has a frequency response of X[k] and signal y[n] has response Y[k], the frequency response of x[n] + y[n] = X[k] + Y[k]. The proof is given by
The addition property isn’t particularly deep or complex, but it’s necessary in the discussion that follows.
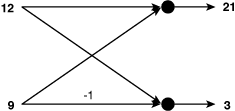
The Cooley-Tukey FFT can be computed for any vector whose size is a (positive) power of 2. So let’s look at a simple two-point transform. If x[0] = 12 and x[1] = 9, the values of X[0] and X[1] are calculated as follows:
Simple, isn’t it? A two-point DFT (and FFT) returns the sum and difference of the two input values. This operation is depicted graphically by a butterfly diagram, shown in Figure 17.8. Each dotted point represents a sum and the −1 shows that x[1] must be multiplied by −1 before being added in the lower sum.
Let’s double the number of samples to four and place a zero after each of the original samples. That is, x[n] = [12, 0, 9, 0]. According to the stretching property, the resulting frequency response is the two-point frequency response repeated, and therefore equals {21, 3, 21, 3}.
Next, we’ll look a second stretched signal, y[n] = [6, 0, 18, 0]. Its frequency response, Y[f] = {24, −12, 24, −12}. If y[n] shifts right once, the result is y’[n] = [0, 6, 0, 18], and the new frequency response, Y’[f], is given by the following:
When the two signals, x[n] and the shifted y’[n], are added together, the result is z[n] = [12, 6, 9, 18]. By the addition property, the frequency response of the sum equals the sum of the frequency responses, so Z[k] = X[k] + Y’[k] = [21, 3, 21, 3] + [24, −12i, −24, 12i] = [45, 3−12i, −3, 3+12i]. The butterfly diagram for this four-point transform is shown in Figure 17.9.
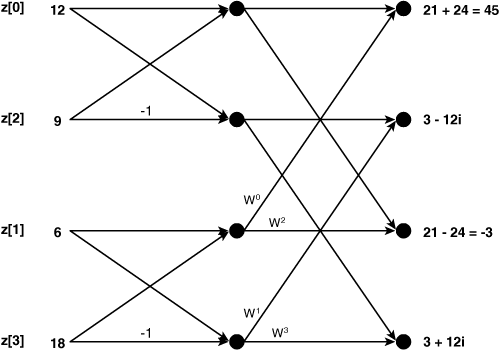
We’ve taken the transforms of two 2-point vectors and used the results to compute the transform of a 4-point vector. This can be continued further: Two 4-point transforms can be used to compute an 8-point transform, two 8-point transforms can be used to compute a 16-point transform, and so on. This is the essence of the FFT: The transform is computed in log2N stages. Each stage adds the results of the previous stage and shifts where needed.
Note that for the 4-point butterfly, the vector elements are accessed in a specific order: 0, 2, 1, 3. For an 8-point transform, the elements are accessed as 0, 4, 2, 6, 1, 5, 3, 7. Placing these elements in this order is called bit-reversal because the elements of the new order can be found by reversing the binary representations of the elements in the original order. That is, the bit reversal of [000, 001, 010, 011, 100, 101, 110, 111] yields [000, 100, 010, 110, 001, 101, 011, 111].
Bit reversal and butterfly diagrams. The theory is hard to grasp at first, but don’t worry if you haven’t followed the discussion in full. The functions in the SDK’s libfft_example and libfft libraries handle the ugly details for you.
Unlike the code libraries presented in earlier chapters, there are no long tables of functions associated with the Example FFT library. Instead, there are only two main functions: one that executes a 1D FFT on an SPU and one that performs a 2D FFT on either the SPU or PPU. Both functions are implemented in header files, which means they are automatically inlined within code.
The libfft_example functions operate only on input arrays whose length is a power of 2. This is important to keep in mind, because this restriction doesn’t apply to the functions in libfft.
The function fft_1d_r2 performs a one-dimensional, complex-valued, single-precision FFT on any input vector whose length is a power of 2. Its full signature is given as follows:
void fft_1d_r2(vector float *out, vector float *in, vector float *W, int
log2_size)
If out equals in, the FFT will execute in place without any loss of speed or accuracy. The value of log2_size must be greater than or equal to 5. That is, fft_1d_r2 only computes FFTs for data sizes greater than or equal to 32.
The function’s arguments are easy to understand but the format of the vector arrays needs explanation. Complex values in the out, in, and W arrays are stored in real-imaginary pairs. That is, each vector float contains two complex numbers in a real-imaginary-real-imaginary sequence. This is shown in Figure 17.10 for a vector float in the in vector.
The code in Listing 17.1 performs a one-dimensional FFT using fft_1d_r2. To keep things simple, the input signal is a rectangular pulse similar to the example signal in Section 17.1, “Introducing Frequency Analysis and the Discrete Fourier Transform.”
Example 17.1. 1D FFT Example: spu_onedfft.c
#include <math.h>
#include <stdio.h>
#include "libfft_example.h"

#define N 64
#define log2_size 6

int main(int argc, char **argv) {

   int i;
   float in[2*N], out[2*N], W[N/2]
      __attribute__ ((aligned (16)));

   /* Initialize the input vector: square wave */
   for(i=0; i<N/2; i+=2) {
      in[i] = 1.0;
      in[i+1] = 0.0;
   }

   for(i=N/2; i<2*N; i+=2) {
      in[i] = 0.0;
      in[i+1] = 0.0;
   }

   /* Initialize the W vector */
   for (i=0; i<N/2; i+=2) {
      W[i] =  cos(((double)i * M_PI)/N);
      W[i+1] = -sin(((double)i * M_PI)/N);
   }

   /* Compute the FFT and display the results */
   fft_1d_r2((vector float*)out, (vector float*)in,
      (vector float*)W, log2_size);
   for (i=0; i<2*N; i+=2) {
      printf("%f + %fi
", out[i], out[i+1]);
   }
   return 0;
}
Most of this code simply initializes the in and W arrays. The first N/4 values of in are set to 1 + 0i, and the rest of the values equal 0. The shape of the frequency response is similar to that of the example in Figure 17.4.
Initializing W is more complicated, but only slightly. fft_1d_r2 doesn’t require all N complex values. Thanks to symmetry, it only needs N/4. These are generated with the following code:
for (i=0; i<N/2; i+=2) {
   W[i] =  cos(((double)i * M_PI)/N);
   W[i+1] = -sin(((double)i * M_PI)/N);
}
Remember that N/4 complex values requires N/2 floating-point values. They are stored in real-imaginary pairs.
The 2D FFT is similar in purpose to the 1D FFT, but is commonly used for images whose spatial frequencies provide important information. Many image-processing routines depend on the 2D FFT, such as geological fault detection and visual pattern recognition.
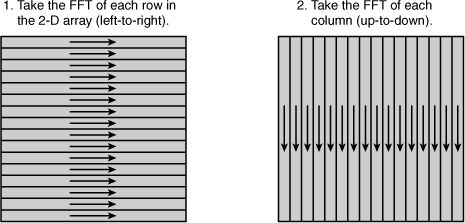
If the input signal is structured as an NxN matrix, the 2D FFT starts by computing the 1D FFT of each row of the matrix. Then it computes the 1D FFT of each column in the resulting matrix, as shown in Figure 17.11.
As shown, a 2D FFT of an NxN matrix performs 2N 1D FFTs. Therefore, it requires 2N*Nlog2N complex multiply and accumulate operations.
The Example FFT library provides two functions that work together to compute the 2D FFT. The first, _init_fft_2d, generates trigonometric values for use by the second function, fft_2d, which computes the transforms. It might seem odd to have a separate function for initialization, but the reason is simple. fft_2d doesn’t perform the entire transform at once, so it has to be repeated in a loop. There’s no need to repeatedly generate trigonometric values.
_init_fft_2d accepts a single parameter as its argument: log2N, where N is the number of row/column elements in the NxN input array. Its full signature is given by
void _init_fft_2d(int log2N)
fft_2d actually transforms the input, and its signature is given by
fft_2d(vector float *in_real, vector float *in_imag, vector float *out_real,
vector float *out_imag, int forward)
These arguments differ significantly from those of fft_1d_r2. Four differences are as follows:
Real and imaginary values must be placed in separate vectors.
The function cannot be used for in-place computation: The input and output pointers must refer to different memory locations.
No inputs for the W vector or vector size. (
_init_fft_2dtakes care of this.)The forward parameter specifies whether the transform is forward (non-0) or inverse (0).
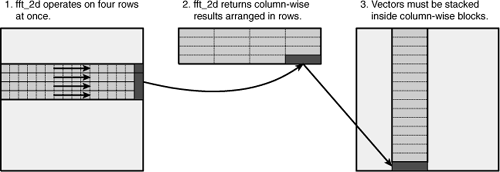
As mentioned earlier, fft_2d doesn’t perform the entire 2D FFT at once. It operates on four rows at a time and arranges the result to simplify computation. In effect, it performs four 1D FFTs and then flips the result vectors to form a 4xN result matrix, as shown in Figure 17.12.
To appreciate why this arrangement is so helpful, it’s important to see how the 2D FFT would have to be performed using successive calls to fft_1d_r2. To transform in[N][N] to out[N][N], the code would be implemented as follows:
for(i=0; i<N; i++)
   fft_1d_r2(temp[i], in[i], W, log2N);
matrix_transpose(temp);
for(i=0; i<N; i++)
   fft_1d_r2(out[i], temp[i], W, log2N);
matrix_transpose(out);
The transposes are necessary because the 2D FFT requires that both the rows and columns of the input be converted to the frequency domain. Now you can see the advantages of fft_2d: It operates on four rows at a time and transposes the data with each operation. The code becomes
for(i=0; i<N; i+=4) {
   fft_2d(A_real[i], A_imag[i], buffer_real, buffer_imag);
   place_buffer_in_B_matrix();
}
for(i=0; i<N; i+=4) {
   fft_2d(B_real[i], B_imag[i], buffer_real, buffer_imag);
   place_buffer_in_A_matrix();
}
Listing 17.2 shows how fft_2d is used in practice. The application creates a cylindrical pulse—the two-dimensional equivalent of the rectangular pulse—and computes its frequency response.
Example 17.2. 2D FFT Example: spu_twodfft.c
#include <math.h>
#include <stdio.h>
#include "libfft_example.h"

#define N 64
#define log2_size 6

int main(int argc, char **argv) {

   int i, j;
   vector float a_real[N*N/4], a_imag[N*N/4];
   vector float b_real[N*N/4], b_imag[N*N/4];
   vector float buffer_real[N], buffer_imag[N];

   /* Create a cylindrical wave in the a matrix */
   for (i=0; i<N; i++) {
      for (j=0; j<N; j++) {
         ((float*)a_imag)[i*N+j] = 0.0;
         if((i-N/2)*(i-N/2) + (j-N/2)*(j-N/2)
            < (N/4)*(N/4))
            ((float*)a_real)[i*N+j] = 1.0;
         else
            ((float*)a_real)[i*N+j] = 0.0;
      }
   }

   /* Initialize the transform */
   init_fft_2d(log2_size);

   /* Convert data from the time domain
      to the frequency domain */
   for (i=0; i<N/4; i++) {
      fft_2d(&a_real[N*i], &a_imag[N*i],
         buffer_real, buffer_imag, 1);
      for (j=0; j<N; j++) {
         b_real[i+N/4*j] = buffer_real[j];
         b_imag[i+N/4*j] = buffer_imag[j];
      }
   }

   for (i=0; i<N/4; i++) {
      fft_2d(&b_real[N*i], &b_imag[N*i],
         buffer_real, buffer_imag, 1);
      for (j=0; j<N; j++) {
         a_real[i+N/4*j] = buffer_real[j];
         a_imag[i+N/4*j] = buffer_imag[j];
      }
   }

   /* Display the results */
   for(i=0; i<N*N; i++) {
      printf("%f + %fi
", ((float*)a_real)[i],
         ((float*)a_imag)[i]);
   }
   return 0;
}
For performance reasons, this code stores two-dimensional values in one-dimensional arrays. To conserve memory, the application places input values in a_real and a_imag, and then places the output in the same arrays.
The SDK provides a second FFT package as part of the Extras ISO. To install this, mount the ISO file as shown in Chapter 2, “The Cell Software Development Kit (SDK),” and enter the following command:
yum install libfft libfft-devel
This places the FFT library files in the /opt/cell/sdk/prototype directory. There are different libraries for the PPU and SPU. PPU files can be found in /opt/cell/sdk/prototype/usr, and SPU files are in /opt/cell/sdk/prototype/usr/spu. This section describes the PPU functions in libfft and then describes the SPU functions in libfft_spu.
The libfft_example functions operate only on array lengths that equal a power of 2, but the libfft/libfft_spu functions are more flexible. They can transform any array whose size can be factored into powers of 2, 3, 5, and 7. For example, libfft_example functions can’t operate on a vector with 525 (3*5*5*7) elements, but the routines in libfft/libfft_spu can.
The performance of the libfft/libfft_spu functions depends on the size of the input array. At small sizes, the functions improve performance with multibuffering and striped register placement. At larger sizes, the functions rely solely on loop unrolling. If your data size is a power of 2, you might want to experiment to determine whether libfft_example or libfft/libfft_spu provides faster computation.
The PPU functions in libfft perform the same FFT operations as the PPU functions in libfft_example, but with two important differences. First, the libfft functions run on the PPU and access multiple SPUs for the computation. Second, the libfft routines are easier to understand and use. Table 17.1 lists many of them, but not all.
Table 17.1. PPU Functions in libfft
Function Name | Purpose |
|---|---|
| Initialize a 1D FFT |
| Perform the FFT on |
| Deallocate memory for the FFT handle |
| Initialize the SPUs to run the 2D FFT |
| Performs the FFT on the 2D |
| Deallocate memory for the FFT handle |
The first six entries perform the 1D and 2D FFT in a straightforward manner. You don’t have to generate trigonometric coefficients or call the functions multiple times. Both transforms accept input and output data structured in real-imaginary-real-imaginary form.
The flags parameter in fft_1d_initialize and fft_2d_initialize customizes the operation of the transform. Values for flags include the following:
FFT_DOUBLE_PRECISIONFFT_INPUT_REALFFT_OUTPUT_REALFFT_TILEDFFT_TILE_TO_RECTANGULARFFT_TYPE_C2CFFT_TYPE_R2CFFT_TYPE_C2RFFT_ARRAY_OF_ROWS
The FFT_TYPE flags enable you to set whether you want the FFT to be complex-to-complex (C2C), real-to-complex (R2C), or complex-to-real (C2R). The inverse transform will be computed if inverse_flag is set to 1, and a value of 0 will compute the forward FFT.
The code in Listing 17.3 uses libfft functions to perform a 2D FFT. This simple application creates the same 2D array as in Listing 17.2 and arrives at the same result.
Example 17.3. PPU FFT Library Example: ppu_libfft.c
#include <math.h>
#include <stdio.h>
#include <stdlib.h>
#include "libfft.h"

#define NROWS 64
#define NCOLS 64

int main(int argc, char **argv) {

   /* Allocate and align memory */
   volatile unsigned int ptr;
   posix_memalign((void**)&ptr, 128,
      sizeof(float)*2*NCOLS*NROWS);
   float **in_data = (float **)ptr;
   posix_memalign((void**)&ptr, 128,
      sizeof(float)*2*NCOLS*NROWS);
   float **out_data = (float **)ptr;

   /* Initialize the input data */
   int i, j;
   float *in_array = (float*)in_data;
   for(i=0; i<NROWS; i++)
      for(j=0; j<NCOLS; j+=2) {
         if((i-NROWS/2)*(i-NROWS/2) +
            (j-NCOLS/2)*(j-NCOLS/2)
            < (NROWS/4)*(NCOLS/4))
            in_array[i*NROWS+j] = 1.0;
         else
            in_array[i*NROWS+j+1] = 0.0;
      }

   /* Perform the transform with six SPUs */
   fft_2d_handle_t handle;
   fft_2d_initialize(&handle, 6, FFT_TYPE_C2R);
   fft_2d_perform(handle, (void**)in_data,
      (void**)out_data, NROWS, NCOLS, 0);
   fft_2d_terminate(handle);

   /* Deallocate memory */
   free(in_data);
   free(out_data);
   return 0;
}
Memory allocation is the most important step. fft_2d_perform accepts double pointers for the input and output parameters. In Listing 17.3, the allocation is handled by posix_memalign. The data will be sent to SPUs, so it’s important to align the pointers on 16-byte boundaries.
The FFT library functions for the SPU compute only one-dimensional transforms. These are declared in libfft_spu.h, which can be found in /opt/cell/sdk/prototype/usr/spu/include. Table 17.2 lists all three of them.
Table 17.2. SPU Functions in libfft_spu
Function Name | Purpose |
|---|---|
| Transform |
| Transform |
| Transform |
These are all simpler than the one-dimensional FFT function in libfft_example, fft_1d_r2. No trigonometric constants are required and there’s no need to enter the base-2 logarithm. Most important, the libfft_spu functions can directly perform complex-to-real transforms with fft_1d_c2r_spu and real-to-complex transforms with fft_1d_r2c_spu. Listing 17.4 shows how fft_1d_c2r_spu is used in practice.
Example 17.4. SPU FFT Library Example: spu_libfft.c
#include <math.h>
#include <stdio.h>
#include "libfft_spu.h"

#define N 64

int main(int argc, char **argv) {

   int i;
   float in[2*N], out[N];

   /* Initialize the input vector
      with a square wave */
   for(i=0; i<N/2; i+=2) {
      in[i] = 1.0;
      in[i+1] = 0.0;
   }

   for(i=N/2; i<2*N; i+=2) {
      in[i] = 0.0;
      in[i+1] = 0.0;
   }

   /* Perform the transform */
   fft_1d_c2r_spu(N, (vector float*)in,
      (vector float*)out);
   return 0;
}
The libfft_spu.h header includes the libfft.h header, so it’s important to identify both include directories in the build command. Both libfft and libfft_spu require libm, so -lm must be included in the link step.
From cell phones to radio telescopes, modern digital signal processing systems demand rapid frequency analysis. The fast Fourier transform (FFT) is the most common algorithm for extracting frequency information from signals, and the Cell processor provides a great deal of capability for performing FFTs at high speed.
This chapter has discussed both the theory and practice behind the FFT. The presentation began with a description of the basic discrete Fourier transform (DFT), from its algorithm to its practical implementation. Then three of its important properties—shifting, stretching, and adding—were explored. When taken advantage of, these properties make it possible to dramatically improve the performance of DFT computation. The result is the FFT.
This rest of the chapter discussed how to compute FFTs with the libraries included in the Cell SDK. The first library, libfft_example, contains routines that perform 1D and 2D FFTs. These functions aren’t particularly convenient or configurable: Trigonometric constants need to be generated and only power of 2 data sizes can be transformed. But libfft_example functions operate at high speed.
The functions in the libfft and libfft_spu libraries are more convenient. The function names are self-explanatory, no trigonometric constants need to be derived, and real/imaginary values can be placed in a single array. The functions can operate on any data size that can be factored into powers of 2, 3, 5, or 7. However, the performance of the libfft/libfft_spu functions does not generally compare well to similar routines in libfft_example.