Chapter 18. Profiling and Monitoring Java Applications Using the Sun JDK Tools
The Sun JDK Profiling and Monitoring Tools
If you are using Java 5 or better, some of the most readily
available profiling tools come bundled with your JDK. The Java
Monitoring and Management Console tool, also known as jConsole, can be a
valuable aide in monitoring your applications and identifying performance
issues. The jConsole tool has a lot going for it as a first line performance
profiling tool: it is readily available in any recent JDK distribution, you
don’t need to instrument or modify your code in any way, and you can run it with
a minimum of configuration against local or remote Java applications. Heap
analysis tools such as jhat help you identify
and track down memory leaks.
Note that the tools we discuss here relate in particular to the Sun JDK. Although they may work with other JVMs, such as BEA’s JRockit and the IBM virtual machines, these JVMs usually have their own more specific profiling tools.
The following articles discuss ways that you can use jConsole to monitor and analyze Java application performance on your own local machine and also on remote servers. When not otherwise stated, the tools used refer to the Java 6 versions.
Connecting To and Monitoring a Java Application with jConsole
Arguably one of the most useful of the JDK tools, JConsole is a graphical tool that uses JMX to monitor and report on the activities and resource use of Java applications. This section explains how to connect to and monitor a Java application running either locally or on another server.
JConsole works with applications running under Java 5 or Java 6. Java 5 comes bundled with JMX 1.2, but you do need to activate the JMX Agent at runtime when you start the application that you want to monitor. To monitor an application locally, you need to specify the (rather counterintuitively named) com.sun.management.jmxremote Java system property, as shown here:
$ java -Dcom.sun.management.jmxremote -jar myapp.jar
In Java 6, it is much easier to connect to local Java application with JConsole. The Java 6 version of jConsole can dynamically connect to and monitor any local application running in a Java 6 VM. JConsole dynamically activates the JMX management agent in the target VM, so you no longer need to start the monitored application in any particular way. This is very useful for analyzing performance issues in locally running applications with minimum effort.
Although this is the most convenient way to monitor an application, you should not use it to monitor applications running on a production server. JConsole can be demanding in terms of both memory and CPU, so you should run it on a separate machine (for example, your development workstation), connecting to the target VM over the network. JConsole can do this perfectly well, both in Java 5 and Java 6, but it requires some configuration of the target VM. You need to start the target JVM with (at least) the com.sun.management.jmxremote.port Java system property, which specifies the port to be used for JMX monitoring:
$ java -Dcom.sun.management.jmxremote.port=3000 -jar myAppInProduction.jar
This will enable you to monitor the application via JMX/RMI through the 3000 port.
In a real production environment, access will typically be secured and you will usually need to provide a username and password. This is fairly easy to set up and is well documented in the Sun documentation, so we won’t be covering it here. Just be aware that you will probably need a user account and a cooperative system administrator to monitor a Java application on a production box.
You start jConsole from the command line as follows:
$ jconsole
This will open a window listing the JMX-compatible applications currently running on the local machine (see Figure 18-1). Alternatively, if you need to connect to an application running on a remote server, you can specify the address of a remote machine along with the JMX port for this application.
In some Windows environments, the Java process names are not very informative, and only the process IDs are displayed. In these cases, you may have trouble working out exactly what process you are supposed to be monitoring. Knowing the process ID you want can be a great help. In addition, if you know the process ID of the task you’re after, you can save a bit of time using this process ID to connect directly to the application from the command line. On a Unix system, this is fairly easy to do using the ps command, as in the following example:
$ ps aux | grep java
Another command-line tool for discovering Java process IDs is jps, which lists the current Java process (for the current user):
C:> jps -l
984 com.xmlmind.xmleditapp.start.Start
3068 org.apache.catalina.startup.Bootstrap
3108 sun.tools.jps.Jps
$ jconsole 3068
The jps command-line tool is convenient, and it has the advantage of running on all platforms. However, it doesn’t always display all the Java processes running on a Windows machine. It will not pick up a Tomcat instance run as a service on a Windows server, for example, if the service has been started under another account. In fact, in a Windows environment, a more reliable alternative is to identify the application instance using the Windows Task Manager.
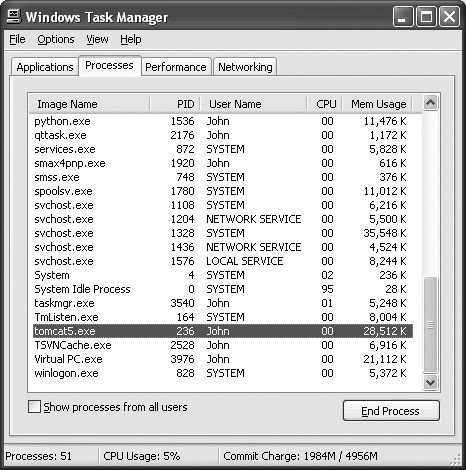
It is fairly easy to use the Windows task manager to determine the process ID of the application you want to monitor. To do this, start up the Windows task manager, and open the “View→Select Columns...” menu. Then check the PID box so that process IDs are displayed as well as the application names. Now, in the Processes tab, you will be able to see the process id (PID) of each currently running application (see Figure 18-2).
You can also start monitoring a remote application directly from the command line. Just give jConsole the server address and the JMX port, as shown here:
$ jconsole my.production.server:8086
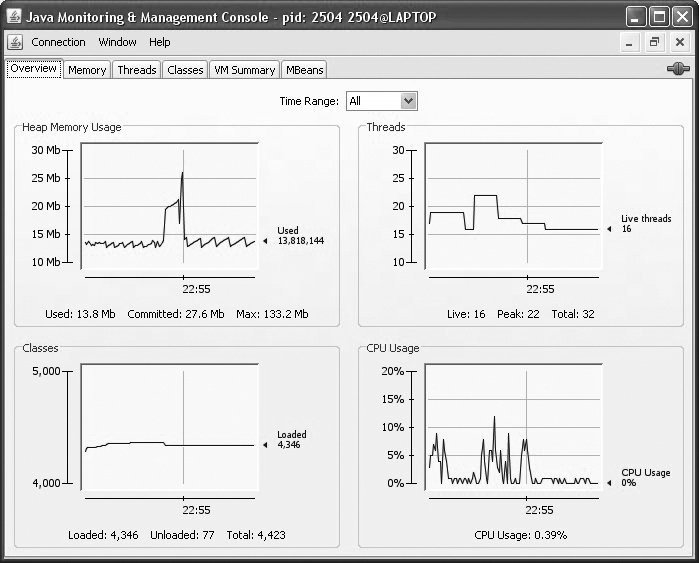
Once connected, the jConsole application displays a summary of the current state of the target application (see Figure 18-3). Later in this chapter, we will see how to use these views to analyze the behavior of your application.
Monitoring a Remote Tomcat Application with jConsole
One common use of jConsole is to monitor an application deployed on a Java servlet container or application server such as Tomcat or JBoss. In this section, we will go through how to configure and monitor a Tomcat server using jConsole. The general approach—and, in particular, the script-based approach—is similar for other application servers.
As we noted earlier, for obvious security reasons, you can’t just connect to any old Tomcat instance on a remote server; the server has to be configured correctly to allow remote monitoring of the Tomcat instance. In a Unix environment, you need to modify the Tomcat startup script to enable JMX monitoring. This simply involves integrating the appropriate JMX Java System properties into the Tomcat startup process. In Tomcat, you can either modify the JAVA_OPTS variable or the CATALINA_OPTS variable. Modifying the JAVA_OPTS variable will also work with most other Java application servers. In this example, we activate JMX on port 8086, and (for simplicity) deactivate SSL authentication, which would otherwise be activated by default:
JAVA_OPTS="$JAVA_OPTS "-Dcom.sun.management.jmxremote"
"-Dcom.sun.management.jmxremote.port=8086"
"-Dcom.sun.management.jmxremote.ssl=false"
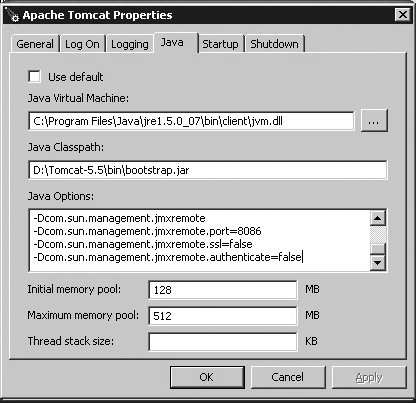
"-Dcom.sun.management.jmxremote.authenticate=false"In a Windows environment where Tomcat has been installed as a service, open the “Apache Tomcat →Configure Tomcat” menu on the server, or run the tomcat5w application which can be found in the Tomcat bin directory. Go to the Java tab and add the following options at the end of the list of usual options (see Figure 18-4):
-Dcom.sun.management.jmxremote
-Dcom.sun.management.jmxremote.port=8086
-Dcom.sun.management.jmxremote.ssl=false
-Dcom.sun.management.jmxremote.authenticate=false
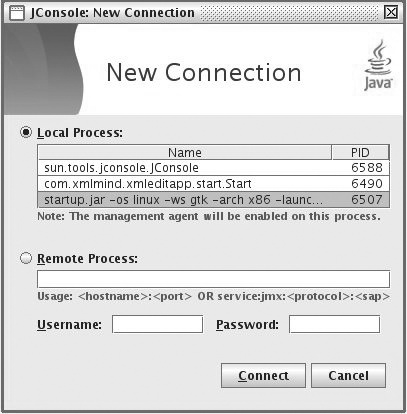
Back on your development machine, you can now connect to the Tomcat instance by choosing the “Remote Process” option in the “New Connection” dialog box (see Figure 18-5), specifying the remote server URL and port, as well as the username and password if needed for a secure connection.
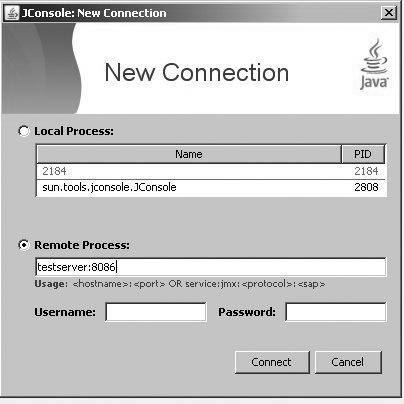
If no authentication is required, you can also run jConsole directly from the command line or by specifying the URL and port:
D:> jconsole testserver:8086
Detecting and Identifying Memory Leaks with the JDK Tools
A common misconception about Java memory management is that, as a developer, you don’t need to worry about it. The JVM takes care of everything, using a magical device called a garbage collector (or GC for short). Whenever you create a new object, the JVM automatically allocates the memory it needs, and recuperates it when you’ve finished using the object.
This is true up to a point. However, memory leaks can and do exist in Java
applications. The Java JVM recycles any unreferenced objects it finds, but
objects that are not released (such as objects in a cache) cannot be recuperated
by the garbage collector, no matter how clever it is. Memory leaks are
notoriously hard to isolate and track down and harder still to reproduce, often
popping up only once your application has been deployed into production. They
represent a major threat to application stability: if undetected or left
unattended, a memory leak can lead to the application crashing with an
OutOfMemoryException.
If you find yourself confronted by the dreaded
OutOfMemoryException error, or if you just want to
make sure it won’t happen to your application, jConsole is a good starting
point. jConsole is also a handy way to keep an eye on memory-consumption over a
long period, such as during User Acceptance Testing. Because memory-related
issues often appear for the first time when an application is left running over
a long period of time, this can be a good way of catching memory leaks before
the application goes into production.
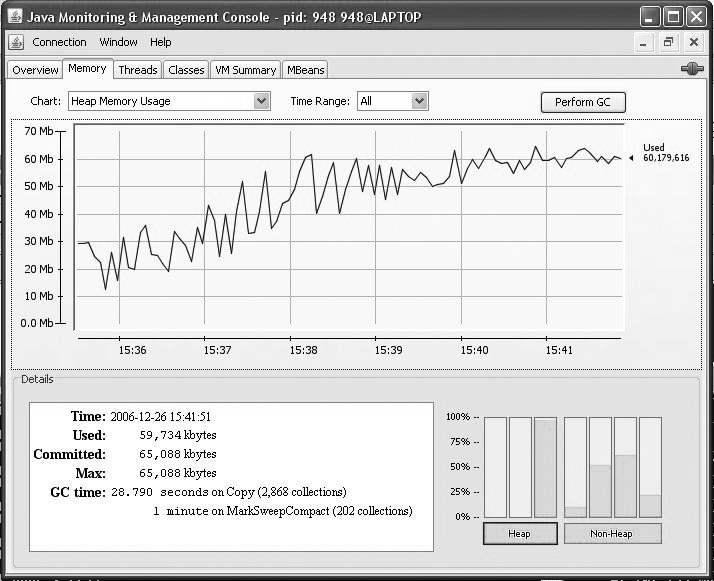
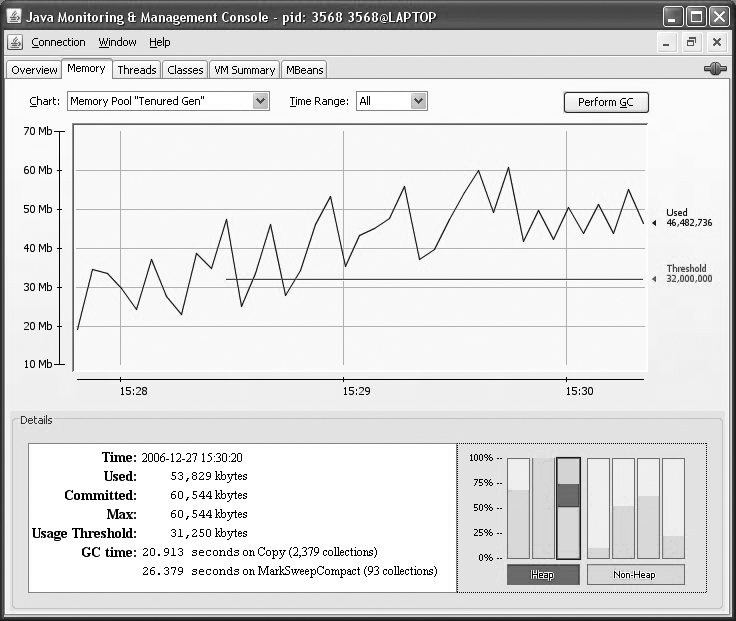
The Memory tab (see Figure 18-6) is the first and most obvious port of call for memory-related issues. It gives you a graph of memory usage over time, either globally or for different types of objects. It also gives you an idea of how hard the garbage collector is working: a GC on overtime is often a sign of a poorly configured and poorly performing application.
The Overview tab (see Figure 18-3) can also be useful, since it gives you a quick summary of memory usage, active threads, loaded classes, and CPU usage. It also lets you make correlations between the different graphs: for example, a relationship between periods of heavy CPU usage and sustained increases in the number of loaded classes could indicate a memory leaking issue during data processing.
The JVM stores all class instances and arrays in what is known as heap memory, so this is the place you are likely to look for memory leaks. The obvious indicator that a memory leak is afoot is that heap memory is steadily increasing. You can observe this on the Overview tab, or on the Memory tab. In Figure 18-6, you can observe a potential memory leak. The heap memory is gradually, but steadily, increasing over time. The spikes in the graph show where the garbage collector is trying to do its job. However, despite the GC activity, memory usage keeps going up. In a real application, this may take hours, days, or weeks to appear. An excellent way to provoke this type of error is to perform load-testing using tools such as JMeter (see Chapter 16).
The JVM uses different types of memory to store different types of objects. The heap memory space, which is what you will usually be watching for memory leaks, contains two distinct areas: young generation and old generation. Non–heap memory is used by the JVM to store loaded classes and methods, and other low-level data. Memory leaks are usually only an issue in Heap memory. Without going into too much detail, it is useful to know how these zones are used when tracking down memory-related issues.
The young generation area is split into three distinct zones. The first zone, known as the Eden Space, is where the JVM places newly created objects (hence the name), and is mainly used for short-lived variables such as local variables within a method. When this space becomes too crowded, a fast, lightweight garbage collection process cleans it up and reclaims any unreferenced objects. Objects that are not freed by garbage collections in the Eden space are placed in a second zone, called the Survivor space. In fact, there are two, identically sized survivor spaces. When the first survivor space starts to fill up, a garbage collection frees dead objects and copies live ones into the second survivor space. Objects that stand the test of time and are not recycled from the second survivor space are placed in the old generation, also know as the Tenured Generation. This zone is usually reserved for long-lived objects such as static variables or frequently used cached objects. This space is usually much bigger than the others (by an order of magnitude or two), and memory can only be recycled here by a particularly expensive operation called a “mark and sweep” garbage collection.
When old generation space is running low, a longer, full-scale garbage collection process scans the entire heap space for recyclable objects. Again, this “mark and sweep” garbage collection is a particularly expensive operation and is the sort of thing that can bring your server to its knees if it happens too frequently.
You can see some of the typical symptoms of a memory leak in Figure 18-6. When you have a memory leak, recycled objects progressively fill up first the Survivor space and then the Tenured Generation space. As these larger spaces fill up, the application will slow down as heavy, full-scale garbage collection becomes a recurring activity. Excessive GC activity is also a typical sign of either memory leaks or a poorly configured JVM.
JConsole gives an indication of how full these different spaces are in the bar charts on the lower left of the memory tab. You can zoom in on any one of these zones by clicking on the corresponding bar, or by choosing the memory zone in the “Chart” drop-down list. The GC Time fields show the time spent and the number of operations in both young generation (Copy) and mark and sweep (MarkSweepCompact) garbage collection.
JConsole can also be configured to provide useful visual cues about potential memory leaks. This is a good way to keep tabs on memory consumption over a long period of time (such as during User Acceptance Testing), and can be useful for catching slow-to-appear memory leaks. JConsole lets you define usage thresholds for the various JVM memory pools in the MBeans tab (see Figure 18-7). Threshold values are defined in the “Memory Pool” folder, which can be found in the “java.lang” package on the MBeans tab. The Memory Pool folder contains MBeans for all of the JVM memory pools, both Heap and Non-Heap. The main tool used to watch for memory leaks is the old generation Tenured Generation pool, so this is usually where you will define usage thresholds. Open the Attributes of the “Tenured Gen” and select the “UsageThreashold” attribute. This value is the maximum tolerable value of the old generation heap, in bytes. You can set this to whatever seems sensible for your application. If you set it to zero, the usage threshold will be deactivated.
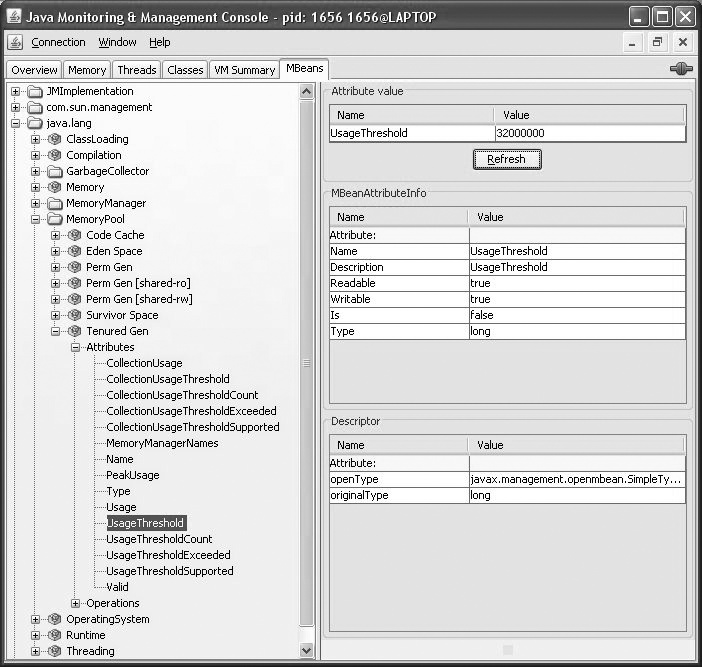
Let’s look at an example. In Figure 18-7, we define a usage threshold of 32000000 bytes (roughly 32 MB) for the Tenured Generation memory pool. In Figure 18-8, we can see this configuration in action. Heap memory is displayed in red, indicating a problem of some sort. The third bar, which represents the Tenured Generation memory pool, is partially displayed in red, showing that Tenured Generation memory has exceeded the threshold we defined.
To get more details, select the Tenured Generation memory pool chart. Here, the usage threshold is shown as a red horizontal line, which makes it easier to see when and by how much the threshold has been exceeded.
Diagnosing Memory Leaks Using Heap Dumps, jmap, and jhat
JConsole is a great tool for detecting memory leaks. Once you have detected a memory leak, however, you need to look further to identify what classes and objects are being leaked, and jConsole is of limited use here. Profiling tools can be a good help here, but tend to be complicated to set up and use. We look at a few profiling tools in this chapter. If you need a quick diagnosis, one alternative is to use some of the tools bundled with the JDK such as jmap and jhat. In this section, we will go through how to use these tools to hunt down memory leaks by analyzing the JVM heap with these tools.
If you just want to take a quick glance at the heap of a running application, you can use the jmap command-line tool to find the PID of the Java application you are interested in (see Connecting To and Monitoring a Java Application with jConsole), and run the jmap command with the -histo option, as follows:
$ jmap -histo 1060
num   #instances    #bytes  class name
--------------------------------------
  1:     97929     4769472  [Ljava.lang.Object;
  2:     40390     4685944  <constMethodKlass>
  3:    116050     4642000  com.equinox.jpt.modelplanes.core.domain.ModelPlane
  4:     40390     3232240  <methodKlass>
  5:    164315     2629040  java.lang.Long
  6:      4862     2597352  [B
  7:     44929     2516024  org.hibernate.engine.EntityEntry
  8:     53272     2369464  <symbolKlass>
  9:      4217     2182784  [I
 10:     89833     2155992  java.util.HashMap$Entry
 ...
This will list the number of instances and total size occupied by objects of each class, sorted by size. This can sometimes give you some good leads. For example, if you see any of your own classes in the top 10, it’s probably a bad sign and should be investigated further.
Using jmap alone can be a good first approach, but it has its limits. A more sophisticated approach is to use jhat. The jhat command-line tool, new to Java 6, is a powerful way of investigating the JVM heap. The first thing you need is a heap dump to analyze. One way is to use the jmap command-line tool, which can obtain the heap dump of a running Java application. Find the PID of the Java application you are interested in (see Connecting To and Monitoring a Java Application with jConsole), and run the jmap command with the -dump option, as follows:
$ jmap -dump:file=dump.bin 1060
Dumping heap to /home/john/dump.bin ...
Heap dump file created
This will generate a binary dump of the JVM heap in a file called dump.bin.
Another option if you suspect memory leaks on a production is to start your application with the -XX:+HeapDumpOnOutOfMemoryError command-line option. This won’t prevent any memory leaks, but it will cause the VM to generate a heap dump, enabling you to analyze the heap afterward, using jhat or some other tool.
Now we need to be able to inspect the contents of the heap dump. This is where jhat comes into action. It analyzes a binary heap dump, and starts up a web server on a local port where you can interactively explore and query the Heap Dump. You run it as follows (the -J-Xmx384m allows a maximum heap space of 384 MB; this option is not mandatory, but jhat is fairly demanding in resources, so you should give it a fair bit of memory to work with):
$ jhat -J-Xmx384m dump.bin
Reading from dump.bin...
Dump file created Tue Dec 26 13:20:27 NZDT 2006
Snapshot read, resolving...
Resolving 949898 objects...
Chasing references, expect 189 dots.............................................
................................................................................
................................................................
Eliminating duplicate references................................................
................................................................................
.............................................................
Snapshot resolved.
Started HTTP server on port 7000
Server is ready.
You can now connect to this site with your favorite browser. The jhat web site won’t win any prizes for its elegant
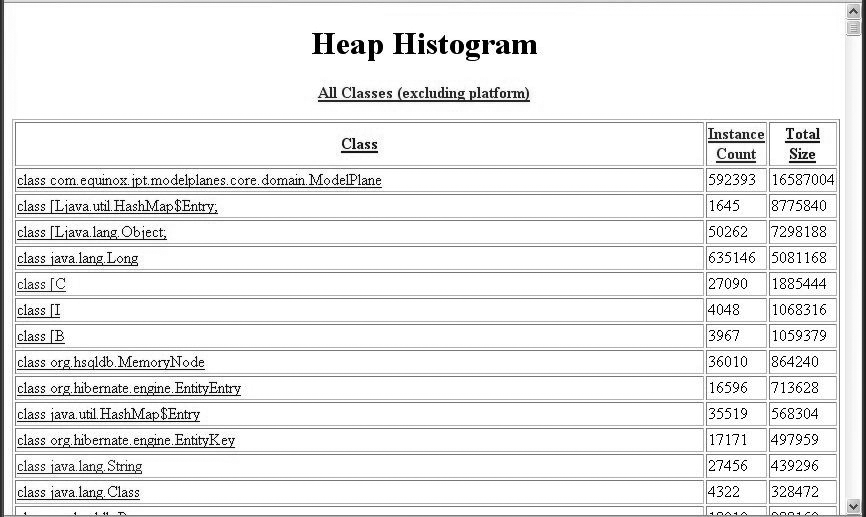
design or usability, but it can provide some useful information. The first place
to look is the heap histogram, which provides a list of the objects in the Heap
(see Figure 18-9). This is similar to the jmap histogram, but with the additional
possibility to sort by size, class, or object count, and to display the class
details. In Figure 18-9, it is fairly easy to see that
there may be an issue with the ModelPlane. (This is of
course a simple example where a memory leak was inserted on purpose; memory
leaks involving Strings or other commonly used classes are usually much harder
to isolate.)
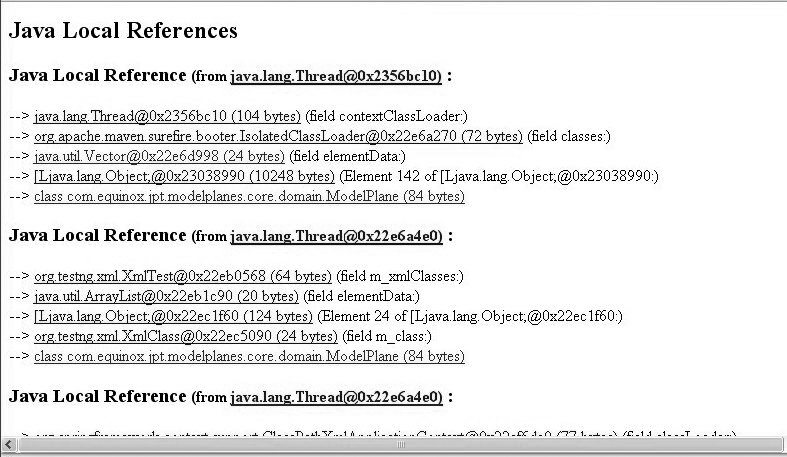
If you click on one of the classes in this page, you will go to the class details page, which displays general information about the class (superclasses, subclasses, members, and so forth), as well as a list of classes that refer to this class. This page also lets you build root reference chains, which are arguably the most useful feature of jhat. You will find these under “Reference Chains from Rootset,” in a section inconspicuously entitled “Other Queries” at the bottom of the screen. A reference chain lists the references to this object, going back up to the root thread (see Figure 18-10). The heap histogram can indicate which objects have been leaked. Using these chains, you can get a fairly good idea of where these leaked objects are being held.
Detecting Deadlocks
You can also use jConsole to easily identify deadlocked threads. If your application seems to hang, you may have a deadlock. In today’s world of multithreaded programming, deadlocks are a common problem. A deadlock occurs when one thread is blocking access to a resource needed by another thread but is itself waiting on a resource held by this second thread.
Deadlocks are often hard to reproduce and, like memory leaks, sometimes won’t appear until the application is in production. Also, like memory leaks, they can sometimes be provoked and detected using load-testing tools such as JMeter (see Chapter 16). However, when the deadlock does occur, it is notoriously hard to track down the source of the problem. This is where jConsole can help.
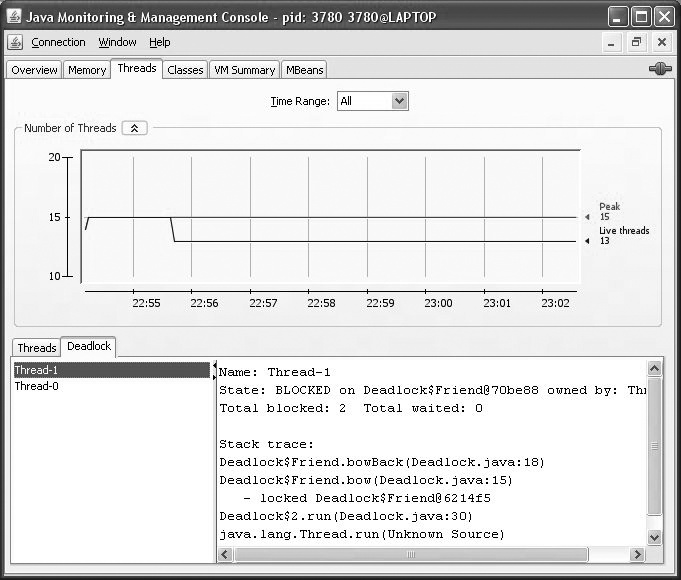
The Threads tab (see Figure 18-11) displays information about threads running in your application, including a graph showing the number of active threads over time, and a list of application threads. Selecting a particular thread will show its the current stack trace. This is useful when you want to observe how your application handles multiple threads. However, the real power of the Threads tab is its ability to detect application deadlocks.
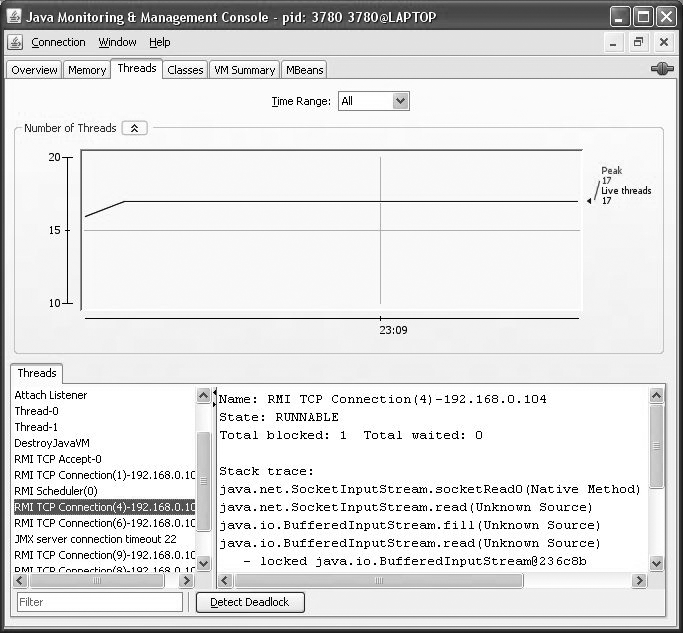
The “Detect Deadlocks” button at the bottom of the screen, new to Java 6, allows jConsole to check your application for deadlocks. Each detected deadlock is displayed in a new tab with a stack dump showing where the deadlock had occurred (see Figure 18-12).