
Chapter 12. Maximizing Test Coverage with Cobertura
Test Coverage
Unit testing is recognized as a crucial part of modern software development practices. Nevertheless, for a number of reasons discussed at length elsewhere, it is often done insufficiently and poorly. Basically, there are two main things that can make a unit test ineffective: it can execute the code but test the business logic poorly or not at all, or it can neglect to test parts of the code. The first case is fairly hard to detect automatically. In this chapter we will look at the second type of issue, which is the domain of test coverage tools.
It is fairly clear that if a part of your code isn’t being executed during the unit tests, then it isn’t being tested. And this is often a Bad Thing. This is where test coverage tools come it. Test coverage tools observe your code during unit tests, recording which lines have been executed (and therefore subject to at least some testing). And although the fact that a line of code is executed during unit tests offers absolutely no guarantee that it executes correctly (it is easy enough to write unit tests that exercise an entire class without testing any business logic at all!), in practice it is always preferable to minimize the amount of code that is not tested at all.
Cobertura[10] is a free, open source test coverage tool for Java. Cobertura works by instrumenting the compiled bytecode from your application, inserting code to detect and log which lines have and have not been executed during the unit tests. You run your unit tests normally, and the inserted bytecode logs the execution details. Finally, using these logs, Cobertura generates clear, readable test coverage reports in HTML. These reports provide a high-level overview of test coverage statistics across the entire project, and also let you drill down into individual packages and classes, and inspect which lines of code were and were not executed, allowing developers to correct or complete unit tests accordingly. Cobertura also measures complexity metrics such as McCabe cyclomatic code complexity.
Cobertura integrates well with both Ant and Maven. It can also be executed directly from the command line, though this is a pretty low-level stuff and should really only be done if you don’t have any other choice. At the time of this writing, no IDE plug-ins (for Eclipse, NetBeans, or any other Java IDE) were available: IDE integration is an area where Cobertura lags behind the main commercial code coverage tools such as Clover and Cobertura’s commercial cousin, JCoverage.
Running Cobertura from Ant
Cobertura integrates well with Ant: with a little configuration, you can have all the power and flexibility of the tool at your fingertips. Let’s look at how to integrate Cobertura into an Ant project.
First of all, you need to install Cobertura. Just download the
latest distribution from the Cobertura web site[*] and extract it into an appropriate directory. On my machine, I
installed Cobertura into /usr/local/tools/cobertura-1.8, and added a symbolic link called
/usr/local/tools/cobertura.
Cobertura comes bundled with an Ant task. You just need to define this task in your build.xml file as follows:
<property name="cobertura.dir" value="/usr/local/tools/cobertura" />

<path id="cobertura.classpath">
  <fileset dir="${cobertura.dir}">
    <include name="cobertura.jar" />
    <include name="lib/**/*.jar" />
  </fileset>
</path>
<taskdef classpathref="cobertura.classpath" resource="tasks.properties" />
The next step is to instrument your files. You can do this using the cobertura-instrument task:
<property name="instrumented.dir" value="${build.dir}/instrumented-classes" />
<target name="instrument" depends="compile">
  <mkdir dir="${instrumented.dir}"/>
  <delete file="${basedir}/cobertura.ser" />
  <cobertura-instrument todir="${instrumented.dir}" datafile="${basedir}/cobertura.ser">
    <fileset dir="${build.classes.dir}">
      <include name="**/*.class" />
      <exclude name="**/*Test.class" />
    </fileset>
  </cobertura-instrument>
</target>
This task is fairly simple. It is good practice to place the instrumented classes into a different directory than the normal compiled classes. In this case, we generate them in the instrumented-classes directory, using the todir option.
Cobertura stores metadata about your classes in a special file, called by default cobertura.ser. Here, we use the datafile option to avoid any confusion (we will need to refer to exactly the same metadata file when we generate the reports). This file is updated with execution details during the test runs, and used then to generate the reports. To be sure that the results are reliable, we delete this file before instrumenting the files.
The actual classes to be instrumented are specified using a standard Ant fileset. Note that, for best results with Cobertura, you should activate line-level debugging when you compile your Java classes. In Ant, you can do this by using the debug and debuglevel attributes, as shown here:
        <javac compiler="modern"
               srcdir="${java.src}"
               destdir="${java.classes}"
               includes="**/*.java"
               debug="true"
               debuglevel="lines,source">
           <classpath refid="java.classpath"/>
        </javac>
Now call this target to make sure everything works so far. You should get something like this:
$ ant instrument
...
instrument:
    [mkdir] Created dir: /home/john/dev/commons-lang-2.2-src/target/
    instrumented-classes
   [delete] Deleting: /home/john/dev/commons-lang-2.2-src/cobertura.ser
[cobertura-instrument] Cobertura 1.8 - GNU GPL License (NO WARRANTY) -
See COPYRIGHT file
[cobertura-instrument] Instrumenting 123 files to
/home/john/dev/commons-lang-2.2-src/target/instrumented-classes
[cobertura-instrument] Cobertura: Saved information on 123 classes.
[cobertura-instrument] Instrument time: 1371ms
You should now run your unit tests (almost) normally. Well, not quite. In fact, you need to modify your JUnit tasks a fair bit to get things working properly. Because Cobertura tests take considerably longer to run than normal tests, it is actually a good idea to write a separate target exclusively for coverage tests. In this example, we define a target called “test.coverage” that instruments the code, and compiles and runs the unit tests against the instrumented code:
<target name="test.coverage" depends="instrument, compile.tests">
  <junit printsummary="true" showoutput="true" fork="true"
   haltonerror="${test.failonerror}">

    <sysproperty key="net.sourceforge.cobertura.datafile"
                 file="${basedir}/cobertura.ser" />
    <classpath location="${instrumented.dir}" />
    <classpath refid="test.classpath"/>
    <classpath refid="cobertura.classpath" />
    <batchtest todir="${reports.data.dir}" >
        <fileset dir="${test.classes.dir}" includes="**/*Test.class" />
    </batchtest>
  </junit>
</target>
There are a few important things to note here. First, for technical reasons related to the way Cobertura generates its data files, the fork option in the JUnit task must be set to true. Second, you need to indicate the location of the cobertura.ser file in the net.sourceforge.cobertura.datafile system property, using the sysproperty task. Finally, you need to make sure that the classpath contains the instrumented classes (in first position) as well as the normal test classes, and also the Cobertura classes.
Running this target should produce something like the following:
$ ant test.coverage
...
test.coverage:
    [junit] Running org.apache.commons.lang.LangTestSuite

    [junit] Tests run: 635, Failures: 0, Errors: 0, Time elapsed: 4.664 sec
    [junit] Cobertura: Loaded information on 123 classes.
    [junit] Cobertura: Saved information on 123 classes.
Now we can get to the interesting stuff and generate the Cobertura report:
<property name="coveragereport.dir" value="${build.dir}/reports/cobertura" />
...
<target name="cobertura.report" depends="instrument, test">
<mkdir dir="${coveragereport.dir}"/>
<cobertura-report format="html"
destdir="${coveragereport.dir}"
srcdir="src"
datafile="${basedir}/cobertura.ser" />
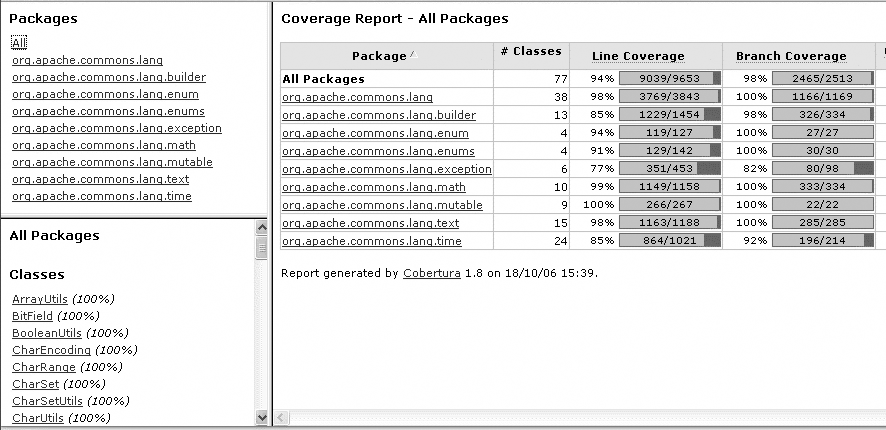
</target>This will generate a set of reports in the ${build.dir}/reports/cobertura directory, illustrated in Figure 12-1. Cobertura reports are fairly intuitive, especially if you have worked with other code coverage tools. We will look at some of the finer points of how to interpret a Cobertura report in Interpreting the Cobertura Report.
If your Cobertura reports are going to be used by another tool (such as the Hudson Continuous Integration server (see Reporting on Code Coverage), you also will need to generate your reports in XML format. You do this as follows:
<property name="coveragereport.dir" value="${build.dir}/reports/cobertura" />
...
<target  name="cobertura.report" depends="instrument, test">
  <mkdir dir="${coveragereport.dir}"/>
  <cobertura-report format="xml"
                    destdir="${coveragereport.dir}"
                    srcdir="${source.home}"
                    datafile="${basedir}/cobertura.ser" />
</target>
Checking the Code Coverage of TestNG Tests
TestNG (see Chapter 11) is an innovative and flexible annotation-based testing framework that aims at overcoming many of the limitations of JUnit. Here, we look at how to use Cobertura to measure test coverage on TestNG tests. The technique presented here was initially described by Andy Glover.[*]
Cobertura is not limited to measuring test coverage on JUnit-based tests. Indeed, it can be used to measure test coverage even if you are using other unit testing frameworks such as TestNG. Running TestNG with Cobertura is a relatively simple task. First, you need to define the Cobertura task, and instrument your classes in the normal way, using the cobertura-instrument task (see Running Cobertura from Ant). This code is listed here again for convenience:
...
<property name="cobertura.dir" value="/usr/local/tools/cobertura-1.8" />
<property name="instrumented.dir" value="${build.dir}/instrumented-classes" />

<path id="cobertura.classpath">
  <fileset dir="${cobertura.dir}">
    <include name="cobertura.jar" />
    <include name="lib/**/*.jar" />
  </fileset>
</path>

<!-- Define the Cobertura task -->
<taskdef classpathref="cobertura.classpath" resource="tasks.properties" />

<!-- Instrument classes -->
<target name="instrument" depends="compile">
  <mkdir dir="${instrumented.dir}"/>
  <delete file="${basedir}/cobertura.ser" />
  <cobertura-instrument todir="${instrumented.dir}"
   datafile="${basedir}/cobertura.ser">
    <fileset dir="${build.dir}/classes">
      <include name="**/*.class" />
      <exclude name="**/*Test.class" />
    </fileset>
  </cobertura-instrument>
</target>
Next, instead of running your tests using the JUnit task, you need to use the TestNG task instead. There are two things to remember here. First, you need to provide a <classpath> containing the instrumented classes, the test classes, and the Cobertura libraries. Second, you need to specify a <sysproperty> element that provides the path of the Cobertura data file (cobertura.ser). A typical example, which runs all the TestNG classes in the project, is shown here:
<target name="test.coverage" depends="instrument, compiletests">
    <testng outputDir="${test.reports}" verbose="2">
        <classpath>
             <pathelement location="${instrumented.dir}" />
             <pathelement location="${test.classes}" />
             <path refid="cobertura.classpath"/>
        </classpath>
        <sysproperty key="net.sourceforge.cobertura.datafile"
         file="${basedir}/cobertura.ser" />
        <classfileset dir="${test.classes}" includes="**/*.class" />
    </testng>
</target>
Of course, you can also use any of the other options in the TestNG Ant task (see Using TestNG in Ant), such as running specific test groups or running a test suite using a TestNG configuration file.
Finally, the Cobertura report generation is unchanged:
<property name="coveragereport.dir" value="${build.dir}/reports/cobertura" />
...
<target  name="cobertura.report" depends="test.coverage">
  <mkdir dir="${coveragereport.dir}"/>
  <cobertura-report format="html"
                    destdir="${coveragereport.dir}"
                    srcdir="${source.home}"
                    datafile="${basedir}/cobertura.ser" />
</target>
Interpreting the Cobertura Report
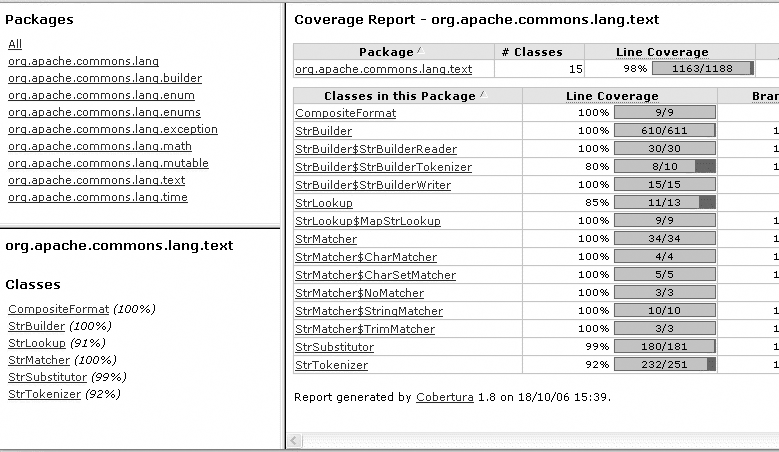
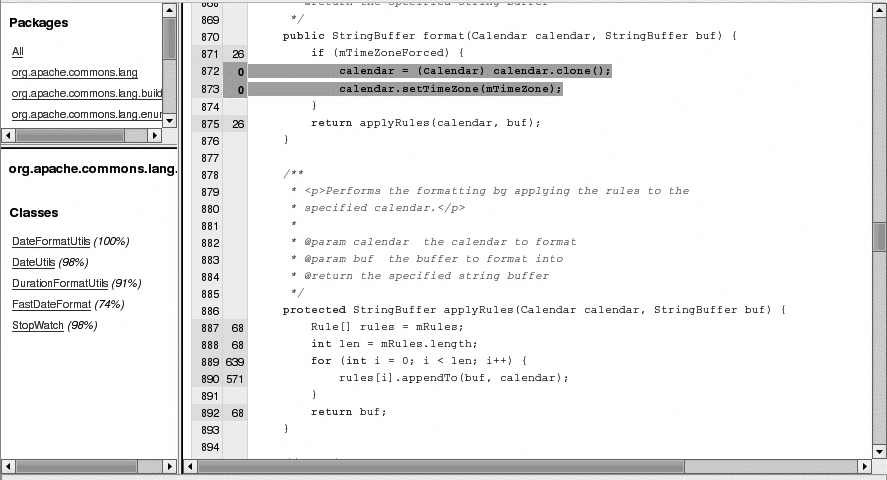
Interpreting a Cobertura report is a fine art. Well, actually it’s not: in fact it’s quite simple. As far as coverage reports go, Cobertura reports are quite clear and intuitive. A typical Cobertura report is illustrated in Figure 12-1. The report is generated in HTML, so you can drill down into individual packages (see Figure 12-2) and classes (see Figure 12-3), or just look at a high-level overview showing coverage across the whole project (see Figure 12-1).
The theory of code coverage can be a bit pedantic, and many of the more subtle details are really only of any interest to the authors of code coverage tools. However, the main coverage metrics are fairly simple, and can help in interpreting a code coverage report.
As we have seen, Cobertura covers line and branch coverage, and McCabe class complexity.
Line coverage represents the significant number of lines of code that have been executed. This is pretty straightforward: if a line of code hasn’t been executed during your unit tests then it hasn’t been tested. So, it is in everyone’s interest to make sure your unit tests exercise as many lines as possible.
Branch coverage is a bit more fancy. Let’s look at an example. In
the following code, we call the processExpensivePurchaseOrder() method if the cost is greater or
equal to
10,000:
public void processOrder(String productCode, int cost) {
  PurchaceOrder order = null;
  if (cost > 10000) {
    order = processExpensivePurchaseOrder(productCode, cost);
  }
  ...
  order.doSomething();
}
If
your unit tests fail to cover this case, Line coverage will pick up the fact
that doSomething() is never executed.
That’s fine. However, for a cost value of less than 10,000, processExpensivePurchaseOrder() will not be
executed, which appears to be normal. However, if the order variable is never
assigned elsewhere, the code will crash with a
NullPointerException in the last line of the
method.
Branch coverage will detect this case. It works by looking at conditional expressions and checking whether both possible outcomes of the condition were tested.
Branch coverage is a useful thing to have, and Cobertura gives a good indication of how many of the branches in your code are executed by your unit tests. The only problem is that Cobertura cannot actually tell you which branches are not correctly tested. (Admittedly, this is a tricky problem: none of the other code coverage tools that I know of can do this either).
McCabe cyclomatic complexity is not a measure of code coverage but a metric you can also measure with static code analysis tools such as Checkstyle (see Chapter 21) and PMD (see Chapter 22).
You measure the complexity of a method by counting the number of decision points (ifs, loops, case statements, and so on) it contains. The more decision points, the more the code is considered to be complex and difficult to understand and maintain. The McCabe cyclomatic complexity metric counts the number of distinct paths through the method, so you just take the number of decision points plus one. If there are no decision points at all, there is just one path through the code. (Each decision point adds an additional path.)
McCabe cyclomatic complexity is actually quite a good way of finding overly complex classes and methods. Long and complex sections of code tend to be fragile, hard to maintain, and prone to bugs. If a method is getting too long or too complex, it’s probably a good candidate for refactoring. For Java code, most writers consider a value of 1–4 to indicate low, 5–7 moderate complexity, 8–10 highly complex, and over 10 excessively complex.
Cobertura gives only a general indication of the average complexity of a package or class. This is useful for a project manager or team leader, who can flag suspicious code for review and refactoring. However, to be really useful, you need to apply this metric directly to each method, which can be done using Checkstyle (see Customizing Checkstyle: Common Rules That You Can Do Without, and Some That You Could Use) or PMD (see Writing Your Own PMD Ruleset).
One coverage metric is not currently handled by Cobertura. Method Coverage is available in some of the commercial code coverage products. Method Coverage is a high-level indicator of how many methods were called during the unit test executions.
At the class level (see Figure 12-3), Cobertura lets you see the line coverage for each individual line. In the margin, Cobertura displays which lines of code were and were not tested, and the number of times each line of code was executed. This lets you identify code that hasn’t been tested and add new tests to check the untested code, or remove bits of redundant or unnecessary code.
Not all code can be feasibly tested. For example, you may have code that catches exceptions that will never be thrown, or implement methods in an interface that are never used. This is why 100 percent code coverage is not always possible. There’s no need to be dogmatic about obtaining 100 percent coverage for each and every class: just remember, code coverage is a tool to improve the quality of your code, not an end in itself.
Enforcing High Code Coverage
There are two approaches you can adopt when you test code coverage with a tool like Cobertura. You can simply use Cobertura as a reporting tool to investigate areas where tests might be improved or code could be refactored. Users can read the coverage reports, and are free to take any corrective action they deem necessary. In this situation, Cobertura acts like a sort of advisory body. You can actively enforce high code coverage by building checks into your build process so that the build will fail if test coverage is insufficient. In this case, Cobertura takes a more legislative role.
These approaches can be used together: for example, you can run test coverage reports on a daily basis to help developers improve their tests in a development environment, and enforce minimum test coverage levels on the test or integration build environments.
Cobertura comes with the cobertura-check task, an Ant task that lets you enforce coverage levels. You insert this task just after you run your instrumented unit tests to ensure that a certain level of test coverage has been achieved, as shown here:
<target name="test.coverage" depends="instrument, compile.tests">
  <junit printsummary="true" showoutput="true" fork="true"
   haltonerror="${test.failonerror}">

    <sysproperty key="net.sourceforge.cobertura.datafile"
                 file="${basedir}/cobertura.ser" />
    <classpath location="${instrumented.dir}" />
    <classpath refid="test.classpath"/>
    <classpath refid="cobertura.classpath" />
    <test name="org.apache.commons.lang.LangTestSuite"/>
    </junit>
   <cobertura-check linerate="90" branchrate="90" totalbranchrate="90"
     totallinerate="90"/>
    </target>
You can define the required line and branch rates for each individual class (using the linerate and branchrate attributes), for each package (packagelinerate and packagebranchrate), or across the whole project (totallinerate and totalbranchrate). You can also define different levels of required coverage for specific packages, as shown here:
<cobertura-check linerate="80" branchrate="80" totalbranchrate="90"
totallinerate="90">
    <regex pattern="com.acme.myproject.highriskcode.*" branchrate="95"
     linerate="95"/>
</cobertura-check>
Now, if you run this task with insufficient test coverage, the build will fail:
$ ant test.coverage
...
[cobertura-check] org.apache.commons.lang.time.FastDateFormat failed check.
Branch coverage rate of 76.0% is below 90.0%
[cobertura-check] org.apache.commons.lang.NotImplementedException failed check.
Branch coverage rate of 83.3% is below 90.0%
[cobertura-check] org.apache.commons.lang.time.FastDateFormat$TimeZoneNameRule
failed check. Branch coverage rate of 83.3% is below 90.0%
[cobertura-check] org.apache.commons.lang.time.FastDateFormat$Pair
failed check. Branch coverage rate of 25.0% is below 90.0%
[cobertura-check] Project failed check. Total line coverage rate of 88.7%
is below 90.0%

BUILD FAILED
/home/john/dev/commons-lang-2.2-src/build.xml:228: Coverage check failed.
See messages above.
Systematically enforcing high code coverage in this way is debated in some circles. Developers may not appreciate build failures as a result of insufficient code coverage, on what they consider to be “work in progress,” which is fair enough. However, it is a fact that tests should be written around the same time as the code being tested: they are easier to write and the tests are higher quality and generally more relevant. One good way to encourage regular, high quality testing is to integrate this type of check on the continuous integration server (see Chapters 5, 6, and 7), to ensure that code committed has been sufficiently tested.
It is worth pointing out that high test coverage does not assure correct testing (see the excellent article by Andrew Glover on this subject[*]). In fact, there is more to unit tests than just executing the lines of code. As Andrew Glover points out, test coverage is most useful to flag code that hasn’t been tested, and it does do a very good job of this. And, in practice, Murphy’s Law ensures that untested code will always contain more bugs than tested code!
Generating Cobertura Reports in Maven
Cobertura can also be used with Maven as well as Ant. The Mojo project[†] provides a Maven plug-in for Cobertura that lets you test code coverage, generate coverage reports, and enforce coverage levels. These functionalities are very similar to the Ant (see Running Cobertura from Ant), although arguably (at the time of this writing, at least) less mature and less stable.
First, you need to set up the cobertura-maven-plug-in plug-in in the
<build> section of your POM file.
You can do this as
follows:
<project>
   ...
   <build>
       ...
       <plugins>
       ...
          <plugin>
            <groupId>org.codehaus.mojo</groupId>
            <artifactId>cobertura-maven-plugin</artifactId>
            <version>2.2</version>[*]
          </plugin>
    ...
  </plugins>
  ...
 </build>
 ...
</project>
The plug-in comes with a few useful configuration options. In the following example, we increase the maximum memory allocated to the Cobertura task to 128M and indicate that all abstract classes and unit test classes should be excluded from the coverage calculations (otherwise, to have full test coverage, we would need to test the unit tests themselves as well):
<project>
   ...
   <build>
       ...
       <plugins>
       ...
          <plugin>
            <groupId>org.codehaus.mojo</groupId>
            <artifactId>cobertura-maven-plugin</artifactId>
            <version>2.2</version>
            <configuration>
              <maxmem>128m</maxmem>
              <instrumentation>
                <excludes>
                    <exclude>**/*Test.class</exclude>
                    <exclude>**/Abstract*.class</exclude>
                </excludes>
              </instrumentation>
            </configuration>
          </plugin>
    ...
  </plugins>
  ...
 </build>
 ...
</project>
You can run Cobertura by calling the cobertura:cobertura goal:
$mvn cobertura:cobertura
This will instrument your project’s files, run the unit tests on the instrumented code, and generate a coverage report in the target/site/cobertura directory.
This is nice for testing your configuration. In practice, however, you will need to integrate Cobertura more closely into your Maven build process. You can use Cobertura in two ways: simply to report on test coverage levels, or to actively enforce minimum required test coverage levels by refusing to build a product without sufficient test coverage (see Enforcing High Code Coverage for more discussion on these two approaches). In a Maven project, you can integrate Cobertura reports into the standard Maven site reports by simply listing the cobertura-maven-plugin in the <reporting> section of your POM file, as shown here:
<project...>
  ...
  <reporting>
    <plugins>
      <plugin>
        <groupId>org.codehaus.mojo</groupId>
        <artifactId>cobertura-maven-plugin</artifactId>
        <version>2.2</version>
      </plugin>
    </plugins>
  </reporting>
</project>
Now, whenever the Maven site is generated using the site:site goal, Maven will also run code coverage tests and generate a coverage report, which will be neatly integrated into the Maven site:
$mvn site:site
Integrating Coverage Tests into the Maven Build Process
In some projects, you may want to enforce code coverage rules in a more proactive way than by simply reporting coverage details. In Maven, you can also enforce coverage levels using the <check> configuration element, which goes in the <configuration> section of your plug-in definition. Like the corresponding Ant task (see Enforcing High Code Coverage), the <check> element lets you define the minimum acceptable coverage levels for lines and branches, for each individual class (using the <linerate> and <branchrate> elements), for each package (using the <packagelinerate> and <packagebranchrate> elements), or for the whole project (using the <totallinerate> and <totalbranchrate> elements):
<project>
 ...
 <build>
  ...
  <plugins>
   ...
   <plugin>
      <groupId>org.codehaus.mojo</groupId>
      <artifactId>cobertura-maven-plugin</artifactId>
      <version>2.0</version>
      <configuration>
         <check>
            <branchRate>80</branchRate>
            <lineRate>70</lineRate>
            <totalBranchRate>70</totalBranchRate>
            <totalLineRate>60</totalLineRate>
          </check>
      </configuration>
      <executions>
        <execution>
          <goals>
            <goal>clean</goal>
            <goal>check</goal>
          </goals>
        </execution>
      </executions>
    </plugin>
    ...
  </plugins>
  ...
 </build>
 ...
</project>
You can run this test manually by running mvn cobertura:check:
$mvn cobertura:check
...
[INFO] [cobertura:check]
[INFO] Cobertura 1.7 - GNU GPL License (NO WARRANTY) - See COPYRIGHT file
Cobertura: Loaded information on 5 classes.

[ERROR] com.wakaleo.jpt.examples.library.domain.Library failed check.
Line coverage rate of 0.0% is below 70.0%
com.wakaleo.jpt.examples.library.App failed check. Line coverage rate of 0.0%
is below 70.0%
Project failed check. Total line coverage rate of 47.6% is below 60.0%

[INFO] ------------------------------------------------------------------------
[ERROR] BUILD ERROR
[INFO] ------------------------------------------------------------------------
[INFO] Coverage check failed. See messages above.
[INFO] ------------------------------------------------------------------------
[INFO] For more information, run Maven with the -e switch
[INFO] ------------------------------------------------------------------------
[INFO] Total time: 5 seconds
[INFO] Finished at: Tue Oct 24 00:38:05 NZDT 2006
[INFO] Final Memory: 5M/10M
[INFO] ------------------------------------------------------------------------
This is fine for testing purposes, but it is poorly integrated into the overall build process. This configuration will not stop a build from proceeding if you run mvn package, for example, no matter how poor your test coverage is! The check needs to be bound to a particular part of the Maven build lifecycle, such as the package lifecycle phase, which takes place just after the test phase, or the verify lifecycle phase, which is invoked just before the application is bundled up into its final form and installed into the local repository. To do this, just add another <execution> section to the plug-in definition, containing the target phase and the Cobertura goals you want to call (in our case, clean and check):
   <plugin>
      <groupId>org.codehaus.mojo</groupId>
      <artifactId>cobertura-maven-plugin</artifactId>
      <configuration>
         <check>
            <branchRate>80</branchRate>
            <lineRate>70</lineRate>
            <totalBranchRate>70</totalBranchRate>
            <totalLineRate>60</totalLineRate>
          </check>
      </configuration>
      <executions>
        <execution>
          <goals>
            <goal>clean</goal>
            <goal>check</goal>
          </goals>
        </execution>
        <execution>
            <id>coverage-tests</id>
            <phase>verify</phase>
            <goals>
                <goal>clean</goal>
                <goal>check</goal>
            </goals>
        </execution>
      </executions>
    </plugin>
Now, whenever you try to build and install the application, Cobertura will be called to verify test coverage levels. If they are insufficient, the build will fail. You can check that this works by running mvn install:
$mvn install
...
[INFO] [cobertura:check]
[INFO] Cobertura 1.7 - GNU GPL License (NO WARRANTY) - See COPYRIGHT file
Cobertura: Loaded information on 5 classes.

[ERROR] com.wakaleo.jpt.examples.library.domain.Library failed check.
Line coverage rate of 0.0% is below 70.0%
com.wakaleo.jpt.examples.library.App failed check. Line coverage rate of 0.0%
is below 70.0%
Project failed check. Total line coverage rate of 47.6% is below 60.0%

[INFO] ------------------------------------------------------------------------
[ERROR] BUILD ERROR
[INFO] ------------------------------------------------------------------------
[INFO] Coverage check failed. See messages above.
[INFO] ------------------------------------------------------------------------
[INFO] For more information, run Maven with the -e switch
[INFO] ------------------------------------------------------------------------
[INFO] Total time: 5 seconds
[INFO] Finished at: Tue Oct 24 00:38:05 NZDT 2006
[INFO] Final Memory: 5M/10M
[INFO] ------------------------------------------------------------------------
Code Coverage in Eclipse
Another popular open source code coverage tool is Emma.[*] This tool has been around for a while and provides good quality coverage metrics including measures of class, method, and block and line coverage. Although it comes with an Ant plug-in, Emma provides no support for Maven 2, and space constraints prevent us from looking at it in any detail here.
One thing we will look at, however, is a nice test coverage plug-in for Eclipse that is based on Emma. This plug-in, called EclEmma,[11] lets you visualize test coverage measurements for your unit tests directly from within Eclipse.
The easiest way to install EclEmma is to use the update site. Select “Software Updates→Find and Install” in the help menu, and add a new remote update site. Set the URL to http://update.eclemma.org, and install the plug-ins from this site in the usual way. The installation is straightforward.
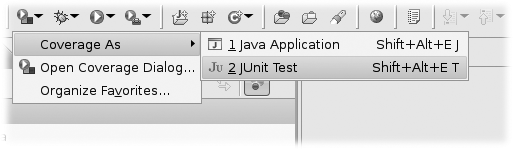
Once the plug-in is installed, you will be able to run your application in coverage mode. A new Coverage icon should appear alongside the other Run and Debug icons (see Figure 12-4). From here, you can run your unit tests with test coverage metrics activated. You can also use the contextual menu, by selecting “Coverage As” rather than “Run As” when you execute your unit tests.
You can run JUnit tests, TestNG tests, or even Java applications this way. EclEmma will automatically instrument your class files and keep track of coverage statistics while your code executes.
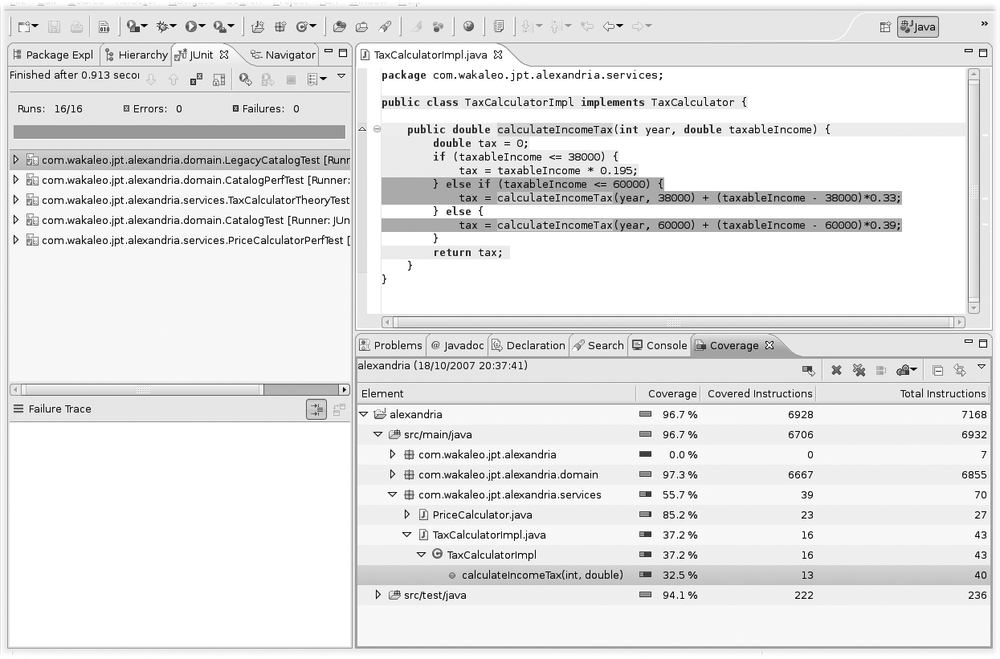
When you run your unit tests in the test coverage mode, EclEmma will automatically instrument your classes and record coverage statistics, which it will display in the “Coverage” view (see Figure 12-5). This view gives you a coverage graph with an overview of the coverage statistics for the code you just executed. You can drill down to package, class, and method level, and display a particular class in the source code editor. Executed code is displayed in green, partially executed lines are displayed in yellow, and unexecuted code is displayed in red.
By default, the view displays instruction-level coverage, but it also records other types of coverage statistics. You can use the view menu to display coverage statistics in terms of blocks (which corresponds to branches in Cobertura terminology), lines, methods, or types.
Another possibility is to use the test coverage tool integrated into the Eclipse TPTP toolset (see Displaying Coverage Statistics). This tool is a little less refined than EclEmma.
Conclusion
Code coverage doesn’t guarantee high-quality code, but it can certainly help. In practice, code coverage tools such as Cobertura can make a valuable contribution to code quality. By isolating poorly tested classes and pointing out untested lines of code, Cobertura can greatly contribute to finding and fixing deficits.
It is also worth noting that its main commercial rival, Clover, recently acquired by Atlassian, is also an excellent product. Clover is used by many open source products, as Atlassian offers free licences for open source projects. Some of the principal extra features that Clover provides are method coverage statistics, more varied reporting formats (including PDF), and very good IDE integration.
Nevertheless, if you are looking for a high-quality, open source, and free code coverage tool, Cobertura should be sufficient for many projects, and it is certainly better than using no tool at all. And, if you want to visualize test coverage statistics in Eclipse, you can use EclEmma or, alternatively, the coverage tool in the EclipseTPTP toolset.
[*] “In pursuit of code quality: Don’t be fooled by the coverage report,” IBM Developer Works, January 31, 2006 (http://www-128.ibm.com/developerworks/java/library/j-cq01316/index.html)
[*] At the time of this writing, you need to manually specify version 2.0 or 2.2 of the Maven Cobertura plug-in, as the most recent version does not work correctly.