
Chapter 26. Monitoring Build Statistics
Introduction
There are many open source reporting tools available that can give you useful information about your project. Checkstyle, PMD, and FindBugs analyze the project source code, looking for code that fails to respect coding conventions or contains errors. Cobertura reports on test coverage, giving you an idea of how well your code has been tested.
All of these tools can provide detailed information about one particular aspect of your project at a particular point in time. However, it can also be useful to see how these statistics evolve over the lifetime of a project. Does the average code coverage increase or decrease? How does the number of errors detected by PMD and FindBugs evolve over time. How much code has been added to the project over the last month? For this type of query, a snapshot analysis of your project will not be enough—you need to study the data over time.
There are many tools that can help you in this area. QALab collects data from these tools and reports on the evolution of these statistics over time. For example, you can visualize the evolution of code quality and test coverage statistics over the life of the project. In this chapter, we will look at some tools that you can use to collect and display this sort of time-related statistical data.
QALab
QALab collects data from tools such as static analysis results and code coverage, and reports on the evolution of these statistics over time. For example, you can visualize the evolution of code quality and test coverage statistics over the life of the project.
QALab works by extracting key information from the reports generated by the other tools, and storing this data in a single file called qalab.xml. Because QALab deals with statistical trends and not individual violations, only summary-level information is recorded. For QALab to work effectively, you need to generate data for QALab on a regular basis—such as during nightly builds or during the Continuous Build process.
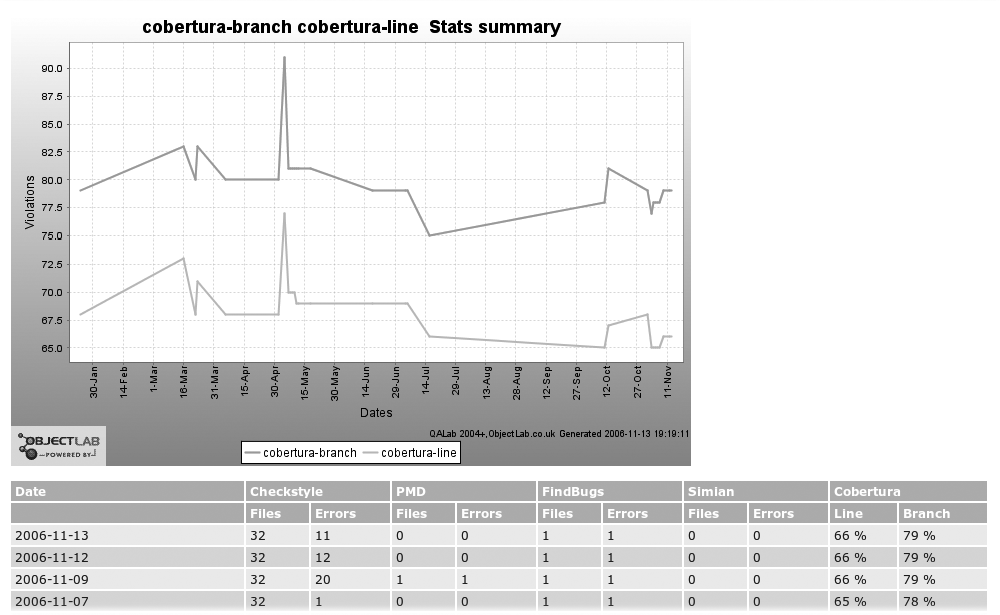
QALab generates two types of reports: Charts and Movers. The charts track the evolution of data since the start of the project (or since QALab was installed). You can see an example of a QALab chart in Figure 26-1. The movers allow you to see at a glance what has changed since the last QALab reports where generated. For example, rather than displaying Checkstyle results since the start of the project, movers focus on how many more (or less) violations there were today compared to yesterday.
The chart graph is quite powerful in a number of ways. If you click the graph, you will obtain a list of all the current files. Clicking any one of these files will display a graph containing the historical data just for this file. QALab integrates well with Ant and Maven.
Using QALab in Ant
Before you can use QALab in Ant, you need to download the latest QALab jar and the Maven QALab plug-in jar[23] —as well as its dependencies (jcommon, jfreechart, xerces, and xercesImpl). The dependencies are not provided in the QALab download, so you have to hunt them down yourself. The JCommon and JFreeChart libraries are available at the JFreeChart site (http://www.jfree.org/jfreechart/). If you have a lot of development machines to install, it may be easier to define a separate Ant build file (called, for example, bootstrap-qalab.xml) containing a bootstrap task that downloads and installs the appropriate files, as shown here:
<project name="QALAB Bootstrap script" default="bootstrap" basedir="." >

  <!-- Define the environment-specific variable "qalab.home" in this file. -->
  <property file="${user.home}/ant-global.properties"/>
  <!-- This default value is used if no properties file is present -->
  <property name="qalab.home" value="${user.home}/.qalab"/>

  <property name="maven.repository"
            value="http://repo1.maven.org/maven2" />
  <property name="sourceforge.mirror"
            value="http://optusnet.dl.sourceforge.net/sourceforge" />

  <available file="${qalab.home}/lib/qalab-1.0.jar" property="qalab.installed"/>

  <target name="bootstrap" unless="qalab.installed">
    <echo>Installing QALib</echo>
    <mkdir dir="${qalab.home}/lib" />
    <!-- QALab -->
    <get src="${sourceforge.mirror}/qalab/qalab-1.0.jar"
         dest="${qalab.home}/lib/qalab-1.0.jar" usetimestamp="true"/>
    <get src="${sourceforge.mirror}/qalab/mvn-qalab-plugin-2.2.jar"
         dest="${qalab.home}/lib/mvn-qalab-plugin-2.2.jar" usetimestamp="true"/>
    <!-- Xerces -->
    <get src="${maven.repository}/xerces/xerces/2.4.0/xerces-2.4.0.jar"
         dest="${qalab.home}/lib/xerces-2.4.0.jar" usetimestamp="true"/>
    <!-- XercesImpl -->
    <get src="${maven.repository}/xerces/xercesImpl/2.6.2/xercesImpl-2.6.2.jar"
         dest="${qalab.home}/lib/xercesImpl-2.6.2.jar" usetimestamp="true"/>
    <!-- Freechart and JCommon -->
    <get src="${sourceforge.mirror}/jfreechart/jfreechart-1.0.5.zip"
         dest="${qalab.home}/lib/jfreechart-1.0.5.zip" usetimestamp="true"/>
    <unzip src="${qalab.home}/lib/jfreechart-1.0.5.zip"
          dest="${qalab.home}/lib"/>
  </target>

</project>
This will download and install the QALib library and its dependencies if (and only if) they have not already been locally installed. Then you can simply call this script at the start of your main Ant build file and define a classpath containing all of the QALab jars and dependencies:
    <ant antfile="bootstrap-qalab.xml" target="bootstrap"/>

    <path id="qalab.classpath">
        <fileset dir="${qalab.home}/lib">
          <include name="**/*.jar"/>
        </fileset>
    </path>
Once the QALab files are installed, we can start to configure our Ant build file. As we have seen, QALab collects and aggregates quality-related data from a number of different data sources, and produces graphs tracking the evolution of this data over the life of a project. When you use QALab in Ant, you need to set up and configure each of these phases. This involves:
Generating the statistical data from each tool in an appropriate form, as an XML document.
Analyzing and aggregating this data into a consolidated QALab XML document.
Generating one or more graphs using this consolidated data.
In this section, we will look at how to perform each of these activities.
As we mentioned previously, QALab is capable of handling data from a number of sources: Checkstyle (Chapter 21), PMD (Chapter 22), FindBugs (Chapter 23), Simian, or Cobertura (Chapter 20). Configuring QALab in Ant involves setting up each of these tools to produce the XML data that QALab needs to work with. All of these tools allow you to generate results in XML form, although the details vary for each tool. In Checkstyle, you do something like this:
<target name="checkstyle">
    <checkstyle config="config/company-checks.xml">
        <fileset dir="src/main/java" includes="**/*.java"/>
        <formatter type="xml" tofile="${build.dir}/reports/checkstyle-report.xml"/>
    </checkstyle>
</target>
In PMD, you use the XML formatter, as shown here:
<pmd rulesetfiles="basic,javabeans,junit,controversial" targetJdk="1.5"
failonerror="true">
       <formatter type="xml" toFile="${build.dir}/reports/pmd-
        report.xml"/>
       <fileset dir="${src}">
           <include name="**/*.java"/>
       </fileset>
</pmd>
In FindBugs, you use the output parameter to set the format to XML:
<findbugs home="${findbugs.home}" output="xml" outputFile="reports/
 findbugs-report.xml" >
  ...
</findbugs>
And,
in Cobertura, you use the <cobertura-report> tag with the format attribute set to “xml.” This will
generate a file called cobertura.xml in
the reports
directory:
<cobertura-report format="xml"
                  destdir="${build.dir}/reports"
                  srcdir="${java.src}"
                  datafile="${basedir}/cobertura.ser" />
Once you are sure that your data is being generated (at least) in XML form, you need to tell QALab to integrate data from each file into the main QALab data file. To do this, you need to define and use the QALab <mergestat> task. The Ant type definition should look something like this:
<taskdef name="mergestat"
         classname="net.objectlab.qalab.ant.BuildStatMergeTask"
         classpathref="qalab.classpath" />
You
need a <mergestat> task for each
type of data that you want to integrate. QALab knows how to read the XML
files generated by all of the above tools. There is a special handler class
for each tool, which you specify in the handler attribute (net.objectlab.qalab.parser.CheckstyleStatMerge, PMDStatMerge, FindBugsStatMerge, and so on).
The form of each <mergestat> task is similar: you need to provide the generated XML data (using the inputFile attribute) and indicate where you want to store the QALab data file. Note that this file, typically called qalab.xml, is designed to remain in use throughout the project’s lifespan, so it should be stored somewhere where it won’t be erased whenever you do a clean build.
Here is a typical example of the <mergestat> task:
<mergestat inputFile="${build.dir}/checkstyle-report.xml"
           outputFile="${basedir}/qalab.xml"
           srcDir="${java.src}"
           handler="net.objectlab.qalab.parser.CheckstyleStatMerge" />
And here is a full example using output from all of the above tools. Because we are integrating data from several sources, we use the mergerTimeStamp attribute to ensure that all the data processed here is recorded with the same date and time. Recording the date and time (as opposed to just the date) allows you to record statistics several times a day, which is useful if you are running QALab during regular or Continuous Integration builds. If you don’t use this attribute, the date (without the time) will be used:
    <tstamp>
        <format property="TIMESTAMP" pattern="yyyy-MM-dd HH:mm:ss"/>
    </tstamp>

    <target name="qalab" depends="checkstyle, pmd, findbugs, cobertura.report" >

        <!-- Checkstyle -->
        <mergestat inputFile="${build.dir}/checkstyle-report.xml"
                   outputFile="${basedir}/qalab.xml"
                   srcDir="${java.src}"
                   handler="net.objectlab.qalab.parser.CheckstyleStatMerge"
                   mergerTimeStamp="${TIMESTAMP}"/>
        <!-- PMD -->
        <mergestat inputFile="${build.dir}/pmd-report.xml"
                   outputFile="${basedir}/qalab.xml"
                   srcDir="${java.src}"
                   handler="net.objectlab.qalab.parser.PMDStatMerge"
                   mergerTimeStamp="${TIMESTAMP}"/>
        <!-- FindBugs -->
        <mergestat inputFile="${build.dir}/findbugs-report.xml"
                   outputFile="${basedir}/qalab.xml"
                   srcDir="${java.src}"
                   handler="net.objectlab.qalab.parser.FindBugsStatMerge"
                   mergerTimeStamp="${TIMESTAMP}"/>
        <!-- Cobertura -->
        <mergestat inputFile="${build.dir}/reports/coverage.xml"
                   outputFile="${basedir}/qalab.xml"
                   srcDir="${java.src}"
                   handler="net.objectlab.qalab.parser.CoberturaLineStatMerge"
                   mergerTimeStamp="${TIMESTAMP}"/>

        <mergestat inputFile="${build.dir}/reports/coverage.xml"
                   outputFile="${basedir}/qalab.xml"
                   srcDir="${java.src}"
                   handler="net.objectlab.qalab.parser.CoberturaBranchStatMerge"
                   mergerTimeStamp="${TIMESTAMP}"/>

    </target>
Once you can generate the qalab.xml file on a regular basis you are ready to build some charts. You generate charts using the <buildchart> task, which you need to define as follows:
<taskdef name="buildchart"
         classname="net.objectlab.qalab.ant.BuildStatChartTask"
         classpathref="qalab.classpath" />
You can use this task to generate a set of charts as follows:
<buildchart inputFile="${basedir}/qalab.xml"
toDir="${build.dir}/reports/charts/static-analysis"
movingAverage="10"
width="500" height="333"
summaryOnly="false"
summaryType="checkstyle,pmd,findbugs"
type="checkstyle,pmd,findbugs"
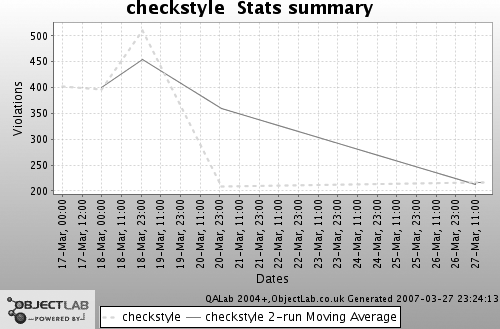
quiet="true"/>This will generate a nice set of charts in JPG form and place them in the directory that you specified with the toDir attribute (see Figure 26-2). Other than this one, the most important attributes here are summaryType and type, which indicate what data should appear on the summary chart and on the main chart, respectively. You can put multiple values here: the graphs will contain a different colored line for each data type.
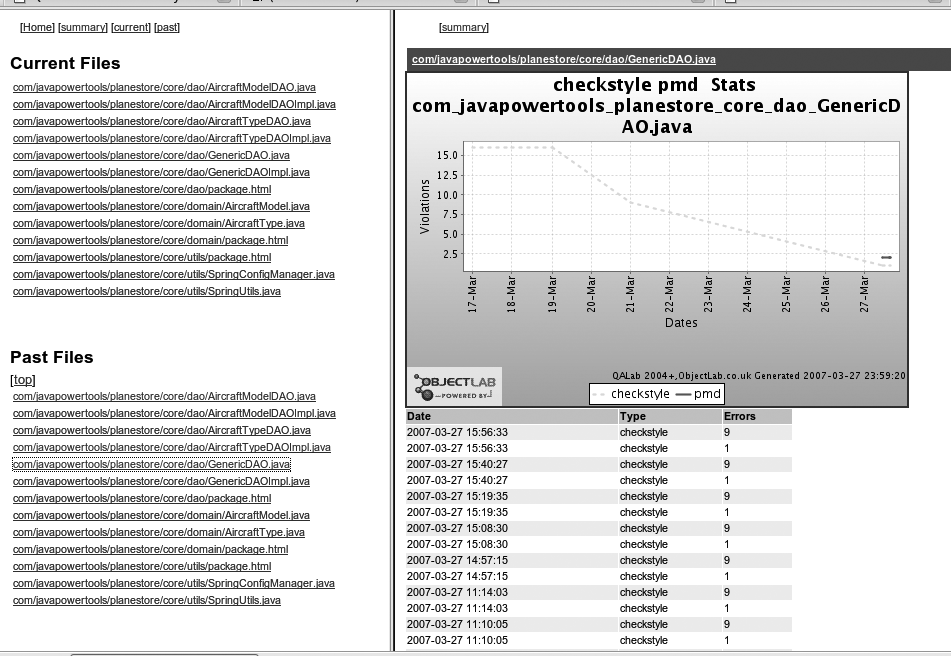
Although this is certainly a useful function, it is probably not quite what you need for your project reporting. The Maven QALab plug-in comes with an XSL stylesheet that you can use to generate reasonable-looking HTML reports in which you can drill down to a class level (see Figure 26-3). You can do this as shown in the following example:
    <tstamp>
      <format property="TIME" pattern="yyyy-MM-dd" offset="-48" unit="hour"/>
    </tstamp>
    <xslt in="${basedir}/qalab.xml"
          out="${build.dir}/reports/charts/static-analysis/hist.html"
          style="qalab-chart-html.xsl"
          classpathref="qalab.classpath">
      <param name="targetdir" expression="${build.dir}/reports/charts/static-
       analysis"/>
      <param name="type" expression="checkstyle,findbugs,pmd"/>
      <param name="offset" expression="${TIME}"/>
    </xslt>
Note that you have to extract the XSL stylesheet manually and put it somewhere accessible. Another alternative, if you are using Ant 1.7, is to use a nested <style> element and to specify the stylesheet as a <javaresource> on the classpath.
Using QALab in Maven
Using QALab in Maven is much simpler than in Ant. The XML data files are automatically detected, and most of the configuration parameters have sensible default values. So, at its simplest, you just add the QALab report to your Maven reports, as shown here:
    <reporting>
      <plugins>
         ...
         <plugin>
            <groupId>net.objectlab</groupId>
            <artifactId>mvn-qalab-plugin</artifactId>
            <version>2.2</version>
            <reportSets>
               <reportSet>
                  <reports>
                     <report>report-merge-chart</report>
                     <report>report-movers-all</report>
                  </reports>
               </reportSet>
            </reportSets>
         </plugin>
         ..
      </plugins>
    </reporting>
Each time you generate the Maven web site, QALab will analyze your project
data and update the qalab.xml file
accordingly, and include historical reports like the one in Figure 26-1. QALab can find and incorporate XML data from
Checkstyle (Chapter 21), PMD (Chapter 22), FindBugs
(Chapter 23), or Cobertura (Chapter 20).
Because not all of these tools generate XML data by default, a little extra configuration is needed for some of them. The FindBugs report plug-in will generate XML data if you set the xmlOutput configuration variable to true:
        <plugin>
           <groupId>org.codehaus.mojo</groupId>
           <artifactId>findbugs-maven-plugin</artifactId>
           <version>1.0.0</version>
           <configuration>
             <threshold>Normal</threshold>
             <xmlOutput>true</xmlOutput>
           </configuration>
        </plugin>
The Cobertura report plug-in generates HTML reports by default. You can use the format configuration variable to force Cobertura to generate the XML data that QALab needs as follows:
        <plugin>
            <groupId>org.codehaus.mojo</groupId>
            <artifactId>cobertura-maven-plugin</artifactId>
            <configuration>
              <formats>
                  <format>html</format>
                  <format>xml</format>
              </formats>
            </configuration>
        </plugin>
Both the Checkstyle and PMD report plug-ins generates XML data by default, so no extra configuration is needed here.
Source Code Management Metrics with StatSCM
It is often useful (or merely satisfying) to know how much code has been added to a project over a certain period of time. In Maven 2, the StatSCM plug-in lets you do just that. Written by Doug Culnane, StatSCM is a wrapper on top of two other tools—StatCVS and StatSVN—which we will look at further on.
StatSCM is capable of generating an abundance of statistical information about your project, including:
How fast the source code base has been growing
Who is actively working on this project
How much code each developer has been contributing, and how active they have been
What release tags have been made
Which files are being modified the most often
StatSVN also provides a graphical view of your repository structure.
StatSCM is easy to set up and to use. First, make sure the <scm> section (see A Human-Readable Project Description” in Declarative Builds and the Maven Project Object Model) of your POM file is correct. StatSCM uses this information to find the source code repository and study the logfiles. For Subversion, it also counts the number of lines of code in each changeset, which can take quite a while for a big repository.
StatSCM is not in the standard Maven repository, so you need to add the following plug-in repositories to your POM file:
   <pluginRepositories>
      <pluginRepository>
          <id>stat-scm-sourceforge</id>
          <url>http://stat-scm.sourceforge.net/maven2</url>
      </pluginRepository>
      <pluginRepository>
          <id>stat-scm-sourceforge-snapshot</id>
          <url>http://stat-scm.sourceforge.net/maven2-snapshots</url>
      </pluginRepository>
   </pluginRepositories>
Then add the stat-scm report to your list of reports:
<reporting>
<plugins>
...
<plugin>
<groupId>net.sf</groupId>
<artifactId>stat-scm</artifactId>
</plugin>
...
</plugins>
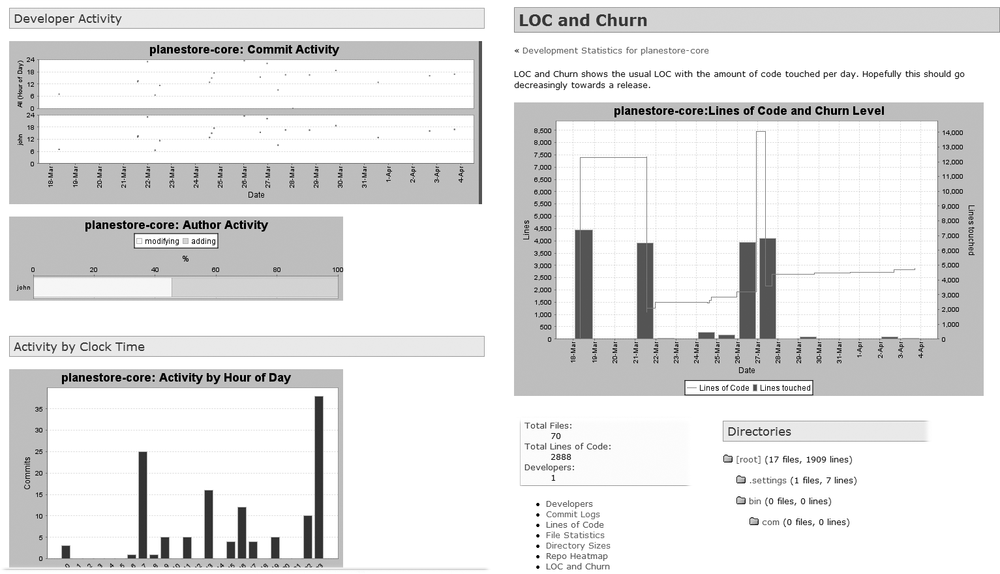
</reporting> Now, when you generate your Maven site, you will be able to browse through a very complete set of interactive reports containing statistical data about the evolution and activity of your project, from the point of view of its source code repository, during the life of the project (see Figure 26-4).
Statistics in Ant with StatSVN
The current version of StatSCM provides Maven 2 users with powerful statistical reporting functionalities about Subversion or CVS repository activity. If you are using Ant (see Chapter 1) and Subversion (see Chapter 4), you can obtain these detailed statistics by using the underlying StatSVN tool directly. StatSVN is a powerful tool designed to be run either directly from the command line, or using the built-in Ant Task. Here, we will concentrate on how to use StatSVN from within Ant.
Installing StatSVN
StatSVN is distributed as a simple JAR file. To install it, simply
download the latest version from the StatSVN web site[*] and save this JAR file in an appropriate place on your disk.
This JAR file also contains the StatSVN Ant task that we will be using. You
can either copy the JAR file into your Ant lib directory, or, alternatively, refer to the JAR in your
<taskdef> declaration, as shown
here:
  <taskdef name="statsvn"
           classname="net.sf.statsvn.ant.StatSvnTask"
           classpath="${statsvn.home}/statsvn.jar" />
Extracting the Subversion Logfiles
Although StatSVN is powerful, it is also fairly low level and involves working directly with your Subversion logfiles, which you must extract yourself. StatSVN works with the Subversion log messages in XML form. From the command line, you would need to execute the svn log command, as shown here:
$ svn log -v --xml http://svnserver.mycompany.com/svn/repos/myproject/trunk
In an ideal world, you would be able to use the SvnAnt library (see Using Subversion in Ant) to do this. However, at the time of this writing, the svn log command was not supported in SvnAnt, so you need to use the Ant <exec> task to invoke the svn command at the OS level. From within Ant, you could define a target called “svn.log” to do this:
  <property name="svnUrl" value="http://svnserver.mycompany.com/svn/repos
  /myproject/trunk/" />

  <target name="svn.log">
      <exec executable="svn" output="${basedir}/target/svn.log">
          <arg value="log"/>
          <arg value="-v"/>
          <arg value="--xml"/>
          <arg value="${svnUrl}"/>
      </exec>
   </target>
This
will extract the Subversion log messages in XML form and place them into the
svn.logfile, which StatSVN can then
use to generate its reports.
Generating the StatSVN Reports
You can generate StatSVN reports either directly from the command line or by using the StatSVN Ant task. An example of how to use the <statsvn> task is shown here:
  <target name="statsvn" depends="${basedir}/target/svn.log">
    <mkdir dir="${basedir}/target/statsvn"/>
    <statsvn
        path="P:projectsjava-power-toolssrc"
        log="${basedir}/svn.log"
        outputDir="${basedir}/target/statsvn/stats"
        title="Java Power Tools" />
  </target>
The path attribute refers to the root directory of the project being analyzed. This task will generate a very complete web site of statistical data and reports in the directory specified by the output attribute.