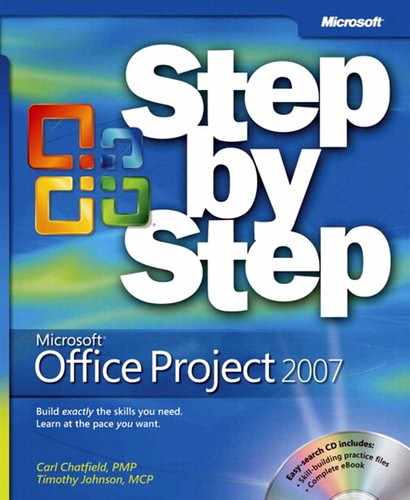
Chapter 12. Sharing Project Information with Other Programs
In this chapter, you will learn how to: | |
✓ | Copy and paste data to and from Project. |
✓ | Use Project to open a file produced in another program. |
✓ | Save Project data to other file formats using import/export maps. |
✓ | Generate a new Office document that contains essential project details and an illustration. |
✓ | Generate new Excel and Visio documents using the Visual Reports feature. |
Tip
Do you need only a quick refresher on the topics in this chapter? See the Quick Reference entries in Sharing Project Information with Other Programs.
In this chapter, you focus on various ways of getting data into and out of Microsoft Office Project 2007. In addition to the standard Windows copy and paste features with which you might be familiar, Project offers a variety of options for importing and exporting data.
Throughout this chapter, you’ll see the following terms:
The source program is the program from which you copy information.
The destination program is the program to which you paste information.
Tip
This tip describes enterprise project management (EPM) functionality. This chapter describes various ways of sharing information between Project and other applications, usually to communicate project details to stakeholders. Project Professional, when used with Project Server, offers more sophisticated ways of communicating with resources and other stakeholders online. To learn more about the enterprise collaboration tools available with Project Server, see Part 4.
Important
Before you can use the practice files provided for this chapter, you need to install them from the book’s companion CD to their default locations. See "Using the Book’s CD" for more information.
Copying and Pasting with Project
You can copy and paste data to and from Project by clicking the Copy Cell, Paste, and Paste Special commands on the Edit menu and the Copy Picture command on the Report menu (or the corresponding buttons on the Standard toolbar). When copying data from Project, you can choose one of two options, depending on the results you want:
You can copy text (such as task names and dates) from a table and paste it as text into a destination program, such as Microsoft Office Word.
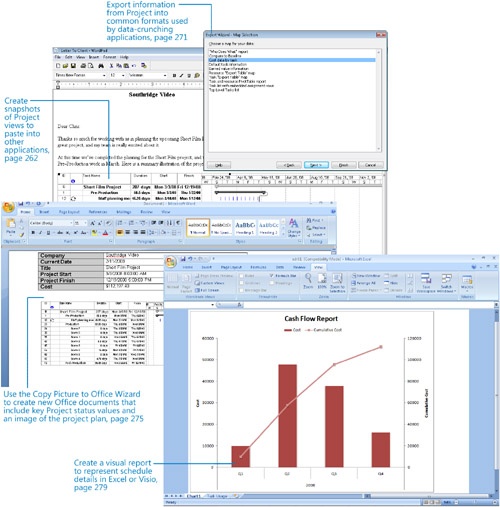
You can copy a graphic image of a view from Project and paste it as a graphic image in the destination program. With the Copy Picture command on the Report menu, you can create a graphic image of a view or a selected portion of a view. Use the Copy Picture feature to optimize the image for onscreen viewing (in PowerPoint, for example) or for printing (in Word, for example).
Tip
The Copy Picture feature also includes an option to save the snapshot to a GIF image file. You can then include the GIF image in a Word document or e-mail message, or post it directly to an intranet site.
There is an important distinction between using Copy Cell and Copy Picture. If you use Copy Cell, you can edit the data in the destination program. However, Copy Picture yields an image that you can edit only with a graphics editing program.
Tip
Many Windows programs, such as Word and Excel, have a Paste Special feature. This feature provides you with more options for pasting data from Project into the destination program. For example, you can use the Paste Special feature in Word to paste formatted or unformatted text, a picture, or a Project Document Object (an OLE object). You can also choose to paste only the data or paste it with a link to the source data in Project. For more information about using OLE with Project, type Embed an object into Project into the Search box in the upper right corner of the Project window. The Search box initially contains the text Type a question for help.
You also have two options when pasting data into Project from other programs:
You can paste text (such as a list of task or resource names) into a table in Project. For example, you can paste a range of cells from Excel or a sequence of paragraphs from Word into Project. You might paste a series of task names that are organized in a vertical column from Excel or Word into the Task Name column in Project, for instance.
You can paste a graphic image or an OLE object from another program into a graphical portion of a Gantt Chart view. You can also paste a graphic image or an OLE object into a task, resource, or assignment note; into a form view, such as the Task or Resource Form views; or into the header, footer, or legend of a view or report.
Important
Pasting text as multiple columns into Project requires some planning. First, make sure that the order of the information in the source program matches the order of the columns in the Project table. You can either rearrange the data in the source program to match the column order in the Project table or vice versa. Second, make sure that the columns in the source program support the same types of data—text, numbers, dates, and so on—as do the columns in Project.
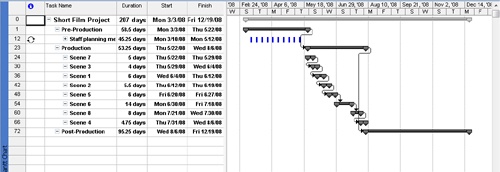
For the short film project, you’d like to add a Gantt chart image to a document you’ve prepared for a stakeholder of the project. In this exercise, you copy a snapshot of a Gantt chart and paste it into Microsoft WordPad (or Word, if you prefer). You copy information in the same way regardless of the destination program you have in mind. For example, you could paste the snapshot into a word processor file or an e-mail message. To begin, you’ll format the Gantt Chart view to show the information you want.
In this exercise, you copy an image of a Gantt Chart view to the Windows Clipboard and then paste it into another document.
Important
If you are running Project Professional, you may need to make a one-time adjustment to use the Computer account and to work offline. This ensures that the practice files you work with in this chapter do not affect your Project Server data. For more information, see "Starting Project Professional“.
Note
OPEN Short Film Project 12a from the DocumentsMicrosoft PressProject 2007 SBSChapter 12 Sharing folder. You can also access the practice files for this book by clicking Start, All Programs, Microsoft Press, Project 2007 Step by Step, and then selecting the chapter folder of the file you want to open.
On the File menu, click Save As.
The Save As dialog box appears.
In the File name box, type Short Film Project 12, and then click Save.
On the Project menu, point to Filtered For: All Tasks, and then click Summary Tasks.
Project displays only the summary tasks in the project.
On the View menu, click Zoom.
The Zoom dialog box appears.
In the Zoom dialog box, click Entire project, and then click OK.
Project adjusts the timescale of the Gantt chart to show the entire project.
On the Report menu, click Copy Picture.
The Copy Picture dialog box appears.
Under the Render image label, make sure that For screen is selected.
Click OK.
Project copies a snapshot of the Gantt Chart view to the Clipboard.
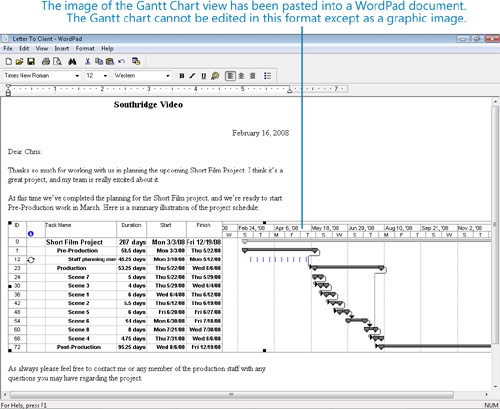
Next, you’ll open a proposal document that’s been created in a word processor. You can open this in WordPad (as illustrated here) or in Word if you have it.
Do one of the following:
If you do not have Word installed, click the Windows Start button, point to All Programs, click Accessories, and then click WordPad.
If you have Word installed, start it.
Do one of the following:
In WordPad or Word 2003 or earlier, on the File menu, click Open.
In Word 2007, click the Microsoft Office button, and then click Open.
Locate and open the document named Letter To Client in your Chapter 12 Sharing folder (you may have to select All Files in the Files of type box).
Once the document has opened, select the paragraph (insert Gantt Chart picture here).
Project pastes the snapshot of the Gantt Chart view from the Clipboard to the document.
Again, note that rather than pasting the image into a Word or WordPad document, you could paste this image into an e-mail message or another type of document.
Do one of the following:
On the WordPad or Word 2003 or earlier File menu, click Exit.
In Word 2007, click the Microsoft Office button, and then click Exit Word.
When prompted to save the document, click No or Don’t Save.

Opening Other File Formats in Project
Information that you need to incorporate into a Project document can come from a variety of sources. A task list from a spreadsheet or resource costs from a database are two examples. You might want to use the unique features of Project to analyze data from another program. For example, many people keep task lists and simple project schedules in Excel, but accounting for basic scheduling issues, such as working and nonworking time, is impractical in Excel.
When saving data to or opening data from other formats, Project uses maps (also called import/export maps or data maps) that specify the exact data to import or export and how to structure it. You use import/export maps to specify how you want individual fields in the source program’s file to correspond to individual fields in the destination program’s file. After you set up an import/export map, you can use it over and over again.
Tip
If you have Excel installed on your computer, open the workbook named Sample Task List in the Chapter 12 Sharing folder. The important things to note about the workbook are the names and order of the columns, the presence of a header row (the labels at the top of the columns), and that the data is in a worksheet named Tasks. When you’re done viewing the workbook, close it without saving changes.
In this exercise, a colleague has sent you an Excel workbook that contains her recommended tasks, durations, and sequence of activities for some work that Southridge Video will do in the future. You open the Excel workbook in Project and set up an import/export map to control how the Excel data is imported into Project.
Important
Project has a security setting that may prevent you from
opening legacy or non-default file formats. Before you complete this
section, you may need to change this setting. On the
Tools menu, click Options. Click the
Security tab, and under Legacy Formats, click
Prompt When Loading Files With Legacy Or Non
Default File Format.
In Project, on the File menu, click Open. The Open dialog box appears.
Locate the Chapter 12 Sharing folder in the Project 2007 Step by Step folder on your hard disk.
In the Files of type box, select Microsoft Excel Workbooks.
Tip
While scrolling through the Files Of Type box, you can see the several file formats that Project can import. If you work with programs that can save data in any of these file formats, you can import their data into Project. For more information, type File formats supported by Project into the Search box, located in the upper right corner of the Project window.
Select the Sample Task List file, and then click Open.
The Import Wizard appears. This wizard helps you import structured data from a different format to Project.
Click the Next button.
The second page of the Import Wizard appears.
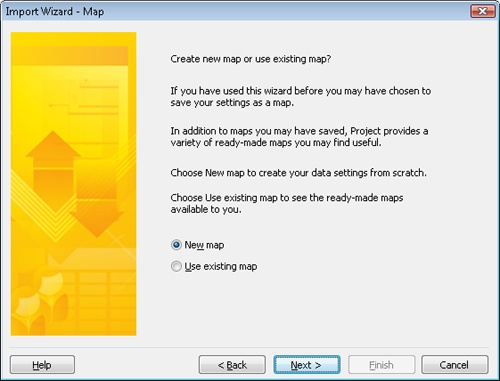
The Import Wizard uses maps to organize the way that structured data from another file format is imported into Project. For this exercise, you will create a new map.
Make sure that New map is selected, and then click Next.
The Import Mode page of the Import Wizard appears.
Make sure that As a new project is selected, and then click Next.
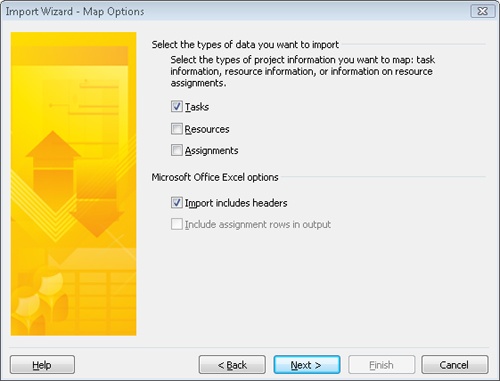
The Map Options page of the Import Wizard appears.
Select the Tasks check box, and make sure that Import includes headers is selected as well.
Headers here refer to column headings.
Click Next.
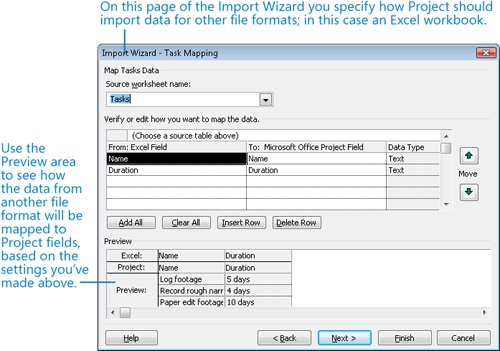
The Task Mapping page of the Import Wizard appears. Here you identify the source worksheet within the Excel workbook and specify how you want to map the data from the source worksheet to Project fields.
On the Source worksheet name list, select Tasks.
Project analyzes the header row names from the worksheet and suggests the Project field names that are probable matches.
Click Next.
The final page of the Import Wizard appears. Here you have the option of saving the settings for the new import map, which is useful when you anticipate importing similar data into Project in the future. This time, you’ll skip this step.
Click the Finish button.
Project imports the Excel data into a new Project plan. (The dates you see on the timescale will differ from those shown because Project uses the current date as the project start date in the new file.)
This task list will become a more fully developed schedule that you’ll use in a later chapter.
Close the new file without saving changes.


Tip
If you find that others need to give you task lists for creating a plan in Project and you must reorganize or clean up the lists you receive, try using the Microsoft Project Task List Import Template. Project installs this Excel template. In Excel 2003, this template appears on the Spreadsheet Solutions tab of the Templates dialog box. In Excel 2007, this template appears in the Installed Templates list of the New Workbook dialog box. The Excel template is set up with the proper field headings and column order to make importing a clean task list in Project easy.
For more complex importing, see the Microsoft Project Plan Import Export Template (also an Excel template). This template contains not only task but also resource and assignment field headings and column orders for importing more complex information into Project.
Saving to Other File Formats from Project
Pasting Project data into other programs might be fine for one-time or infrequent needs, but this technique might not work as well if you must export a large volume of data from Project. Instead, you can save Project data in different file formats, which can be accomplished in various ways, including:
You can save the entire project as Extensible Markup Language (XML) format for structured data exchange with other applications that support it. Unlike earlier versions of Project, Project 2007 does not support exporting to database formats, such as MDB or MPD, nor to the old Microsoft Project Exchange format, MPX (although Project 2007 can open these formats). The XML format is now your best option for exchanging structured data with other programs that support XML.
You can save only the data you specify in a different format. The supported formats include Excel workbook, Excel PivotTable, and tab-delimited or comma-delimited text. When saving to these formats, you choose the format in which you want to save, pick a built-in export map (or create your own), and export the data.
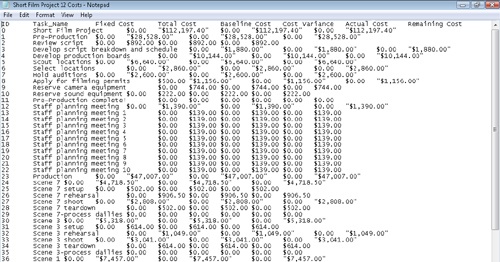
Although the short film project has not yet started, the project file already contains quite a bit of planned cost data. You’d like to give this data to the financial planner of Southridge Video so she can start work on detailed budgets. However, the financial planner uses a budget program that cannot work directly with Project files. You decide to provide her with cost data as tab-delimited text, which will allow her the greatest flexibility when importing the data into her budget program.
In this exercise, you save project cost data to a text file using a built-in export map. At this point, you should still have Short Film Project 12 open in Project.
Important
Project has a security setting that may prevent you from opening legacy or non-default file formats. Before you complete this section, you may need to change this setting. On the Tools menu, click Options. Click the Security tab, and under Legacy Formats, click Prompt When Loading Files With Legacy Or Non Default File Format.
On the File menu, click Save As.
The Save As dialog box appears. Project suggests saving the file in the same location from which you opened the practice file. If you see anything different in the Save As dialog box, locate the Chapter 12 Sharing folder.
In the File name box, type Short Film Project 12 Costs.
In the Save as type box, click Text (Tab delimited) from the list, and then click Save.
The Export Wizard appears.
Click Next.
The second page of the Export Wizard appears.
Click Use existing map, and then click Next.
Under Choose a map for your data, select Cost data by task.
Click Finish.
Project saves the text file. To view it, you will open the file in Microsoft Notepad.
On the Windows Start menu, point to All Programs, click Accessories, and click Notepad.
Notepad starts.
In Notepad, make sure that Word Wrap is turned off. (On the Format menu, Word Wrap should not be selected.)
On the File menu, click Open.
Open the document Short Film Project 12 Costs in your Chapter 12 Sharing folder.
In this file, the fields are separated by tabs. It might not be easy for you to read, but this format is easily imported into virtually any data-crunching program.
On the File menu, click Exit. Notepad closes, and you return to Project.

Generating a Project Summary Report for Word, PowerPoint, or Visio
Although the Copy Picture feature is useful for moving an image of the active view to the Windows Clipboard or to a GIF file, Project makes it easy to go one step further and generate a complete document in Word, PowerPoint, or Visio. Project provides this capability with the Copy Picture To Office Wizard, which steps you through the process of specifying the exact data you want included in the new Office document and how you want it displayed. This wizard works with most views in Project, but not with the Calendar view, Relationship Diagram view, or form views.
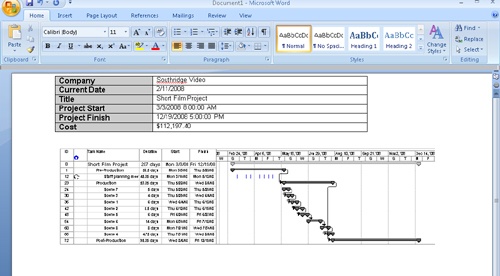
The Copy Picture To Office Wizard generates a new Office document that contains a table of field values that apply to your entire project (such as the project finish date) as well as a GIF image of the current Project view. This wizard gives you the option of generating a new document in any of the three most common Office formats for project status reporting: PowerPoint, Word, and Visio.
In this exercise, you use the Copy Picture To Office Wizard to create a Word document with a GIF image of a Gantt chart.
Important
If the computer on which you are now working does not have PowerPoint, Word, or Visio 2000 or later installed, you cannot complete this procedure of using the Copy Picture To Office Wizard. If this is the case, proceed to the next section.
On the View menu, point to Toolbars, and click Analysis.
The Analysis toolbar appears.
On the Analysis toolbar, click the Copy Picture to Office Wizard button.
The Information page of the wizard appears.
Click Next.
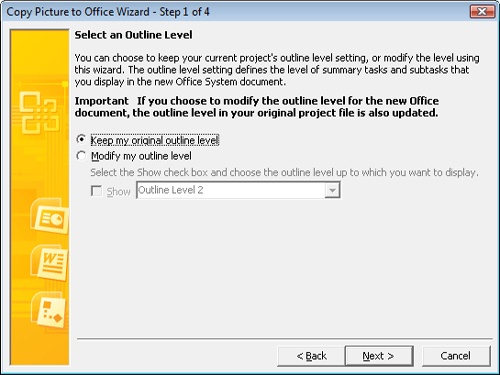
Step 1 of the wizard appears. Here you control the outline level of the task list.
Make sure that Keep my original outline level is selected.
Click Next.
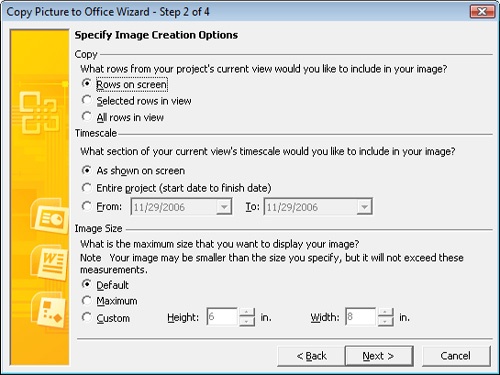
Step 2 of the wizard appears. Here you specify exactly what you want copied and at what size.
Under Copy, make sure that Rows on screen is selected; under Timescale, make sure that As shown on screen is selected; under Image Size, make sure that Default is selected.
Click Next.
Step 3 of the wizard appears. Here you specify the Office application for which you want a new document created.
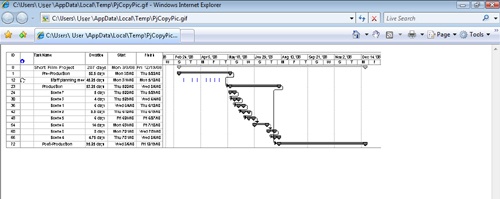
Before you choose an application, however, you’ll preview the GIF image in your browser.
Click Preview.
Project displays the GIF image of your view in your browser.
Close your browser and return to step 3 of the wizard in Project.
Under Application, click Word.
Under Orientation, make sure that Landscape is selected.
Click Next.
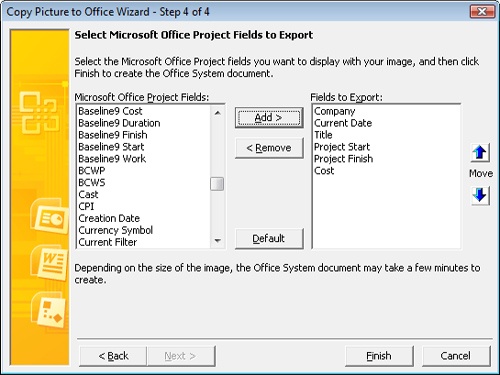
Step 4 of the wizard appears. Here you review and, if you wish, modify the project-level fields to be included in the new document. These fields will appear in a table above the GIF image.
In the Microsoft Office Project Fields box, select Cost, and then click the Add button.
The Cost field name appears at the bottom of the fields list in the Fields To Export box.
Click Finish.
Project displays a confirmation message that it completed the new document creation.
Click Close.
The wizard starts Word, if it is not already running, and creates the new document.
If Word is minimized, click the Word icon on the taskbar and, if necessary, switch to the new document in Word.
The project-level fields appear in a table above the GIF image of the Gantt Chart view. For your real-world reporting needs, you could use such a document as a starting point for a recurring project status report or a one-time project write-up.
Close the document in Word without saving changes, and switch back to Project.
In Project, on the View menu, point to Toolbars and then click Analysis.
Project hides the Analysis toolbar.
Generating Visual Reports with Excel and Visio
Project 2007 includes a major new feature, visual reports, that focuses on sharing schedule details with other applications. Specifically, you can use the visual reports feature to export data from Project to either Excel or Visio and, once there, visually represent schedule details in compelling formats.
A visual report can include task, resource, or assignment details. When you select a visual report in Project, it generates a highly structured database, called an OLAP cube, from your project plan. Project then launches another Office application (either Excel or Visio, depending on the visual report you selected), loads and organizes the data used by that application, and generates a graphical representation of that data (an Excel chart or Visio diagram). The specific results you obtain depend on the type of visual report you choose:
Excel visual reports utilize the PivotTable and PivotChart features in Excel. You can format the chart and modify the details in the PivotTable report from which the chart is derived. PivotTable reports are well suited to analyzing and summarizing the large volumes of data Project plans can contain. You can create Excel visual reports with Excel 2003 or later.
Visio visual reports use a new feature introduced in Visio 2007 called PivotDiagrams. PivotDiagrams are well suited for presenting hierarchical data and can complement Project very well. Not only can you customize the visual report as a Visio diagram, but you can also filter and rearrange the data from which the diagram is derived. Visio visual reports require Visio 2007 or later.
Project includes several Excel and Visio visual report templates. You can also create your own visual reports from scratch or modify one of the supplied templates. If you are already familiar with Excel PivotTables, and/or are a Visio power user, and have the need to analyze and present Project data, you’ll find visual reports of interest. However, if you’re not as experienced with Excel PivotTables or Visio diagrams, you can still take a look at the visual report feature so that you have some exposure to this powerful new feature of Project 2007.
In this exercise, you generate both Excel and Visio visual reports.
Important
If the computer on which you are now working does not have Excel 2003 or later or Visio 2007 or later installed, you cannot complete this exercise. If this is the case, skip ahead to the "Key Points" section.
On the Report menu, click Visual Reports.
The Visual Reports dialog box appears.
This dialog box groups visual reports in a number of ways: all reports; only Excel or Visio reports; and task, resource, or assignment details (divided into summary and usage reports). The dialog box includes a simplified preview of the type of graphic (chart or diagram) associated with each visual report. If desired, you can click the various tabs in the dialog box to see how the visual reports are organized.
The first visual report you’ll generate is Excel based.
Click the Task Usage tab.
Click Cash Flow Report and then click View.
Project generates the data required by this report, launches Excel, and creates the Cash Flow chart. You may need to adjust the zoom level to view the entire chart.
The PivotTable on which the chart is based is on the Task Usage sheet. If you are familiar with PivotTables, you can view that sheet and modify the PivotTable settings if you wish.
When you are through working with the Excel chart, close Excel without saving changes.
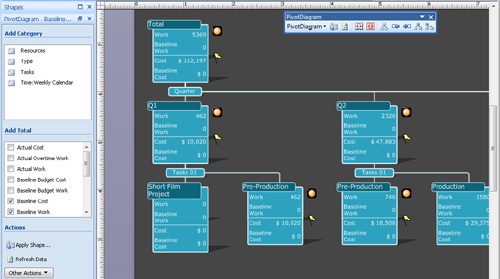
To conclude this exercise, you will generate a Visio-based visual report.
Important
If the computer on which you are now working does not have Visio 2007 or later installed, you cannot complete this exercise. If this is the case, skip to step 11 to conclude this exercise.
In Project, the Visual Reports dialog box should still be displayed.
Click the Assignment Usage tab.
Click Baseline Report (US), and then click View.
Project generates the data required by this report, launches Visio, and creates the Baseline Report diagram.
Next, you’ll take a closer look at the items in this diagram.
In Visio, on the View menu, point to Zoom, and then click 100%.
If necessary, adjust the vertical and horizontal scroll bars until you can see the diagram details.
At this point, you could adjust the settings in the PivotDiagram pane in Visio to change the details included in the diagram.
When you are through working with the Visio diagram, close it without saving changes.
In Project, click Close to close the Visual Reports dialog box.


Key Points
When sharing Project data with other Office applications, two useful techniques include copying images of the active view and generating a new Office document that includes key Project details and an image of the active view.
You can both copy from and paste into Project just as you can with other Windows applications. However, when pasting data into a table in Project, take care to ensure that the data you want ends up in the correct fields.
To help import Excel data into Project, Project installs two Excel templates that are properly structured for importing into Project.
When opening other data formats in Project, Project uses import maps to help organize the imported data into the right structure for a Project table.
Project supports saving data to common structured data formats, such as XML.
Visual reports help you export Project data to nicely formatted Excel charts and Visio diagrams.