
Chapter 7
Dual Frequency Millimeter Feed1
7.1. Introduction
The antenna presented in this chapter is a corrugated horn which should be installed onboard a satellite. It is a non-standard antenna due to its performance. As with many satellite antennas, the requirements are very stringent. In addition, in this case, the antenna should work out of its nominal frequency band. The design uses original and non-standard solutions in order to overcome this difficulty. The different roles of the horn sections and their relative contributions to the feed parameters and performances are presented. The optimization process obtaining the final design detailed. Comparison between simulations results and measurements are presented.
7.2. Overview
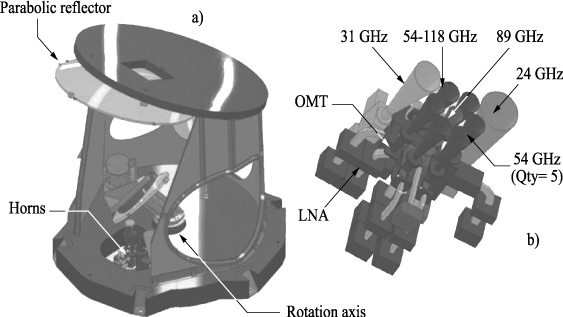
The antenna to be designed is part of a radiometer onboard a satellite. This equipment is dedicated to be used for climatological purposes. Many frequency bands are included in order to get some information on the temperature, clouds, rain, etc. The different capabilities of the equipment will not be discussed here, the main object of this chapter being the design of an antenna operating at two frequency bands around 54 and 118 GHz. This antenna must analyze the same far-field region in the atmosphere. To do this it is quite natural to use the same radiating aperture. The requirement was consequently the design of a dual band millimeter antenna. As shown in Figure 7.1, the equipment is composed of several other feeds located in the vicinity of the focus of a parabolic reflector. There is consequently a blocking problem. Using the same primary feed is then a space saving solution.
Figure 7.1. Global view of the equipment (left view) and zoom on the primary feeds located at the parabolic reflector focus (right view)
7.3. Technology and first design
Considering that the reflection coefficients on any scatterer – atmosphere, ground or any structure – depend on the polarization, the radiometers antennas must have a low cross-polarization. The most commonly used antennas are corrugated horns. Figure 7.2 shows the horn’s different sections. The hybrid HE11 mode generated by such a horn has a very good polarization purity. To enable such a mode to propagate, the corrugations must be one quarter of a wavelength (λ/4) deep. This is the classical design of a corrugated horn. However, if the corrugations’ depth is increased by a multiple of half wavelengths, the surface impedance would be the same and the functioning would be identical. We could consequently use instead, corrugations of 3λ/4 depth and have a design operating at two frequencies: 3λ/4 depth for the highest frequency band and λ/4 depth for the lowest frequency band. The ratio between the two frequency bands is 3. In this study, the desired ratio is 118 / 54 = 2.2. The requirements will be met if the two frequency bands are large enough. According to the literature [GRA 05], the highest frequency band is narrower. The design has been centered on this frequency band. The corrugation depth is 3λ/4 at 118 GHz which is 1.9 mm. This depth is λ/4 at 40 GHz which is not too far from 54 GHz, the center frequency of the lowest frequency band.
Figure 7.2. Corrugated horn profile. Such a horn propagates the hybrid HE11 mode. The field lines at the aperture are parallel (right view). A mode convertor is required to change from TE11 mode (left view) to HE11 mode
The mode convertor shown in Figure 7.2 is one essential part of the corrugated horn. The conversion of TE11 mode into HE11 cannot be immediate. In order to avoid a significant reflection at the transition between the two sections, a progressive transition is required. One half wavelength corrugation is equivalent to a smooth waveguide. The transition is consequently realized decreasing the corrugation depth from λ/2 to λ/4. This is a classical way to proceed. In addition, we can notice that another λ/2 can be added to the corrugation depth without any change in behavior. The first corrugation will correspond in that case to a smooth waveguide at two frequencies. Its depth will be λ at the highest frequency and λ/2 at the lowest frequency. The ratio between the two frequencies will be 2, which is close to the ratio of the two desired operating frequencies of the antenna to be realized.
Numerical simulations were performed to check the previous assumptions. IEROS (IEEA) software, based on a solution of integral equations for bodies with symmetry of revolution was used [BER 89]. Parameters of interest were the reflection coefficient (VSWR) and the antenna radiation pattern. To qualify the antenna radiation pattern, we looked for this first analysis, at the cross-polarization level in the 45± meridian plane. A few trials were performed to get the results shown in Figure 7.3. Note that the corrugations located inside the transition between the waveguide and the horn, have different depth and width. This is the way often used to get a large bandwidth [BEN 05]. Doing this we have a progressive matching. Figure 7.3 shows that the high frequency band is large and the margin is small. Unfortunately, this mode convertor could not be manufactured, due to the fact that the first corrugation was too thin and deep. Modifying it, taking the manufacturing constraints into account, leads to degraded performances. However, this new design is a good starting point for the optimization process.
Figure 7.3. Horn profile (a) and performances (b) of the corrugated horn obtained after several trials. The low frequency band is 49.5 GHz – 55.5 GHz. The high frequency band is 109 GHz – 128 GHz
7.4. Optimization and final design
The horn presented in Figure 7.3 is used to initialize the optimization calculation. The objective is to get low values of the return loss and of the crosspolarization level for the two bandwidths. These two parameters are considered in a cost function to be minimized. A few trials were necessary to find the proper weight coefficients to be applied to each parameter for each frequency value. The variables of the optimization process are the corrugations’ geometrical parameters. There are four per corrugation: the distance to the axis, depth, tooth and groove widths. To minimize the number of parameters to be considered, only those corresponding to the mode convertor were allowed to vary. This is the most important part in the design. All other corrugations are set identically. After a number of trials, we found a convertor composed of 9 corrugations. The final number of parameters is then 36 for the mode convertor and 4 for the horn, i.e. a whole number of 40. The manufacturing constraints are included in the optimization process as boundaries to the values that each parameter can be given. The algorithm is a conjugate gradient. This was the preferred choice, as compared to genetic algorithms, due to the fact that the initial guess already provided good performances. The final geometry is shown in Figure 7.4. Due to the high number of variables and the successive trials that were done, the overall design process took several weeks on a standard PC.
Figure 7.4. Horn profile (a) and performances (b) of the corrugated horn obtained after the optimization process
7.5. The whole antenna: horn + reflector
At this stage, the corrugated horn was considered independently of its environment. As shown in Figure 7.1, this horn is used to illuminate a parabolic reflector. One of the requirements of the horn + reflector set up is to have a high efficiency. The most important part of the energy radiated by the horn must hit the reflector. This is possible with a high directive horn, i.e. a horn with a large aperture. This requirement was ignored in the previous design steps in order to save some CPU time. It was expected that the return loss and the cross-polarization were mostly dependent on the mode convertor and the corrugations dimensions inside the horn. The complete horn, with extended length, is presented in Figure 7.5. The first part is identical to the horn which was designed. The second part is obtained just reproducing the last corrugation until the right aperture is obtained. The performances obtained show that the short horn design was a good starting point. The return loss and cross polarization of the short horn are greater than the ones obtained with the long horn design. It should be noticed however that the cross-polarization of the long horn is greater than the cross-polarization obtained with the short horn at some frequency values, but the levels remain acceptable.
Figure 7.5. Horn profile (a) and performances (b) of the corrugated horn obtained after the optimization process and extended to reach the required aperture. The results obtained with the horn short version are plotted for comparison
In addition, as mentioned previously, the whole set up (horn + parabolic reflector) must analyze the same far-field region using the two frequency bands. This requirement is quantified by an overlapping criterion defined as follows. We consider the −3 dB main lobe in a spherical coordinates system. This defines a surface in the far-field. This is done for the two frequencies: 54 GHz and 118 GHz. The intersection of the two surfaces gives a third surface. The ratio of this third surface to the largest of the first two surfaces gives a number which is our overlapping criterion. The result obtained when the horn is located at the parabolic reflector focus is shown in Figure 7.6 (left). In that case, the overlap is nearly perfect, which is expected.
In fact, the horn has a high directivity and the illuminated part of the reflector is smaller than the reflector surface in order to get a high efficiency. As a consequence, the antenna beam width does not depend on the reflector diameter but on the illuminated part diameter. The relationship of the −3 dB half power beam width (HPBW) to the diameter is of the order of HPBW = 70± λ/d (see [ORF 04]). In addition, the reflector illuminated part diameter is given by the horn far-field pattern beam width. This angle is calculated using the same formula. As a result, the beam width of the whole antenna setup does not depend on the frequency. Although this calculation is based on approximations, it enables an understanding of why we get such a good result in that case.
Figure 7.6. Far-field pattern of the whole antenna (horn + reflector). The surfaces correspond to the −3 dB main lobe in spherical coordinates θ and φ (named theta x and theta y).The solid line is the result of the centre of the low frequency band and the dashed line is the result of the centre of the high frequency band. The overlap is the surface intersection. The left panel was obtained with the horn located at the focus (overlap = 95%). The right panel is the result obtained at the right horn location (overlap = 89%)
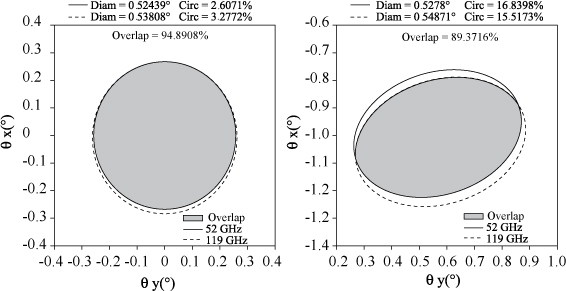
If we now shift the horn from the reflector focus location, the previous approximations are no longer valid and the result is affected. This is shown in Figure 7.6. The value obtained is slightly below 90% which was the requirement that should be met. The discrepancy, however, remains acceptable. Several options can be considered to improve this result. The first is to move the horn nearer to the focus. This is not acceptable as shown in Figure 7.1, this location being not available. Another option is to modify the horn shape in order to get a pattern compensating the effects of de-focalization. Likewise it was shown that the return loss and the cross-polarization mostly depend on the corrugations, it can be shown that the radiation pattern depends on the overall horn shape. What could be done is consequently to start from the last horn design, with identical mode convertor and corrugations dimensions and introduce a few variables enabling us to define the horn shape. Then the optimization process can be performed again introducing the horn + reflector pattern in the cost function. Some very promising results were achieved using this technique.
However, it should be noticed that the horn conical shape has a significant advantage. It is very easy to manufacture using a classical machining technique. The conical shape is obtained digging a metallic piece. The corrugations are dug in a second step.
7.6. Comparison to measurements
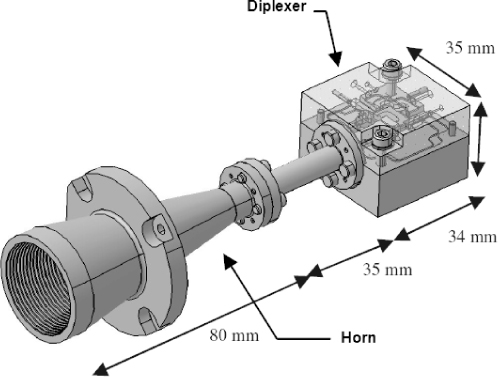
The corrugated horn has been realized by ASTRIUM [COS 11]. ASTRIUM also designed and manufactured a diplexer for frequency separation. Figure 7.7 shows a view of the primary feed including the diplexer.
Figure 7.7. Primary feed: horn + diplexer
However, in order to evaluate the performances of the horn alone, without the diplexer, the experimental measurement setup includes a transition from a circular to a rectangular waveguide: WR15 for the low frequency band and WR8 for the high frequency band. This new setup was simulated and the results obtained are shown for comparison in Figure 7.8.
The far-field pattern is presented in Figure 7.9 for the co-polarization in the E and H planes and the cross-polarization in the 45± and 135± meridian planes. Figure 7.9 shows an excellent agreement between simulations and measurements.
Figure 7.8. Return loss of horn + transition: lower frequency band on the left panel; upper frequency band on the right panel
Figure 7.9. Far-field pattern (co- and cross-polarization) at the center frequencies. The “smoother” curves are simulated. The others are measurements
7.7. Conclusion
The antenna that was described is a non-standard antenna. The design uses an original idea which enables us to use a horn out of its nominal frequency. However, this is particular to this problem and it is unlikely that this non-standard antenna would in the future become a standard antenna.
The design feed can operate at several frequency bands and share a reflector with other feeds. This kind of constraint is usual for satellite antennas and will very probably become a standard in the future. The feeds should fulfill an increasing number of functions and the allocated volume will decrease.
7.8. Acknowledgment
This study was undertaken for ESA/ESTEC under contract Number 20158/06/NL/JA.
7.9. Bibliography
[BEN 05] BENIGUEL Y., BERTHON A., VAN’T KLOOSTER K., COSTES L., “Design realization and measurements of a high performance wide-band corrugated horn”, IEEE Transactions on Antennas and Propagation, vol. 53, no. 11, November 2005.
[BER 89] BERTHON A., BILLS R., “Integral equations analysis of radiating structures of revolution”, IEEE Transactions on Antennas and Propagation, vol. 37, no. 2, pp. 159–170, February 1989.
[COS 11] COSTES L., ADAM J.-P., BENIGUEL Y., GOUTOULE J.-M. “Source bi-fréquence 54 / 119 GHz pour applications radiométriques spatiales”, Journées Nationales Micro-ondes, Brest 2011.
[GRA 05] GRANET C. and JAMES G.L., “Design of corrugated horns: a primer”, IEEE Antennas and Propagation Magazine, vol. 47, no. 2, pp. 76–84, April 2005.
[ORF 04] ORFANIDIS S. J., Electromagnetic Waves & Antennas, available online at www.ece.rutgers.edu/~orfanidi/ewa, p. 497, June 2004
1 Chapter written by Jean-Pierre ADAM, Yannick BÉNIGUEL, André BÉRTHON, Laurent COSTES and Maarten VAN DER VORST.