
C H A P T E R 2
Bridging the Office-SharePoint Gap
In previous versions of SharePoint and Office there was always a clear divide between client- and server-based capabilities. Although Microsoft introduced the term “Microsoft Office System”in 2007, the true integration has been a challenge. Even today, when using the 2010 wave of the product cycle, I'd argue that true integration works in some scenarios but leaves a lot to be desired in many others. However, the landscape is changing and the role of the client environment and operating system is slowly changing to a model where users canuse many different devices on a common server or even a cloud-based set of services and data. To support that model, Microsoft has made sure users can use server- or browser-based versions of the popular client applications such as Word, OneNote, PowerPoint, Excel, and Outlook Web Access.
Features or capabilities more suited to operate within the server-based environment can really benefit from the infinite scalability of the cloud-based model, such as Excel Services for storing and executing server-based calculation logic. Building on the popularity of Excel Services, the 2010 wave of SharePoint introduces a new set of server-based facilities in line with the client applications. Examples include Word Services for creating and formatting data-driven documents that can be saved in the Word file format or as PDFs or XPS files; Access Services for providing data entry and reporting capabilities using the Access client as the development tool but the SharePoint server for delivery and storage; and Visio Services, a server-based engine that enables businesses to display and interact with powerful dynamic diagrams through the browser without the need to install the Visio client application for users other than the authors of the diagrams. This chapter will focus on Visio Services and will briefly touch on Access Services and Word Services;services such as Excel are already extensively documented in other publications
This chapter will discuss some common business scenarios and explore how they can be approached by providing examples of solutions or directions on how to build solutions that leverage these capabilities. The discussions will be relatively generic, pointing out the useful options. There's not much use in adding heaps of screenshots describing the numerous options and steps you may or may not use; that approach would be better suited to a book on Visio and SharePoint.
Visio Services
Visio Services is part of the Enterprise feature set of Microsoft SharePoint 2010. It has to be enabled by the site owner of a SharePoint site by activating the SharePoint Server Enterprise Site features. Doing this will make the Visio Web Access page and Web Part available for use on the site. This Web Part will render a Visio diagram in the browser by either using a Silverlight component or, if Silverlight is not available on the client, it will render the Visio diagram using a .png format; see Figure 2-1. If you want to make the most of the interactivity, you will need to use the Silverlight approach as that will enable advanced scenarios such as overlaying of graphics or textand zooming and selecting of shapes.
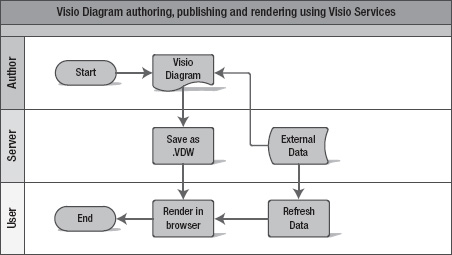
Figure 2-1. Overview of creating, rendering, and consuming a Visio diagram using Visio Services
The Visio Services engine is not only capable of rendering the drawings, it also refreshes data graphics used in the drawing; this can be a user-initiated event or can be set to refresh the data at given intervals. A third interesting capability is the interaction with shapes on the drawing. A shape can be associated with one or more hyperlinks to allow navigation in a drawing by navigation to a different page in the drawing, to a different page in another drawing, or to external URLs. This last option is particularly useful in business process modeling scenarios where a shape could trigger filling out a form that is deployed to a SharePoint environment using InfoPath Forms services. Lastly, the provided Mashup API allows a developer to react to events by adding JavaScript functions to a page that hosts a Visio Services Web Part. This can trigger code that overlays graphics on the drawing or communicates with other Web Parts on the page. You'll explore these options later in this chapter.
Basics
The following sections cover the basics of getting started.
Save to SharePoint
To start using Visio Services effectively, you need to take care of some basics first. A diagram created in the Visio Client application needs to be saved in the Visio Web Drawing format (.vdw). To do this, from the File menu in Visio, pick Save & Send, Save to SharePoint, and on the bottom right of that pane, make sure the Web Drawing File Type is selected (see Figure 2-2).
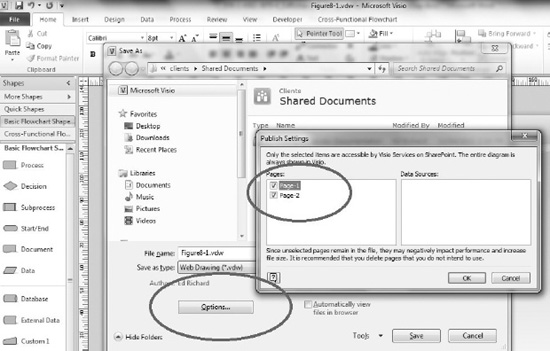
Figure 2-2. Saving as Web Drawing
Note that the Options button on the Save dialog allows an author to limit the pages that will be visible through the Web Part rendering; however, the .vdw file is still full fidelity and, when opened in Visio, will still have all information available. It's not required to keep files in the original.vsd format; you can author and save all drawings in the .vdw format if you want.Once a file is saved in SharePoint, all the normal SharePoint document management facilities become available to the authors.
Display of a Diagram on a SharePoint Page
Embedding a Visio diagram on a page is done by adding the Visio Web Access Web Part to a page. This can be Wiki page in your team site or a standard SharePoint Web Part page. The Web Part is found in the Business Data category and is called Visio Web Access, as shown in Figure 2-3.
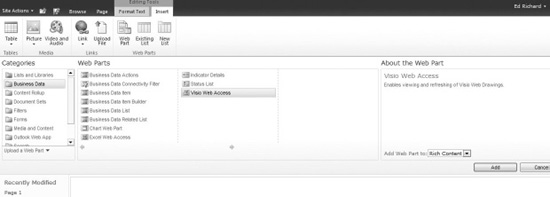
Figure 2-3. Insert the Visio Web Access Part
After adding the Web Part, it's just a matter of pointing the part to the correct Web Drawing URL using the toolpane, as shown in Figure 2-4.
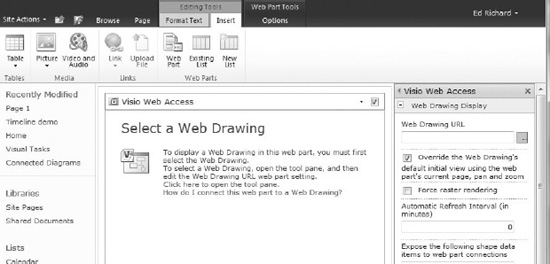
Figure 2-4. Setting the URL using the toolpane
Thankfully SharePoint provides a nicely integrated asset picker so navigating to the correct drawing file is a breeze, as you can see in Figure 2-5.
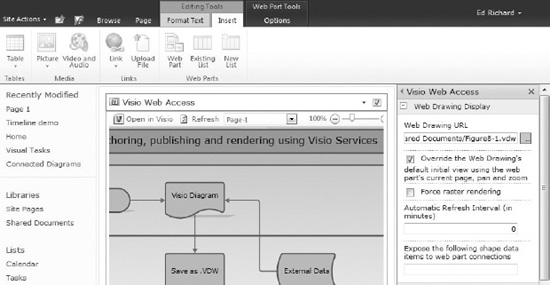
Figure 2-5. The display after selecting the .vdw file URL
Figure 2-6 shows the end result on a Wiki page after tweaking some of the other options of the Web Part settings. You'll look into those specific settings in a bit more detail later on.
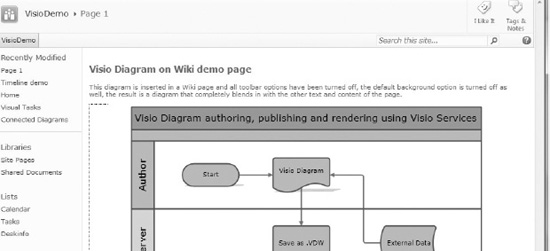
Figure 2-6. Diagram embedded in a Wiki page
If there's a need for the connected Web Part functionality or JavaScript functions to interact with the drawing or shapes, you should use a regular SharePoint Web Part page; the Wiki page doesn't fully support the Web Part zone and Web Part Manager infrastructure. A new Web Part page can be created by going to All Site Content, selecting Create, filtering by page, and selecting Web Part page.
Advanced Configuration Settings for the Visio Web Access Web Part
The Visio Web Access Web Part has a whole range of settings to configure not only the way the diagram looks on the page, but also what options the users has to interact with the diagram. This allows for the end result to be highly interactive and adaptive—or very static and “by design.” There's definitely a need for both in real world scenarios.
The settings are divided in three categories: Display, Toolbar, and Interactivity. You've already seen the use of the first, which is the URL of the diagram to display. The second option offers a choice: is the initial display of the diagram determined by what the author picks as the display properties when saving the drawing file, or is it driven by the values for zoom and pan as entered in Edit Page mode?I usually don't check that checkbox. I also make sure that the viewing dimensions set in Visio when drawing the diagram are suited for display on a web page; it takes some experimenting to find out what works best. Something to take into consideration is the size of the page canvas in Visio. When a diagram is meant for display in a web page, make sure the canvas is as small as possible in Visio. This is done by selecting the Fit to drawing option under the Size button in the Design tab.You're probably accustomed to consuming diagrams through Visio or as printed documents. Visio Services changes that and the diagrams should be designed with the browser in mind, not a printer.
The Force Rastering checkbox, when checked, forces the Web Part to use .png rendering even when Silverlight is installed. The automaticrefresh interval speaks for itself; when using external data connections (explained later) it will refresh the data loaded into the diagram at the entered interval in minutes. Note that setting it to 0 disables automatic refresh. Also, don't set the interval to small—on busy servers the process of refreshing diagrams, depending on where the data comes from, can take a fair bit of time. Last in this category is the Shape Data Item textbox, which takes a comma-separated list of strings reflecting the names of the Shape Data items that will be exposed to the Web Connections dialogs. In Visio, shapes can have multiple data name/value pairs attached to them so basically any number of metadata items can be available for interaction and setting up Web Part connections or by making them available to the JavaScript object model. You'll explore the use of this later in the section discussing various business scenarios.
The checkboxes in the other categories should be self-explanatory. The only one that is really interesting at this point is the Show Default Background option. By default, this is a grey background. Switching this option off makes the diagram use the page background, which in Web Part page usages usually turns out more appealing.
That's really all there is to make your diagrams available to your SharePoint users. The remainder of this chapter provides additional ways of building visually appealing solutions with Visio as engine behind them.
The Repository
As you will understand by now, authors creating and modifying Visio diagrams can benefit from the collaboration and versioning features SharePoint offers. When you create a new site in SharePoint you'll see a site template called Visio Process Repository. What this template provides is a simple team site with a special document library called Process Diagrams that has a range of diagram content types defined that support some of the Visio Process Management or Workflow templates, as shown in Figure 2-7.
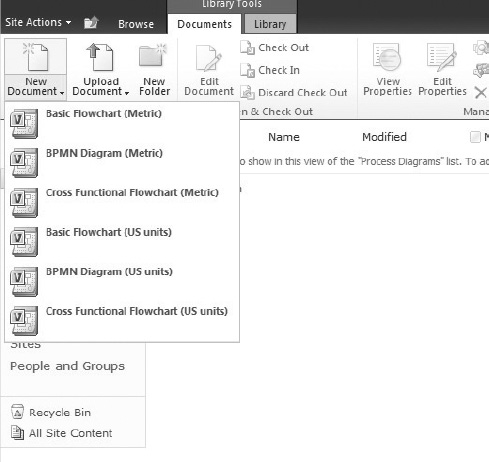
Figure 2-7. Visio Process diagram content types in Visio Process Repository site template
These content types are a good start for those authors that want to embrace what SharePoint has to offer. When using the content types and templates in this site template you'll see that Visio provides some synchronization between the metadata for tags (keywords) and category as edited through the document properties pane in Visio.
SharePoint Workflows in Visio
Once used to the idea of using SharePoint to collaborate on Visio diagrams, users will soon start thinking about automating processes relating to their own daily work, such as reviewing diagrams or assigning specific tasks. This is where typical users of Visio, such as the business analysts using Visio for process modeling, meet the SharePoint developers—or they become SharePoint developers themselves! One of the new templates available in Visio is SharePoint Workflow. This template has all the standard SharePoint workflow actions and conditions that are available for developing workflows in SharePoint Designer 2010, and it enables you to export the diagram to SharePoint Designer or import it back retaining all information added by the developer in SharePoint Designer. This makes it possible to have a full fidelity workflow design ![]() develop
develop ![]() deploy
deploy ![]() use process in place for those workflows that can be developed using the range of new activities and conditions available in SharePoint Designer out of the box. At this point, you are probably thinking of all kinds of future projects were you could use this; be aware that the model breaks when using custom activities so it needs to be handled with care and can only be used in scenarios where the out of the box activities and conditions suffice. Note that a whole range of activities and conditions are available in 2010, so you should have plenty of opportunities to make good use of this great capability.
use process in place for those workflows that can be developed using the range of new activities and conditions available in SharePoint Designer out of the box. At this point, you are probably thinking of all kinds of future projects were you could use this; be aware that the model breaks when using custom activities so it needs to be handled with care and can only be used in scenarios where the out of the box activities and conditions suffice. Note that a whole range of activities and conditions are available in 2010, so you should have plenty of opportunities to make good use of this great capability.
After providing a diagram designed in Visio and deployed through SharePoint Designer, SharePoint can also use this diagram to render the running workflow instances and provide visual feedback of the workflow status to the end users by rendering status icons as overlays over the process steps, as shown in Figure 2-8.
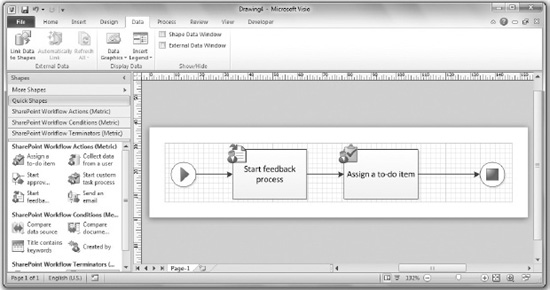
Figure 2-8. SharePoint workflow in Visio
The intricacies of this functionality probably warrant a chapter of its own, but for the purpose of this book I'll just leave you with this high level explanation. It's certainly worthwhile to research this more and see if using a Visio for SharePoint Workflow design is a viable approach in your business scenarios. A learning video to get you started is available from MSDN at http://msdn.microsoft.com/en-us/Office2010DeveloperTrainingCourse_VisioSharePointDesignerWorkflow.aspx and some good instructions are available on the Office Online help site at http://office2010.microsoft.com/en-us/visio-help/import-and-export-sharepoint-workflows-HA010357165.aspx?CTT=1. That last site, Office2010.microsoft.com, deserves a plug. The documentation team is doing a great job and this site is a really good resource for Office-related tasks. For example, you may have worked up an appetite for Visio and decided to brush up on your diagramming skills. Here's a good source for BPMN diagramming in Visio 2010: http://office.microsoft.com/en-us/visio-help/bpmn-diagramming-basics-RZ102712773.aspx; note that there are five videos in seven pages of content.
Data Linkage
In Visio 2007, Microsoft introduced the ability to link data to your diagrams and connect the rows in your data source to shapes. With SharePoint 2010 and Visio Services now in the picture, this opens up a range of opportunities, in particular because you are able to setup an automatic refresh for diagrams displayed using the Visio Services Web Part. There is a range of available data source types, including the use of an existing .odc file stored in SharePoint; see Figure 2-9.
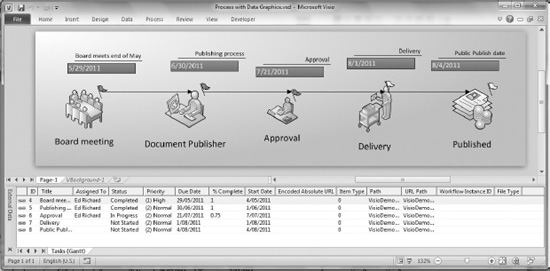
Figure 2-9. Example of a simple process diagram linked to a SharePoint list showing icons, due date, and title
As a default, Visio Services uses the identity of the currently logged on user to access the connected data source. For example, when a diagram is connected to an Excel spreadsheet stored in your SharePoint site, the user needs rights to view that Excel file. When using data sources external to SharePoint, the data source requires more configuration for using the SharePoint Secure Store Service or the Unattended Service Account, which typically is done by your administrator who configures the Visio Graphics Service through Central Admin or using PowerShell. This Service also allows the configuration of trusted providers, which allows the administrator to configure what types of data sourcedata sourcesdata sources the diagrams areallowed to connect to. Note that this does not limit the available options in the Visio Client for the author of the diagram. The diagram just displays an error when viewed through the browser while the data is being refreshed.
When none of the datasource options work for your scenario, there is also the option to write your own custom data provider. MSDN provides a good walkthrough covering that process.(at http://msdn.microsoft.com/en-us/library/ff394595.aspx).
The actual process of attaching a data source to a diagram and linking the shapes is supported by a wizard that can be accessed through Visio's Data tab, as shown in Figure 2-10.
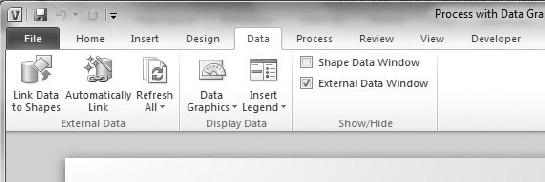
Figure 2-10. Data Tab in Visio 2010 Premium
The Link Data to Shapes button launches the wizard, which is pretty straightforward. Depending on the chosen data source, there are different configuration steps. For example, when connecting to a SharePoint List there's an option to link to a specific view. This results in an extra step to select the appropriate view. After connecting to a data source, the external data pane opens, showing the rows available in the data source (see Figure2-9). You can connect a diagram to multiple data sourcedata sourcesdata sources.
By default, the rows aren't linked to any shapes. This can be done through the Automatically Link wizard or by manually selecting a row and dropping it on the relevant shape in the diagram. Typically, when a row is dropped on a shape for the first time, Visio creates a default Data Graphic that will be used for all shapes that have a linked row. It's this Data Graphic definition that determines which data items are displayed on the shape and what the data item looks like. Visio provides a range of options to display data items (fields in the rows) as text, data bars, or icons; the value can also be used to set the color of the shape. All of these data items in the data graphic definition have extensive configuration options that allow good control over what and where the items are displayed. The Data Graphic configuration is accessed by right-clicking a linked shape and selecting Data![]() Edit Data Graphic from the Context menu. Figure2-11 shows one of the configuration options—in this case the definition of a data item that will show a colored flag based on the value of the Status field. In this example, the data source is a Task list in SharePoint and the connection just points to the Gantt view, a custom view that filters based on a Yes/No field called Gantt (see Figure2-9).
Edit Data Graphic from the Context menu. Figure2-11 shows one of the configuration options—in this case the definition of a data item that will show a colored flag based on the value of the Status field. In this example, the data source is a Task list in SharePoint and the connection just points to the Gantt view, a custom view that filters based on a Yes/No field called Gantt (see Figure2-9).
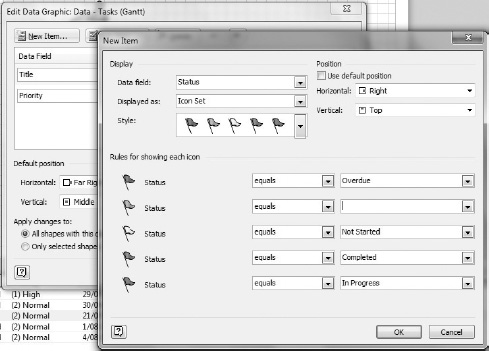
Figure 2-11. Configuration of a Data Graphic item using icons mapping to status values
Refresh
The most exciting bit about these linked data sources is that Visio Services can be setup to automatically refresh the data when rendering a published diagram. The configuration settings can be set by using the Refresh Dataoption under the Refresh All button in the Data tab. This type of visualization offers some powerful functionality to your solutions. Typical examples of this type of use are to monitor the status of network, hardware, or even software components. Microsoft itself uses Visio dashboards in Microsoft System Center Operations Manager at http://visio.microsoft.com/en-us/Templates_And_Downloads/Software_Add-ins/Pages/Visio_2010_Add-in_for_System_Center_Operations_Manager_2007_R2.aspx. It's also used in the workflow visualization in SharePoint to make the icons on the steps render dynamically. I personally have used it to indicate status of workflow processes and workload for a loan origination solution and as a status indicator against SQL Server Integration packages when processing large amounts of data in multiple steps. It's most useful in longer running processes as the typical refresh interval should be set to minutes (as opposed to tasks that take seconds) because connecting to an external data source, refreshing the data, and rendering the results will take multiple seconds by nature (see Figure 2-12).
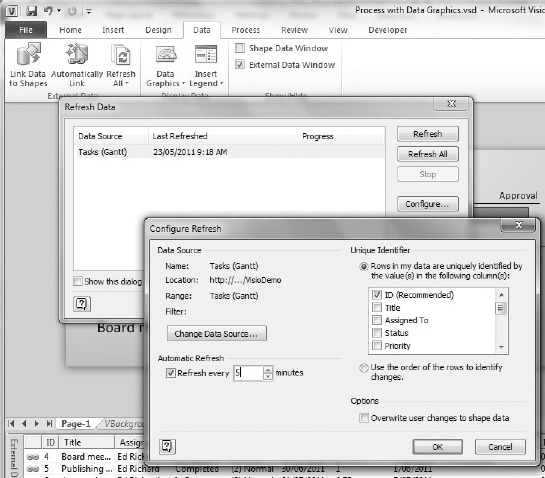
Figure 2-12. Configuring the Data Refresh settings
Note that Visio needs to know which field is the unique identifier. There is a limit to the interval that can be used for the refresh. On most production environments, it can take a bit of time to verify access to a data source and run the query to get to the data. On top of that, the rendering engine has some work to do figuring out all the linked shapes and iterating through the dataitems for each shape, so it often takes a little bit of time to render a refresh. This is why the smallest interval that can be set is a minute. I recommended you test your scenario and determine the appropriate value by taking into account the number of linked data sourcesand users who will be looking at the diagram concurrently. I found it reassuring that Microsoft has actually published results and recommendations around the research they have done on Visio Services performance and capacity planning and I'd like to point out that I found the same results in my projects; see http://technet.microsoft.com/en-us/library/gg193020.aspx. Obviously you need to look carefully at your environment and make sure that making the dataconnections doesn't cause bottlenecks in these cases.Remember, the SharePoint Developer Dashboard is an excellent tool to analyze what is going on in your dashboard pages.I recommendconnecting to SharePoint external lists over direct connections because SharePoint cleverly caches the dataso the refreshes will typically be faster.
The data refresh interval value can also be set on the Visio Web Access Web Part that renders the diagram on the page in SharePoint. This value can be edited through the Web Part properties (see Figure2-13).
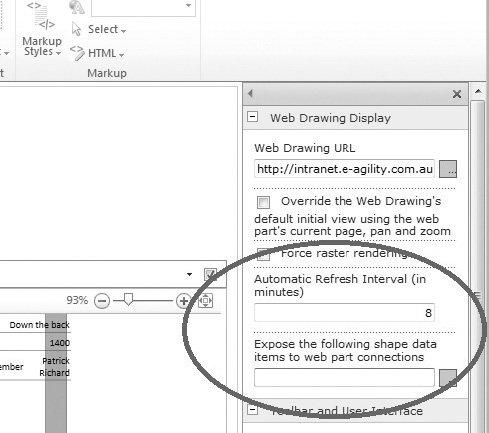
Figure 2-13. Setting the refresh interval in SharePoint
Looking at the Web Part settings in SharePoint reveals another interesting feature that provides good extensibility options for further customization scenarios. The ”Expose the following shape data items to web part connections” option allows full flexibility over what information hidden inside the diagrams can be exposed to the connected Web Parts interface the Web Part framework uses. This is where things get exciting because it allows you to use the published diagram in the context of data stored in SharePoint or exposed through SharePoint. This means you can use data, selections, or filters to drive the behavior of the diagram, or you can use the diagram and user selections to drive what happens on the rest of the page.
I have used this option to build pages that show a business process map and provide contextual information based on the user selecting a step in the process. Imagine, for example, showing all policy and procedure documents that are relevant to a particular step in a process. I'll use this scenario in the next section to explain how to approach this type of solution.
Connected Web Parts
Conceptually, SharePoint supports connecting Web Parts out of the box and the Visio Web Access Web Part exposes some shape data, such as the name, by default. There are multiple sample on the Web that explain how, for example, to link two diagrams where the parent diagram drives the selection of pages in the child diagram to provide a dynamic master-detail relationship view. In reality, however, there are challenges with dealing with the out-of-the-box configuration and making sure the right naming conventions and data types are used. This is why I have adopted the approach of setting it up manually so I have complete control over the parameters that make these connections work.
In order to do this, I make use of the Visio feature to add custom data items using the Define Shape data dialog. You can find this by choosing the Data option in the Context menu of a Shape and selecting the second option in that sub-menu. This lets you specify the name you need, the type of item, and the value. This uses the same principle as the data linkage described previously, but this time it provides manual control over which items are created for each shape. Take good note of the name for the relevant data item—it's the same name you'll need to use in the previously mentioned “Expose the following shape data items to web part connections” property for the Visio Web Access Web Part.
Follow these steps:
- Define a new data item for the relevant shapes. Please note the use of the name, ProcessStepID, to make setting up the connections and filtering easy. You need to add a column of the same name and data type of the document library you will be displaying. Use 3.1 as the example value.See Figure 2-14.
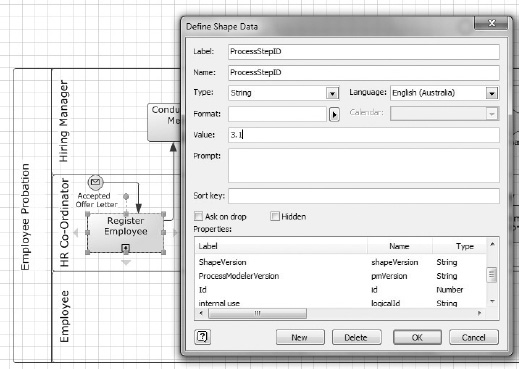
Figure 2-14. Adding a new DataItem for the Register Employee Shape
- Save the diagram as a Web Drawing in your SharePoint site.
- Create a new Web Part page. (Best practice is to use a regular Web Part page, not a Wiki page, as the Web Part connections don't work in Wiki pages).
- Add a Visio Web Access Web Part and make it display the web drawing. In the Web Part properties, make sure that you add ProcessStepID for the Shape Data Items to expose.
- Add a column to your document library with the same name (ProcessStepID) of type singlelineedit.
- Make sure there's at least one document in the Document library with the value 3.1 in the ProcessStepID column.
- Add another Web Part to the Web Part page to display the content of the Document library.
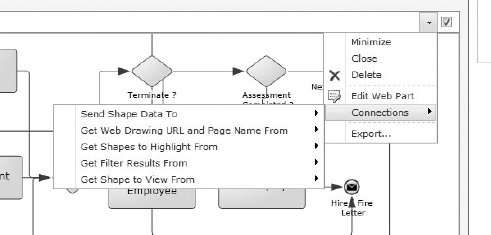
Figure 2-15. Setting up a Web Part connection
- While still in Edit mode on the Web Part Page, select Connections
 Send Shape Data To from the Context menu of the Visio Web Access Web Part and configure the connection to use the ProcessStepID column (see Figure 2-15). Note how the Provider Field Name drop-down now has ProcessStepID as an option because you have exposed that data item through the Web Part Settings (see Figure 2-16).
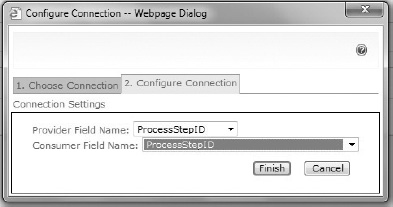
Figure 2-16. Configuring the Web Parts connection to use ProcessStepID
- Save the page and test the filter by clicking on the shape where you have set the ProcessStepID value (see Figure 2-17).
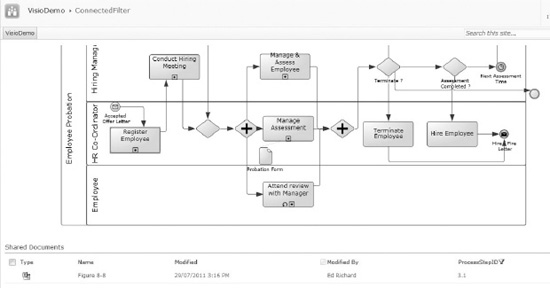
Figure 2-17. The result. Note that Visio Services renders the selected shape using a blue border and SharePoint filters the Document library content indicated by the Filter icon next to the ProcessStepID column.
Another way this functionality could be usedis by creating a custom list with a multi-line edit column configured to accept HTML content. If used in a similar way, the user can see contextual HTML content that is changing and relevant depending on the selected shape. Linking data to shapes also creates data items on each shape, so by setting those data items as being exposed, the same approach can work for data-linked shapes and data item values. This offers a genuine advantage over displaying linked data using Data Graphics because when using Data Graphics, all data is always visible on all shapes so it's easy to create a very crowded and messy diagram. Using the connected Web Part approach, you can just display the contextual information you need for each selected shape.
Mashup API
You are not restricted to using the connected Web Part framework to add interaction and dynamics to the diagram displayed using the Visio Web Access part. The Visio 2010 developers have added an object model to Visio Services that allows developers to respond to events in JavaScript and even draw additional information on top of the rendered diagrams. The API is fully documented on MSDN and there are some great articles on the Visio team blog called Visio Insights. You will find the URLs to these important resources in the “References and Links” section.
I am often asked to include a pop-up screentip associated with a shapethat is launched when the user hovers the mouse over the shape. Visio has that option, but diagrams published to SharePoint and rendered in the browser lose that ability. This is great example of something you can add using this JavaScript API Library.
As with any other client script addition to a SharePoint page, you can add some JavaScript functionality on a page by adding a content Web Part that point to a .js file. (I'm assuming that you're familiar with that concept; if not, try a simple search on the Web for more information.)
Listing 2-1 shows the JavaScript code to display a pop-up message. The first step in the process is setting up some variables and the event handlers. All Visio-Mashup-JavaScript solutions follow this basic pattern.
Listing 2-1. JavaScript for Pop-up Message
Sys.Application.add_load(onApplicationLoad)


//  Declare global variables for the application

var webPartElementID = "WebPartWPQ3";         // The HTML tag id of the Visio Web Access part.

var vwaControl;                                                     // The Visio Web Access Web part.

var vwaPage;                                                         // The current page.

var vwaShapes;                                                      // The collection of all the shapes on the current page.

var currentlyAnnotatedShape;                              //   The currently highlighted shape.


function onApplicationLoad() {

        try{

                vwaControl= new Vwa.VwaControl(webPartElementID);

                vwaControl.addHandler("diagramcomplete", onDiagramComplete);

                vwaControl.addHandler("shapemouseenter", onShapeMouseEnter);

              vwaControl.addHandler("shapemouseleave", onShapeMouseLeave);

        }

        catch(err){

        }

}
The onDiagramComplete function is typically used to initialize the variables:
function onDiagramComplete() {

        try{

                vwaPage = vwaControl.getActivePage();

                vwaShapes =  vwaPage.getShapes();

                vwaShapeCount = vwaShapes.getCount();

                vwaPage.setZoom(-1);         // Set a default zoom level

             }

        catch(err){      }

}
Generally, I also use this function to set a default zoomlevel. I've left this in Listing 2-1 to show you how to do it, but it's optional. The value -1 means “Fit to page” where the context page is the area occupied by the Visio Web Access Web Part.
Listing 2-2 shows how to implement the MouseEnter and MouseLeave events.
Listing 2-2. MouseEnter and MouseLeave Events
onShapeMouseEnter = function(source, args)

{


        try

        {

        var shape = vwaShapes.getItemById(args);    // Grab the selected shape


        // Add a XAML Overlay but add text found in the shape's data item called 'Status'

        // this shows a shapedata field called status if found

        var shapeData = shape.getShapeData();

        var c = "Status Not Found";


        for (var j=0; j<shapeData.length; j++)

        {

                if (shapeData[j].label.toLowerCase().indexOf("status") !=-1)

                {

                        c = shapeData[j].value.toLowerCase();

                }

        }

        var xaml = "<TextBlock>"+c+"</TextBlock>";


        shape.addOverlay(

                          "Overlay",

                           xaml,

                           0,

                           0,

                           shape.getBounds().width-50,

                           shape.getBounds().height-40);


        }

        catch(err){}

        }

}
This function should be easy to understand.It looks for the selected shape and loops through the data items in that shape for one called Status. It constructs an XAML element and passes that into the addOverlay function of the API, which takes care of the rendering. As content of the textblock, it uses the value of the found data item.
Listing 2-3 shows how to remove the screentip.
Listing 2-3. Removing the Screen Tip
onShapeMouseLeave = function(source, args) {

        try{

 var shape = vwaShapes.getItemById(args);

                   shape.removeOverlay("Overlay");

        }

        catch(err)

        {

        }

}
Not too complicated, but very powerful and flexible because you have many options in the way you build the XAML fragment. How is this different from the standard behavior of displaying a data item's value using Data Graphics? In this case, the data only displays when the mouse is over the shape, which keeps the diagram nice and tidy yet adds many options for displaying information. This JavaScript function could get fairly complicated in the way it implements business rules and interprets data item values. Because it's XAML, you also have a full arsenal of user interface controls at your disposal.
Hyperlinks
Visio comes with some behavior that can make shapes do things. Visio allows authors to specify one or more hyperlinks on shapes; when rendered through Visio Services, those hyperlinks still work. You can hyperlink to external URLs so clicking a shape could start an InfoPath form, navigate to a page in your site, or simply link to anther page in the diagram itself. If multiple links have been defined on a shape, holding the control button while clicking renders a list of the hyperlinks that can subsequently be clicked like a menu.
There's an important thing to keep in mind, though, when deciding to make use of hyperlinks in this way: the previously discussed interaction using connected Web Parts stops working. In other words, you can't have hyperlinks and connected Web Parts based on shape selection working on the same page. This is an important design consideration you have discuss when designing a user experience for you solution. Users can get excited by all the options, but in this case you can't have them all at once.
Business Scenarios Enabled by Visio Services
I hope by now you've got some ideas on how Visio Services is going to fit your business needs. One of the solutions I recently built using Visio Services for multiple clients was in the space of Business Process Visualization.
Business Process Modeling
In Visio 2010 Premium, Microsoft included functionality and templates for drawing Business Process Models using the BPMN 1.2 notation standard as well as some others. When combined with SharePoint 2010, this adds another dimension to publishing Business Process Models and contextual information. Many organizations are currently reviewing their policies, procedures, and processes and already have SharePoint available. Visio Services and SharePoint provide a great platform for integrating all that information, collaborating on the review effort, and publishing the results in a multi-dimensional, easy-to-discover way.
Document Sets
SharePoint 2010 Document Sets are a good example of this. I call them “folders on steroids.” They add behavior (workflows), metadata, and a user interface (Welcome page) to the mix. The Document Set could be used as a container for all policy and procedure documents in a business process so they can all be managed and versioned together in a consistent container. The Document Set Welcome page is a SharePoint Web Part page, so it can easily be customized to display the process map developed in Visio, including drill-down functionality by implementing detail process maps as pages in a Visio diagram. It might be too hidden of a hidden feature, but customizing the Welcome page is an option that can be accessed via the Document Set Settings page; there's a link all the way on the bottom of that page. It opens up the Welcome page and from there you can use the normal Edit Page functionality in the ribbon. Keep in mindthat when modifying the Welcome page, if you do it on the Document Set content type, you'll modify the page for all sets that are based on that content type. If you want different diagrams for each process, the correct approach is to create a new Document Set content type for each process you want to visualize.
Shape Highlights Depending on Roles
Using the Mashup API you could highlight the steps in the process that are most relevant to the userby providing a dynamic view those steps. The approach to take is to store the information linking roles to process steps somewhere; you could just store the information in a custom dataitem on the shapes or you could use a SharePoint list and link the relevant items using a Process Step ID field that you define. I found the latter approach a good one as it provides the business users with an easy way to change the roles that apply to a step without having to re-publish the diagram. I have then used the Mashup API and JavaScript to lookup the relevant roles and overlay the information on the selected shape. This provides a nice interface where the diagram doesn't get cluttered up with information but just shows the relevant information on selection.
These are just a few features that the combination of Visio Services and SharePoint 2010 offer you. I'm sure you'll discover many more once you start exploring the power of Visio and SharePoint.
Word Services
Word services is another one of the service applications Microsoft has added to the arsenal of tools in SharePoint. The key application of this service is those scenarios where you would in the past have used Word, possibly installed on a server (by the way, this scenario is not supported!) to generate documents such as invoices or letters (typically templates) merged with business data. I've done it myself and I felt the pain of having to debug such implementations. It's no fun having to re-start servers every so often because of some hidden dialog Word has popped up because it could open a file or something like that. In batch scenarios this can quickly open up hundreds of Word instances that never go away until you re-start the server or kill them manually one by one.
Many customers have a need for this scenario which is why Microsoft has basically created a server version of Word, without a UI that can process or create Word documents really fast. Combined with the power of the .docxXML file format and an SDK to access those files from code, this forms a framework for very flexible business scenarios for generating or manipulating Word documents. One use could be to insert business data in Wordtemplates or convert Word documents into .pdf or .xps files.
Andrew Coates, a developer evangelist for Microsoft Australia, has posted some very good instructions on his blog that deal with Word Services, SharePoint, and the OpenXML SDK (http://blogs.msdn.com/b/acoat/). I highly recommend that you read them before you get your feet wet with these types of solutions.
Access Services
When it comes to Access Services, I have often wondered where it would fit in typical business scenarios. There's the obvious one: the ability to rapidly build applications that can be deployed and accessed through SharePoint. Of course, there are also the powerful reporting capabilities Access provides, such as reporting on data stored in SharePoint. By the way, did you know in some cases you can also create some sophisticated visually appealing reports using Visio? Go into a tasks list in SharePoint; on the List tab you will find a Create Visio Diagram option in the Connect & Export group. Try it out!
One of the really cool business uses for Access that I recently discovered is to do batch operations on SharePoint list data—something you can't easily do any other way without resorting to third party tools. In Access 2010 you can create a new query against a SharePoint list, effectively creating a local copy of the data inside Access that can be manipulated using SQL queries in Access. Sync the list back to SharePoint and voila, you've got a very capable batch processing solution for your SharePoint data.
Summary
At the end of the day, all these solutions provide business users with dynamic, powerful tools that typically make them work smarter, not harder. It's all about the Business Agility the platform enables. That's the true business value that SharePoint solutions deliver.
References and Links
- Visio custom dataprovider
http://msdn.microsoft.com/en-us/library/ff394595.aspx - TechNet Visio Graphics Service configuration
http://technet.microsoft.com/en-us/library/ee524061.aspx - MSDN Visio Vwa Namespace for JavaScript
http://msdn.microsoft.com/en-us/library/ff394600.aspx - The Visio Team blog, Visio Insights
http://blogs.msdn.com/b/visio/ - The Author's blog; check it out for more hands-on examples of Office and SharePoint integration.
http://EdonOffice.blogspot.com