
5
Design and Assessment Principles of Semiconductor Flat-Panel Detector-Based X-Ray Micro-CT Systems for Small-Animal Imaging
A. Sisniega, J.J. Vaquero and M. Desco
CONTENTS
5.2 Small-Animal Micro-CT Design Considerations
5.3 Overview of Flat-Panel X-Ray Detectors for Cone-Beam Micro-CT
5.3.1 Indirect Conversion Flat-Panel Detectors
5.3.1.1 X-Ray Conversion Stage
5.3.1.2 Secondary Quanta Detection and Read-Out
5.3.2 Direct Conversion Flat-Panel Detectors
5.3.2.1 X-Ray Conversion Stage
5.4 Design of an X-Ray Micro-CT System
5.4.1 Components of a Small-Animal Micro-CT System
5.4.2 Geometrical Configuration
5.4.3.1 Online Correction of Raw Data
5.4.4 Tomographic Image Reconstruction
5.5 Evaluation of Micro-CT Systems
5.5.1 X-Ray Flat-Panel Detector
5.1 Introduction
In recent years, the number of animal models of human disease has increased and their use is now widespread. The need to study biological processes and morphological features in small-animal models—and to do so noninvasively so that the process can be tracked over time—has stimulated the development of high-resolution biomedical imaging devices. Nowadays, drug development relies heavily on the use of small-animal models and molecular imaging techniques, such as positron emission tomography (PET) or single photon emission computed tomography (SPECT), to provide the required functional information that characterizes the behavior of the drug. However, the results obtained are sometimes difficult to interpret due to the lack of a reliable anatomical localization of tracer uptake. To avoid this problem, registration of PET and SPECT images with accurate anatomical images [1] has proven to be an appropriate choice in new multimodality systems.
Among the different anatomical imaging techniques, x-ray microcom-puted tomography (micro-CT) is the preferred complement to preclinical functional imaging modalities, due to its high-resolution capabilities and to the possibility of integration with other imaging systems.
As well as complementing the information obtained using molecular imaging techniques, micro-CT by itself is a valuable tool in small-animal imaging and is commonly used in research fields associated with the morphology of the sample (e.g., bone studies) [2–6].
In the development of x-ray micro-CT systems, most approaches make use of detectors based on x-ray image intensifiers and charge-coupled devices (CCD) to which a scintillator screen is connected either directly or using light guides (e.g., fiber optic plates) [7–9]. Recent developments in semiconductor detectors have made it possible to use new, compact devices—flat-panel detectors—for x-ray detection. These flat-panel devices can be categorized into two different groups according to the process carried out to convert the x-ray photons (primary quanta) to electric charges that are gathered and converted into a digital signal. The first approach makes use of photoconduc-tors that directly convert the incident x-ray radiation into electric charges as secondary quanta. Devices which conform to this approach are called direct conversion flat-panel detectors. The second approach is based on scintillation screens that stop incident x-ray photons, thus producing optical photons as secondary quanta. These optical photons are then stopped by a photodi-ode array that provides the electric charges required by the device read-out electronics. The detectors that implement this scheme are known as indirect conversion flat-panel detectors.
Direct conversion detectors based on amorphous selenium (a-Se), indirect conversion detectors based on amorphous silicon (a-Si) coupled to scintillation screens, and indirect conversion detectors based on CCDs connected to scintillation screens using fiber tapers are compared in [10]. The authors conclude that the final reconstructed CT image quality cannot be predicted from differences in the quantum efficiency of the detectors studied, due to stability issues.
In the past 10 years, different micro-CT systems based on microfocus x-ray tubes and semiconductor-based flat-panel detectors arranged in cone-beam geometry have been developed, and their suitability has been proved [11,12]. Flat-panel-based cone-beam configurations present advantages over other configurations (e.g., pencil or fan-beam geometries) used in clinical or preclinical applications. These advantages include reduction in acquisition time, large axial field of view (FOV) with no geometrical distortions, optimization of radiated dose per time and data acquired, and a more compact, space-saving design. Additionally, indirect conversion semiconductor flat-panels are particularly interesting for small-animal imaging due to their high-resolution capability, especially when the microcolumnar scintillation screen is directly grown on the semiconductor detector. Current advances in semiconductor technology point to improved features in the future [13,14].
The main topics to be addressed during the design of micro-CT systems are reviewed later, with special emphasis on x-ray detector features and management. The performance of the system is also analyzed. This review is based on a state-of-the-art x-ray micro-CT [15] used as an add-on for small-animal PET systems [16,17]. The micro-CT system was designed to achieve an FOV that is appropriate for small rodents, a spatial resolution better than 50 μm, and a minimal radiated dose. The tomography system includes a flat-panel detector (complementary metal oxide semiconductor [CMOS] technology with a columnar cesium iodide scintillator plate) with a 50-μm pixel size, and a microfocus x-ray source with a nominal focal spot of 35 μm. Both elements are placed in a rotating gantry according to the cone-beam geometry. The magnification factor of 1.6 was obtained by applying the design specification for final resolution, FOV size, and mechanical constraints defined by the system size and radiation shields.
The performance of the flat-panel detector was evaluated to validate its suitability for the micro-CT scanner. To validate its use for preclinical in vivo imaging as an add-on system for PET/SPECT tomographs or as a standalone unit, the overall performance of the system was evaluated in terms of spatial resolution, image contrast, exposure dose, and image acquisition and reconstruction time.
5.2 Small-Animal Micro-CT Design Considerations
Small-animal micro-CT imaging systems are usually designed to provide complementary information for molecular imaging systems. The main design issues are image quality and the radiation delivered to the study animal.
Early implementations of x-ray micro-CT systems were aimed at nondestructive testing for industrial applications or at the in vitro study of biological tissues [18]. The main design goal for these systems was to achieve high image quality (resolution and contrast), regardless of the radiation dose delivered. They were not designed to facilitate the use of equipment for in vivo imaging, such as anesthesia equipment or vital sign monitoring devices. Thus, the mechanical setup was such that the x-ray source and detector were fixed while the sample was rotated between these devices. This made system calibration easier and ensured long-term stability.
In vitro micro-CT scanners can achieve very high spatial resolution values (∼5 μm) using microfocus x-ray sources and area detectors such as CCDs or flat-panel detectors. However, to obtain an appropriate signal-to-noise ratio, it is necessary to perform long acquisitions at high radiation doses. Furthermore, the desired resolution in the reconstructed volume is commonly obtained in practice by using high magnification values (>3), which require the detector to be situated at some distance from the sample; therefore, such mechanical arrangements are only feasible if the x-ray source and detector are assembled on a horizontal flat surface. A typical configuration for an x-ray in vitro system is depicted in Figure 5.1.
Small-animal micro-CT scanners also offer a reasonably high spatial resolution with sufficient image quality, although they require acquisition time and radiation dose to be as low as possible. These two additional constraints reveal the need for a new approach to the implementation of the system. Therefore, a compromise must be sought between image quality, spatial resolution, acquisition time, and dose delivered. Furthermore, during the acquisition process, the animal must be kept steady while the gantry holding the x-ray source and detector rotates around it. This is an important requirement, since it is necessary to minimize the disturbance to the animal and to avoid inconsistent projection data derived from any organ displacement that may occur if the animal is moving. Anesthesia equipment and monitoring devices (heartbeat, breathing rate) must be correctly placed, as monitoring becomes somewhat challenging if the animal is rotating.

FIGURE 5.1
Typical configuration of an in vitro micro-CT scanner. The magnification factor can be adjusted by varying the distance between the sample and the flat-panel detector.
The constraints imposed by in vivo requirements demand a more sophisticated and careful design if the system is to be compact. This requirement is even more important when space is scarce. In this setting, the mechanical features of the x-ray source and detector become more important, since these devices should be placed on a rotating gantry to keep the subject in a fixed position. To avoid instability during rotation, the weight and size of the devices should be as low as possible, and mechanical elements are necessary to counterbalance the system. Although some scanners make use of slip rings, this is not the most common solution, as they are expensive and rotation speed is not the most constraining factor. Therefore, the signal and power cables must be placed in such a way that they do not disturb the image acquisition process. This usually involves an extension of cable lengths, thus increasing signal losses and deteriorating the signal-to-noise ratio in the acquired data.
Sensor specifications are also an important issue. Fast and sensitive detectors are extremely desirable for small-animal micro-CT, given that acquisition time and dose delivered are paramount.
Since the acquired x-ray micro-CT projection data must be highly stable along the acquisition path, it is necessary to use highly stable x-ray sources and detectors. If the detector is not stable, it becomes necessary to acquire several correction datasets during a single acquisition process, thus increasing total acquisition time.
Different approaches can be adopted in the selection of the detector. Nowadays, CCDs connected optically to a scintillation screen are the most widely used detectors in small-animal micro-CT systems. These detectors show good spatial resolution (usually depending on the coupling between scintillator and sensor) and the fastest image rate. However, these devices are usually too bulky to integrate in a moving gantry. Another drawback is that the sensor can be seriously damaged by x-ray radiation [19] and must be carefully shielded, thus increasing the size and weight of the system.
Modern designs make use of the so-called flat-panel x-ray detectors (semiconductor-based light detector matrices coupled to scintillator screens [20] or direct conversion semiconductor detectors), due to their high resolution (equal to or better than that achieved by CCDs) and image quality, combined with a compact design and low weight that simplifies integration in the rotating gantry. Their main drawback is that most of them are slower than CCDs.
Some experimental developments [21–24] make use of photon-counting detectors based on cadmium telluride (CdTe) or cadmium zinc telluride (CZT) sensors. These devices are able to classify the incoming photons according to their energy, enabling accurate correction of energy-related artifacts, such as beam hardening or scatter. Much effort is being made in the development of x-ray photon-counting detectors for micro-CT systems, but these are still at an early stage. The quality and image rate of the data acquired by state-of-the-art devices is not sufficient to allow them to be used in commercial preclinical imaging systems.
5.3 Overview of Flat-Panel X-Ray Detectors for Cone-Beam Micro-CT
Flat-panel digital detectors are one of the most widely used x-ray detection devices for small-animal imaging. Several comprehensive reviews of flat-panel x-ray detector technology [20,25–27] address topics not included in the present work and could prove useful for the interested reader. This section presents a brief overview of the state-of-the-art technology of the aforementioned detectors, focusing on their suitability for small-animal cone-beam micro-CT.
Flat-panel detectors can be classified as direct conversion and indirect conversion devices (Figure 5.2). In the following, the features of flat-panel detectors are presented according to this classification. A comparative study of direct and indirect conversion flat-panel detectors can be found in [28].
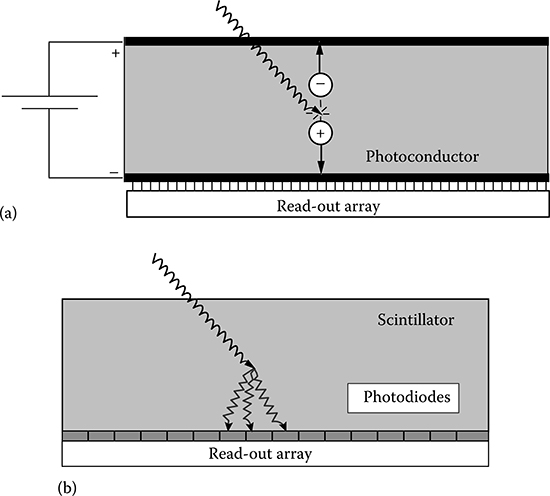
FIGURE 5.2
Scheme of direct (a) and indirect (b) detection approaches used in x-ray flat-panel detectors.
Since x-ray detectors can be simply modeled using cascaded devices [29–32], for the sake of clarity, the following explanation divides signal generation into two different stages, namely, x-ray conversion and data readout. Information on the position where the x-ray photon is detected and on its deposited energy is generated at the beginning of the first stage, where the x-ray photons (primary quanta) are stopped. Subsequent steps do not add new information to form the image. Thus, it is important to have a low noise level and adequate amplification in the stages following x-ray capture to ensure that no information is lost after the x-ray photons are detected. The stage with the poorest quanta detection capability, the quantum sink, limits system performance in terms of signal-to-noise ratio. Since the information lost in the quantum sink cannot be recovered, a well-designed detector should have its quantum sink at the very first stage of image formation, namely, when x-ray photons are stopped [20].
5.3.1 Indirect Conversion Flat-Panel Detectors
5.3.1.1 X-Ray Conversion Stage
Indirect conversion flat-panel detectors detect individual x-ray photons by generating optical photons as secondary quanta. A subsequent step is needed to convert the optical photons into electric charges on each pixel. Integrated over a period of time, this charge is then amplified and digitized.
The outer layer of the detector is made of a scintillation material, which provides a variable number of optical photons per x-ray photon stopped, depending on the energy involved in the interaction.
The scintillation materials used in x-ray flat-panel detectors are usually inorganic compounds such as cesium iodide or gadolinium oxysulfide. Scintillation in such materials is based on energy transfer to the molecules of the scintillator, depending on the energy states determined by the crystal lattice of the material. In insulator or semiconductor materials, electrons remain in a discrete number of energy bands. The two main energy bands are the valence band and the conduction band. Electrons with an energy state that places them in the valence band are bound to the crystal lattice and, therefore, fixed. However, those electrons with sufficient energy to reach the conduction band can move across the crystal. The band between the conduction and valence bands is the forbidden band, where no electrons can be found in a pure crystal.
If a photon with sufficient energy reaches an electron in the valence band, it can increase its energy so as to reach the conduction band, thus leaving a hole in the valence band. The excited electron returns to the valence band by emitting a photon of energy equal to the difference between the energy levels. This energy is usually too high and the emitted photon energy does not correspond to the visible light range.
To increase the number of visible light photons emitted, dopants are added to the crystal [33]. These materials create defects in the crystal lattice, where the normal energy band structure is modified, thus creating energy levels within the forbidden band. Excited electrons can fall first into one of these energy levels and later into the stable valence band, and emit photons with an energy that falls within the visible range.
Several scintillation materials have been used in flat-panel detectors. The most desirable characteristics of a scintillation material for this application are the possibility of implementing large-area screens, the production of a high number of optical photons per x-ray photon detected, high sensitivity to the energy spectrum of the x-ray beam, and a high degree of correlation between the direction of propagation of the incident x-ray photon and that of the optical photons generated. It is also important that the energy spectrum of the photons emitted by the scintillation material fits the reception spectrum of the photodiodes used in the second detection stage.
At present, the two scintillation materials most commonly used in flat-panel detectors are terbium-doped gadolinium oxysulfide (Gd2O2S:Tb) and thallium-doped cesium iodide (CsI:Tl).
Gd2O2S:Tb has traditionally been used to detect x-rays and can be manufactured easily and cost-effectively using well-known technology [20]. It comes in the form of a powder [34] composed of microscopic particles with a density of 7.3 g/cm3. The particles are bound together by an acrylic binder to form a homogeneous paste that is usually applied as a coat on a glass or plastic support. A reflector can be added to increase light collection in the detector.
Gd2O2S:Tb has one of the highest figures of merit (defined as the best balance between high light production, fast response, and appropriate energy spectra) among powder scintillators: it is highly efficient and has a very low afterglow and an appropriate energy emission spectrum, centered at 540 nm. However, achievable spatial resolution is limited by the lateral scattering of the photons generated. Thicker scintillation screens offer a longer path for the optical photons, thus increasing scattering and worsening spatial resolution, while thinner screens stop a low fraction of the received x-ray photons, thus decreasing detector sensitivity. Therefore, a compromise must be reached between x-ray stopping power and achievable spatial resolution.
Microstructured scintillation screens based on CsI:Tl were developed to meet the main imaging needs of x-ray systems, namely, the increase in x-ray stopping power while maintaining good spatial resolution.
The manufacturing process of this type of scintillation screen is based on the deposition by thermal evaporation of long, thin, needle-shaped structures on a glass or plastic support or directly on top of the semiconductor light detectors. Each of the needle-shaped structures behaves as a light pipe, confining optical photons inside it and thus avoiding most of the lateral scattering present in nonstructured screens (Figure 5.3). This light confinement makes it possible to increase the thickness of the scintillation screen (up to 1–2 mm), while maintaining good spatial resolution. Furthermore, light production, needle stability and shape, and resolution of the scintillator screen are highly dependent on manufacturing conditions [35], namely, thallium concentration, pressure, temperature, and post-processing.

FIGURE 5.3
Simplified light transport in a granular nonstructured scintillator screen (a) and in a microco-lumnar structured scintillator screen (b).
The scintillator needle layer can be deposited directly on the semiconductor detector surface without degrading the properties of the photodetector elements in the array, thus achieving optimal spatial resolution and high x-ray detection efficiency, as optical coupling agents are not necessary to glue the scintillator screen over the semiconductor surface. Besides the aforementioned advantages of this kind of scintillator, the light production per photon stopped of CsI:Tl is among the highest known, and the peak of the emitted spectrum is at 550 nm, a value that matches the spectral response of most semiconductor photodetectors currently used in the development of x-ray flat-panel detectors [36,37]. Due to its advantages over other scintillation materials, CsI:Tl is becoming the preferred material for the x-ray photon conversion stage in flat-panel detectors. However, it does have certain drawbacks, the most important being its relatively slow response time, as compared to that of Gd2O2S:Tb.
5.3.1.2 Secondary Quanta Detection and Read-Out
Secondary quanta conversion and data read-out in indirect flat-panel x-ray detectors have traditionally been implemented as a pixel array based on hydrogenated amorphous silicon (aSi:H) and thin-film transistor (TFT) technology. Each pixel consists of a reverse-biased photodiode and a TFT that acts as a switch. During exposure, charges are accumulated in the photodiode. After exposure, a gate pulse is generated for each row of pixels, thus switching the TFT of the given row of pixels to release the accumulated charges through the data line. The released charges are amplified and converted into a voltage using an array of charge-integrating amplifiers, with one amplifier per pixel in the row. The voltage signals from the row of pixels are then multiplexed and digitized.
The technology described has mainly been used for digital radiography detectors; however, devices using this technology show a long signal decay time and a poor fill factor due to the wide electrode width and switch size [36]. These drawbacks impair the development of sensors with an appropriate frame rate and small pixel size, thus hampering the use of this technology for micro-CT image acquisition.
A newer technology for the read-out of indirect x-ray flat-panel detectors consists of sensors based on CMOS technology. CMOS image sensors are composed of a matrix of identical pixels which have a photodiode and a MOS switch transistor [37], two scan circuits which address the different rows and columns of the sensor matrix, and an output amplifier.
The image formation process for the simplest CMOS image sensor, based on passive pixel elements, is quite similar to that of the pixel array based on aSi:H and TFT technology. First, the photodiodes are reverse biased. The incoming photons cause a decrease in the voltage of the photodiode, which is measured at the end of the imaging process. The drop in voltage gives an estimation of the number of photons that have reached the given pixel. After the pixel reading, the photodiode is reset.
Current CMOS sensors use more sophisticated pixel designs, where every pixel has an active element that acts as an individual amplifier, thus reducing the noise level of the final image. Improvements in active pixel design have led to the development of the pinned photodiode pixel, which is in use for most current CMOS image sensors. In this kind of sensor, two measurements are taken and subtracted for each image pixel (correlated double sampling, CDS). The first contains information about the number of photons reaching the pixel, while the second gives an estimation of the photodiode offset voltage. This kind of design allows a further reduction of the noise level and dark current of the detector. A sketch of a CMOS sensor with active pixels and CDS circuits is shown in Figure 5.4.

FIGURE 5.4
Sketch of a typical CMOS image sensor with active pixels and CDS.
5.3.2 Direct Conversion Flat-Panel Detectors
5.3.2.1 X-Ray Conversion Stage
The detection of x-ray photons to generate secondary quanta in a direct conversion flat-panel detector consists of a layer of photoconductor material. Unlike indirect conversion detectors, the secondary quanta generated are already electric charges, thus avoiding the need for an intermediate stage to convert the secondary quanta into electric charges.
The process by which electric charges are generated from stopped x-ray photons is the same for all photoconductor materials. Stopped x-rays with sufficient energy generate an electron-hole pair that drifts through the photo-conductor material under the action of an externally applied electrical field. Each portion of the photoconductor layer that defines a pixel has a capacitor, which accumulates the charge generated by the stopped x-rays inside the current pixel. This accumulated charge is later measured and converted to form a pixel of the final image.
The photoconductor materials used to detect x-ray photons should be as efficient as possible in the conversion of x-ray photons to electric charges. Conversion efficiency depends on several factors associated with the photoconductor material, its manufacturing process, and the operating conditions. The main factors affecting sensor efficiency are x-ray stopping power, the number of electric charges generated from the absorbed radiation, and the number of electric charges that reach the end of the photoconductor layer and can be collected by the capacitive elements [20,26].
X-ray stopping power (i.e., the number of x-ray photons stopped) is highly associated with the density of the photoconductor material, its atomic number, and the energy of the incident photons. Materials with a high density and atomic number have a larger absorption coefficient and stop more x-ray photons. Thus, photoconductor materials for x-ray flat-panel detectors should be dense and made of elements with a high atomic number.
The number of electric charges generated from the stopped radiation depends on the energy necessary to create an electron–hole pair in the photoconductor material, that is, the ionization energy. Low ionization energy is highly desirable when attempting to generate a high number of electric charges from the incident radiation. The charge generated [26] is given by expression (5.1)
where
Q stands for the generated electric charge
e is the charge of the electron
E is the energy of the incoming radiation
W± is the ionization energy of the photoconductor
The ionization energy depends on the energy bandgap (Eg) of the material used and, in some cases, it can be modified by means of an electric field. One of the materials that allow its W± value to be modified by applying an electric field is amorphous selenium (a-Se), the material most widely used in the development of x-ray direct flat-panel detectors.
The fraction of the generated charge that reaches the sensor surface and can be gathered by the capacitive elements is determined by the drift mobility of the electrons and holes generated inside the photoconductor, and the mean time that electrons and holes can drift without being trapped. Taking into account the applied electric field, it is possible to define the Schubweg, which is the mean distance traveled by a charge carrier before being trapped [38] and is given by (5.2)
where
μ stands for the drift mobility of the charge carriers
τ is the mean time before being trapped
F is the applied electric field
As mentioned earlier, the most commonly used photoconductor for the development of direct x-ray flat-panel detectors is a-Se, despite the fact that pure a-Se has some undesirable properties, namely, the material is thermally unstable and crystallizes after a variable period depending on ambient conditions. To prevent crystallization and stabilize the material, some additives—usually small amounts of arsenic and a halogen (e.g., chloride)—are mixed with the original a-Se. The doped material, known as “stabilized a-Se,” is more stable, thus enabling its deposition as flat screens. However, doping with a-Se can worsen the performance of the photoconductor screen. The most important drawback is the decrease in carrier mobility, which, in turn, increases the number of trapped carriers. The increase in the number of trapped carriers causes image lag and a decrease in sensor sensitivity that hamper the use of this kind of detector for the acquisition of micro-CT images. Both these effects are caused by the delayed freeing of carriers trapped during previous x-ray exposures. The image correction procedures applied to the acquired projections (see below) assume that every projection image is acquired under approximately the same conditions (dark current and x-ray conversion effi-ciency). Image lag prevents fulfillment of these requirements, thus leading to inconsistent datasets when image correction is performed using a correction dataset acquired before the actual acquisition process. This problem can be solved by using several correction datasets acquired during the CT image acquisition, albeit at the cost of increasing acquisition time and dose delivered.
Recent developments point to CdTe (and CdZnTe) as a photoconductor material for stopping x-ray radiation. However, in most cases, development is at an early stage and there are few manufactured devices (mainly for dental and industrial radiography).
Early studies on the properties of these photoconductor materials conclude that the sensitivity of a sensor based on CdTe or CdZnTe can be up to four times higher than that achieved using a-Se–based sensors [39], but they also show a strong afterglow effect [40] and poor spatial resolution [39].
Recent developments show a reduction in the afterglow and better resolution while maintaining the predicted enhancement in sensitivity. There is also a high correlation between the design of the contacts deposited over each of the material surfaces and the amount of dark current present in the detector that degrades the performance of the device, especially the achievable energy resolution [41,42]. Depending on the design of the contact plates, there are two main detector types: Ohmic detectors and Schottky detectors [41,43]. Ohmic detectors have two contacts made of platinum, while in Schottky detectors one of the contacts is made of titanium and indium, thus forming a Schottky contact that reduces the injection of holes for the same voltage bias, thus reducing the dark current of the device. The main drawback of Schottky contacts is the so-called polarization effect, which consists of a very slow increase in the number of holes trapped near the positive electron [44]. This trapping effect leads to a decrease in sensitivity and in the charge collected per detected photon [45]. There are several ways to overcome this phenomenon, the simplest and most common being to reset the bias voltage when the effect is noticeable (about 60 min after the bias voltage is applied, for modern devices) [41,42].
5.3.2.2 Signal Read-Out
In detectors based on a-Se screens, the electric charges generated within the photoconductor are gathered by capacitive elements connected to TFTs that act as switches. The reading process is almost identical to the one used for indirect x-ray flat-panel detectors based on a-Si:H and TFT technology. Each row of pixels is addressed using a pulse that activates the TFTs of the desired pixel row, and the signal accumulated at each pixel in the row is read and converted into a voltage. This voltage is multiplexed with the rest of the voltages coming from the different pixels in the row and the values are digitized, thus forming the image. The process is performed for every row of pixels in the sensor.
For CdTe and CdZnTe detectors, the read-out matrix is generally implemented using a CMOS or TFT application-specific integrated circuit (ASIC), although in this case, the photoconductor cannot be directly deposited over the ASIC; therefore, the ASIC is built separately and at a later stage, and the crystal is placed on top of the read-out circuit. Both are connected by flip-chip bonding using a conductive resin.
5.4 Design of an X-Ray Micro-CT System
5.4.1 Components of a Small-Animal Micro-CT System
The main components of a micro-CT system based on flat-panel detectors are the x-ray detector and the microfocus x-ray source. The constraints imposed by the application determine the type of flat-panel detector chosen by the designer.
In small-animal micro-CT systems, it is important to use a detector with an appropriate image resolution to obtain the high-quality images necessary for preclinical applications. The maximum pixel size and minimum resolution of the detector depend on the geometrical configuration of the system (see later). High sensitivity and low noise level are also highly desirable features when attempting to minimize the radiation delivered.
The output of the x-ray tube must be stable enough to ensure a constant radiation level during the acquisition process. Its focal spot size must be sufficiently small so as not to degrade system resolution. The maximum admissible size for the focal spot is determined by the detector pixel size and the geometrical configuration of the system. Furthermore, highly stable motor-ized devices are used in the design of small-animal micro-CT systems to place the animal within the FOV and to perform the rotational movement of the x-ray source–detector assembly around the sample. Finally, control components (e.g., computer; motion control drivers; shutter) and shield elements must be incorporated to ensure simple and safe operation.
This section summarizes the main elements of a commercial state-of-the-art in vivo micro-CT system, the Argus PET/CT (Sedecal, Madrid, Spain).
5.4.1.1 System Components
A complete description of the different components included in the design of the micro-CT system used as an example in this section can be found in [15].
The scanner design includes a computer that controls the microfocus x-ray tube and the CMOS flat-panel detector, both of which are assembled in a common rotating gantry. A linear motion stage is used to displace the sample along the FOV, thus enabling the tomograph to perform whole body scans (Figure 5.5). The assembly is enclosed in a radiation-shielded cabinet with openings for animal positioning, anesthesia gas lines, and physiological monitoring cables.

FIGURE 5.5
Small-animal CT prototype showing its components attached to the rotating gantry: microfo-cus cone-beam x-ray tube (bottom), object bed (center), and CMOS digital imaging sensor (top). The radiation shielding cabinet is not shown.
The computer synchronizes the gantry motions with the image integration in the detector. The data acquired from each angular position are captured by a digital frame grabber. Raw data are processed simultaneously with the acquisition, thus saving processing time during the subsequent reconstruction stage and taking advantage of the full potential offered by the system computer.
5.4.1.1.1 Flat-Panel Detector
The x-ray flat-panel detector used in the Argus PET/CT is the C7940DK-02 model (Figure 5.6) from Hamamatsu Photonics K.K. (Hamamatsu-city, Japan). A complete description and an evaluation of some of the performance parameters can be found in [36]. This is an indirect flat-panel detector based on a CsI:Tl scintillator screen and a high-fill-factor CMOS image sensor to detect the optical photons. The features of the flat-panel detector as reported by the manufacturer are summarized in Table 5.1.
The scintillator layer of the flat-panel detector consists of a matrix of 150-μm long, needle-like CsI:Tl crystal structures directly deposited over the CMOS photodiode matrix surface (Figure 5.6). A photodiode matrix with active pixel elements connected to CMOS transistor switches enables detection and read-out of the visible photons generated on the scintillation screen. The photodiode CMOS matrix has 2 × 2 and 4 × 4 binning capabilities and a high fill-factor (79%). The on-chip signal amplification channels have a low noise level, and an offset suppression circuit based on CDS is assigned to each of these channels. This design achieves a high degree of image uniformity and a low noise level. However, correction tasks must be performed after acquisition of an image in order to obtain the best achievable quality. In addition to the noise-reduction stages, every pixel in the matrix implements an overflow drain function to avoid possible blooming.

FIGURE 5.6
Hamamatsu C7940DK-02 x-ray flat-panel detector (a) and detail of the needle-like CsI:Tl crystal structures on the scintillator layer (b). (Images courtesy of Hamamatsu Photonics K.K., France, Germany.)
TABLE 5.1
X-Ray Flat-Panel Detector Features

5.4.1.1.2 X-Ray Source
The scanner uses the XTG5011 Apogee microfocus x-ray source (Oxford Instruments, Scotts Valley, CA, USA). This tube has a stationary tungsten anode, a 127-μm-thick beryllium window, and a Gaussian-like focal spot measuring 46.5 × 49.1 μm, according to the manufacturer's measurements. The tube also has a maximum anode power of 75 W, limited to 50 W by the high-voltage power supply (50 kV for an anode current of 1 mA).
The working settings for this component (i.e., anode current and voltage) are managed by the control computer through an I2C interface. To reduce the radiated dose during scans and the presence of artifacts arising from the polychromatic properties of the generated x-ray beam (e.g., beam hardening), two different elements have been added to the source output window:
A tungsten shutter to block the x-ray beam during the intervals in which the detector is not integrating a valid image, that is, when the gantry is moving. This shutter has a maximum operating frequency of 10 Hz and a minimum opening time of 20 ms. The nominal beam extinction ratio increases to 104 for a maximum beam energy of 30 keV, as stated by the manufacturer. Practical measurements of the beam extinction fraction for the particular settings of the current system (40 keV, 200 μA) reveal a ratio of 1:4•103; therefore, exposure to radiation could be considered negligible when the shutter is closed.
An aluminum filter (thickness ranging from 0.1 to 2 mm) to filter the low-energy region of the emission spectrum, thus improving beam monochromaticity and reducing superficial dose and image artifacts.
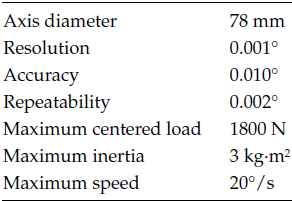
TABLE 5.2
Rotation Stage Features
Minimal beam collimation is performed using a lead collimator, since most of the x-ray cone beam is used for imaging.
5.4.1.1.3 Mechanical Subsystem
The x-ray source, with its associated elements, and the flat-panel detector are placed on a circular aluminum plate fixed to a rotational motion stage. The projection dataset to be reconstructed is acquired by rotating the whole set 180° or 360° around the subject. The gantry stage is driven by a controller and a stepper motor. The main features of the rotational stage are shown in Table 5.2.
The system is provided with a linear motion stage to place the sample into the x-ray beam during the acquisition process. The sample is placed on a carbon-fiber bed with the appropriate dimensions for small animals (rats and mice). The carbon-fiber structure is attached to the linear motion stage using a metallic holder, which incorporates controls to adjust the height and lateral shift of the animal bed.
The whole mechanical system is controlled by the control computer, which interfaces with the stepper motors using motor controller circuits. These are enclosed in an electronic box containing the auxiliary electronic systems for the interlock that prevents accidental radiation leakages due to incorrect operation of the radiation-shielded cabinet elements.
5.4.2 Geometrical Configuration
Small-animal micro-CT systems based on cone-beam geometry should accomplish two basic design criteria: the resolution of the reconstructed data has to be high enough to image anatomical structures with the appropriate level of detail (∼100 μm), and the transaxial FOV has to be large enough for small laboratory rodents (about 75 mm in diameter). The distances from the source to the object (Dso) and from the object to the detector (Dod) determine the size of the FOV and the magnification factor, according to the following expressions [1,46,47]
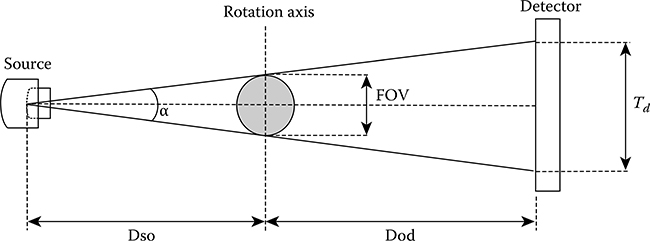
FIGURE 5.7
Geometry of the micro-CT system. Td refers to the usable size of the x-ray CMOS detector.
where
Td is the size of the flat-panel detector active area
M is the magnification factor
The useful FOV is defined as the length of the rotation axis intersected by the effective cone-beam (Figure 5.7); the “effective” section of the cone-beam is that which intersects the active area of the detector.
In order to assess the suitability of the design parameters, the theoretical system resolution can be estimated as the convolution of the effects of the finite focal spot size in the source (ρf) and the intrinsic resolution of the detector (ρd) [47].
The component of system resolution due to the detector (θd) can be calculated at the center of the FOV using the following expression:
If ρf is the focal spot size of the source, then θf at the center of the FOV is
Assuming a Gaussian distribution for θf and θd, the resulting resolution for the reconstructed images can be estimated theoretically according to the formula
System resolution could be degraded by other factors associated with the tomographic reconstruction process and by submillimetric mechanical misalignments. Correct alignment between source and detector is critical to achieve the theoretical resolution value and avoid the presence of artifacts in the reconstructed image [48]. There are several suitable methods of experimentally estimating the differences between the geometrical parameters of the real system and those of the original design [49–52]. These methods are usually based on the acquisition of a phantom with a known geometry whose projection trajectories are fitted to the theoretical trajectories (derived from the ideal geometrical arrangement) in order to calculate the deviation between the real and the theoretical configuration parameters.
The geometrical parameters of the micro-CT subsystem of the Argus PET/CT (Dso = 219.8 mm and Dod = 131.9 mm, α = 19.4°, Td = 120 mm) were selected to meet the design constraints, namely, resolution, FOV size, and available space). The adopted solution leads to a magnification factor (M) of 1.6 and to a theoretical resolution of 12 cycles/mm (measured as the modulation transfer function [MTF] 10%), or about 40 μm in the spatial domain.
In this system, the geometrical deviation from the original design is measured by means of an analytical procedure based on the assessment of the elliptical trajectories shown by two ball bearings placed in a soft material, such as foam, as described in [51]. Using this method it is possible to estimate the values of two of the three tilt angles of the detector, the position of the real center for the image (i.e., the projection pixel for the central and orthogonal ray), and the actual distance between the x-ray source and the flat-panel detector. The remaining angle, although not as critical as the previous two [51,53,54], should first be reduced as much as possible to be able to assume that its value is close to zero. The correct alignment in the direction of this angle is mechanically assessed. The estimated angular deviations are mechanically corrected. The offset of the central ray position is corrected online during the acquisition process.
5.4.3 Data Acquisition
Several acquisition schemes make it possible to obtain the projection data for the different angular positions. There are two main trends for the acquisition of micro-CT data. Some devices use a continuous rotation acquisition protocol, where a moving gantry performs a continuous motion while projection data are acquired. This approach has the advantage of faster acquisition times when a fast detector is used, although the effects of image lag and mechanical imperfections are more conspicuous. An alternative is the acquisition of a stack of frames for each angular projection, with the gantry steady during the acquisition (step-and-shoot). While the gantry rotates, no image is acquired and the radiation beam is blocked to minimize the effect of image lag.
The step-and-shoot approach used in the Argus PET/CT system is implemented by means of an event-driven finite-state machine with two possible states to take advantage of the maximum detector transfer rate [55] and to reduce acquisition time and delivered dose. The first state (step) is used to move the gantry to the next angular position and, if needed, to save data from RAM memory to disk. The second (shoot) performs two tasks:

FIGURE 5.8
High-speed acquisition protocol. TVC stands for the integration period in the detector and T1 represents the time elapsed between triggering of an image acquisition and storage of already processed images in RAM before they can be saved to disk. The state transitions are shown in the last row of the chronogram, and the gray rectangle indicates the time spent by the acquisition software to process the dataset acquired in the previous gantry position.
Launching the acquisition of either a single frame or a frame sequence in the current angular position
Processing the dataset acquired in the previous gantry position
The transition between states is triggered in synchrony with the detector integration period (TVC), as shown in Figure 5.8.
The processing tasks necessary to generate a projection image are performed online during the shoot state. The correction procedures are explained in the following section.
Quality of the projection images can be improved by acquiring and averaging several frames per angular position. In this case, the finite-state machine remains in shoot state for a time equal to TVC*N, where N is the desired number of frames, until the last frame of the current projection arrives. Therefore, in the multiframe case, there are several “state 1” periods between two “state 2” periods. Additional pre-reconstruction processing, such as filtering, can be performed during “state 1” intervals, when the CPU is idling.
If the sample is too large to fit inside a single axial FOV, the whole volume can be acquired by performing rotations combined with axial shifts of the bed. From the parameters of the detector and the requirements of the given acquisition, it is possible to calculate the time taken by the acquisition process. This effective acquisition time (excluding warm-up and sample positioning) is given (in seconds) by the following expression:
where
FR is the frame rate from the detector in images per second
Avimg is the number of averaged frames per projection image
Nloss is the number of frames lost due to the motion of the rotating stage per each angular projection (one in the current implementation)
Np is the number of angular views acquired over the defined gantry rotation span
NFOV is the number of axial bed positions
These parameters can be balanced to configure different acquisition protocols: for example, one option could be a high-speed, low-resolution, and low-dose scan, or alternatively a slower, high-resolution, and high-dose scan. In each case, exposure time is controlled by synchronizing the gantry rotation and shutter with the master timing from the frame grabber.
5.4.3.1 Online Correction of Raw Data
Most of the corrections to be applied to the projections can be performed online during the acquisition process, thus reducing processing time for tomographic image reconstruction.
First, despite the offset subtraction performed by the CDS circuit, every pixel has a slight offset level that must be cancelled to obtain optimal image quality. To estimate this offset level, it is necessary to acquire an image with no x-ray radiation reaching the detector (dark current image) at the same temperature and with the same binning configuration as that used for tomographic data acquisition.
After offset correction, the spatial variation of pixel sensitivity must be reduced. Pixel response can be equalized by acquiring an image with a homogeneous radiation field and no object between the x-ray source and the detector (flood-field image). Again, the acquisition setting must match the one planned for the subsequent tomographic acquisition. To calculate the equal-ized image, the offset corrected image is divided by the flood-field image, thus providing a flat sensitivity profile across the image pixels.
Once the image is equalized, a further correction must be performed to obtain a projection dataset free of artifacts. Due to the CMOS manufacturing process, some lines, columns, or single pixels of the pixel matrix (usually called “dead elements”) do not show an appropriate response to the incoming radiation, thus giving a minimum or maximum signal value regardless of the radiation intensity. The correction is performed by linear interpolation of the value given by the adjacent elements of the detector.
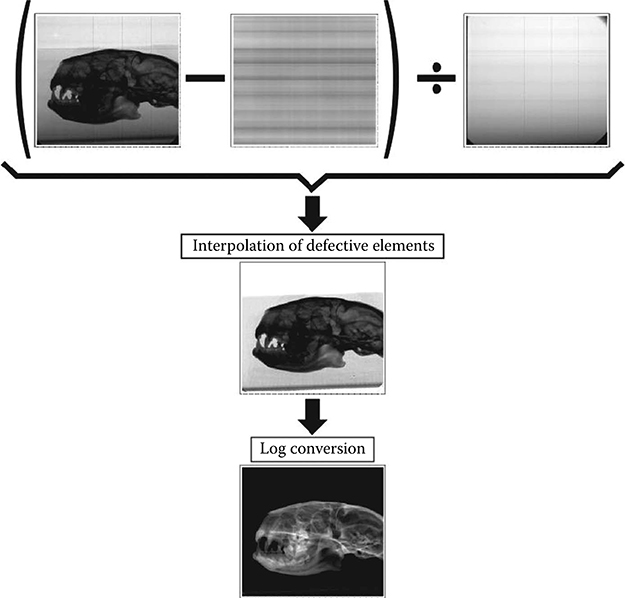
FIGURE 5.9
Raw image correction stages.
Finally, the attenuation image is generated by calculating the logarithm of the corrected projection image [56].
The different correction steps, as well as their effect on the image, are shown in Figure 5.9.
5.4.4 Tomographic Image Reconstruction
Data obtained by cone-beam micro-CT systems with a circular orbit do not fulfill Tuy's condition, which is required to guarantee consistency in an analytical reconstruction [57]. Therefore, to obtain the reconstructed volume, it is necessary to use approximated algorithms derived from filtered backprojection (FBP)—such as the one proposed by Feldkamp, Davis, and Kress, known as FDK, first described in [58]—or iterative approaches. Approximated algorithms reconstruct the image by performing a modified FBP that minimizes the effects of the inconsistency of acquired data. Iterative and statistical algorithms, on the other hand, are intrinsically able to deal with data inconsistency. Iterative algebraic algorithms, such as the algebraic reconstruction technique (ART) [59], model the reconstruction problem as a set of algebraic equations and solve the inverse problem to obtain the attenuation value for each voxel in the reconstructed volume. One special category of iterative reconstruction methods includes those based on a statistical treatment of acquired data. These techniques treat the reconstruction as a statistical estimation problem and model the noise properties of the acquired data, achieving the best results when the original data are very noisy (e.g., at low radiation doses).
Statistical methods are now the preferred reconstruction strategy in other biomedical imaging techniques such as PET or SPECT. However, these methods present a much larger computational burden than the analytical algorithms; therefore, FDK-based methods are the preferred reconstruction technique for cone-beam micro-CT [9].
In order to provide consistent attenuation values for different materials, regardless of the scanner settings used in the experiment, the resulting volumetric data are usually represented in Hounsfield units (HU), which relate the attenuation of the different materials with that of water and are not affected by the spectral properties of the x-ray beam [18]. The conversion into HU requires a previous calibration step for different spectral configurations using several materials with a known HU value.
In the Argus PET/CT, reconstruction is performed by means of a modified FDK algorithm with a Ram-Lak filter. The algorithm is adapted to the specific geometry of the scanner, and includes beam hardening correction and HU calibration, using a phantom with seven different known materials (air, water, PMMA, Nylon, Delrin, PTFE, and aluminum). The calibration parameters are obtained for four standard settings of the x-ray beam. The reconstruction software, together with the real-time preprocessing during acquisition, achieves reasonable reconstruction times on standard personal computers (100 s to reconstruct a 5123 voxels volume using a 2.80 GHz dual core CPU with 8 GB of RAM).
5.5 Evaluation of Micro-CT Systems
An evaluation of small-animal micro-CT performance enables us to determine the quality of the projection images and reconstructed data and to estimate the dose received by the sample.
The following sections present different techniques to evaluate the performance of small-animal micro-CT systems, based on the results obtained for the Argus PET/CT. A complete description of these results can be found in [15].
5.5.1 X-Ray Flat-Panel Detector
The features that give flat-panel detectors a greater impact on the quality of the final images are temporal stability, gain linearity, noise level, and resolution. Temporal instability increases artifacts introduced by the detector, and gain linearity affects the accuracy of tomographic image quantification and introduces ring artifacts. The noise level of the projection data is translated into noise in the reconstructed images, and the intrinsic resolution of the detector limits the final resolution that the system can achieve, as shown in Equations 3.5 through 3.7. Detective quantum efficiency for this type of detector has been evaluated in [12,60].
A possible protocol for the measurement of the different parameters and the results obtained for the C7940DK-02 are provided in the following.
Detector stability
One way to estimate the temporal stability of the detector involves acquisition of a set of flood-field images over a given period of time for a fixed x-ray source setting. Between consecutive acquisitions, the x-ray beam must be stopped to allow for scintillation decay in order to remove any potential afterglow contamination on the next measurement. The stability of the device can be assessed by plotting the mean pixel value as a function of time.
To illustrate this procedure using the CA7940DK-02 system, 360 consecutive flood-field images were acquired at 30 kV and 0.4 μA, with no object between the source and the detector. Exposures were separated by 10-s intervals.
Measurements show a peak-to-valley ratio during the experiment lower than 0.05% of the mean pixel value. This result indicates that the flat-panel detector is stable enough and the reconstructed images will not be affected by this parameter.
Detector gain linearity
The linearity of the detector response with the radiation received can be measured by plotting the mean pixel value as a function of the anode current. Since radiation intensity is directly proportional to the anode current [61], a linear trend is expected for the mean pixel value. For the test carried out on the C7940DK-02 system, the x-ray beam peak energy was set at 40 kV, with anode current ranging from 200 to 500 μA. A 1-mm-thick aluminum filter was placed in front of the x-ray source to reproduce a set-up commonly used for CT acquisition. The images were acquired with a homogeneous radiation field and no object between the x-ray source and detector. The result of the test shows an excellent degree of linearity (R2 > 0.99) over the dynamic range of the detector.
Detector noise level
The noise level in the acquired projection data has a considerable impact on the final achievable quality. It can be measured by the signal-to-noise ratio (SNR) of a set of flood-field images as a function of the anode current.
The SNR was measured as a function of anode current for the C7940DK-02. As in the previous measurement, peak x-ray beam energy was set at 40 kV, with anode current ranging from 200 to 500 μA and a 1-mm-thick aluminum filter. The trend observed was as expected.
Detector spatial resolution
The resolution of x-ray imaging detectors is usually expressed in terms of the presampled MTF. This describes the signal transfer characteristics as a function of spatial frequency, taking into account all the detection stages except sampling. If the sampling stage is included in the calculation, the detector spatial response may become undersampled, leading to aliasing errors in the estimated MTF.
Among the different methods proposed to estimate the presampled MTF, those based on imaging a slanted slit or a slanted edge are the most widely used due to their relatively easy implementation and accurate results.
The following paragraphs present a brief description of the procedure proposed in [62,63], which implements a variation of the slanted-edge method. A comprehensive review of the different versions of the slanted-edge approach can be found in [64]. The selected algorithm is based on the analysis of the edge response function (ERF), which is obtained by imaging a phantom consisting of an x-ray-opaque object with a polished edge. The phantom is placed directly over the detector surface at a shallow angle (1.5°–3°) with respect to the pixel matrix. The edge position is estimated with sub-pixel accuracy in the image area by using linear interpolation. This position is then fitted to a straight line by linear regression.
The slope of this line is used to determine the number of rows (NAV) necessary for a 1-pixel lateral shift of the edge position in the original image (Figure 5.10).
The algorithm generates an oversampled ERF using the pixel value at the edge position for NAV consecutive rows. As depicted in Figure 5.10, the value of the pixel on the first row (triangle mark) corresponds to the first data point of the ERF. Then, the pixel value on the second row (square mark) yields the second data point and so on. Finally, the pixel value of the NAVth row (fifth row in Figure 5.10) is the last data point of the ERF.
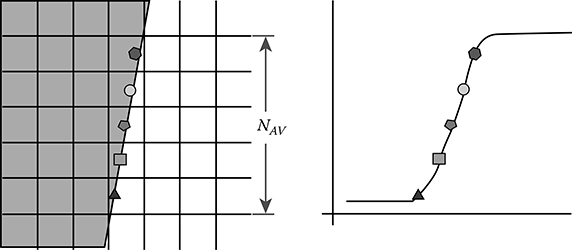
FIGURE 5.10
Estimation of the oversampled ERF from the slanted-edge images.
The detector area is split up into groups of NAV rows, and oversampled ERFs are estimated for each of the groups according to the process explained.
These calculated ERFs are then aligned by linear regression and averaged in order to reduce noise.
The line spread function (LSF) is estimated as the 3-point derivative of the average ERF. Finally, an estimation of the MTF is obtained as the Fourier transform (FT) of the LSF. The calculated estimation is corrected for the sinc function introduced by the derivative operation, and the frequency axis is corrected for the slant angle. The result is an accurate estimation of the presampled MTF.
Another interesting parameter is the effective MTF of the system that reflects the combined effect of the detector and the finite focal spot size of the source. This can be obtained by imaging the same phantom at nominal system magnification [46] and estimating the actual resolution of the projection data of a sample placed at the center of rotation of the micro-CT system. Figure 5.11 plots the presampled MTF obtained for the flat-panel detector of the C7940DK-02. The spatial frequency where the MTF falls to 10% of the zero frequency value (MTF10%) was 8.1 lpmm, a figure compatible with the manufacturer's specifications. MTF10% measured at the nominal system magnification was 11.85 cycles/mm, almost 1.6 times the intrinsic resolution, as expected due to the magnification factor used.

FIGURE 5.11
Presampled modulation transfer function measured with a slanted-edge method.
5.5.2 Quality Evaluation of Reconstructed Images
The quality of the reconstructed images determines their utility in preclinical studies. However, in longitudinal in vivo studies, it is necessary to reach a trade-off between image quality and accumulated radiation dose, as several CT scans are usually acquired during the experiment.
The parameters that determine the quality of the final images in preclinical applications are the noise in the reconstructed image, the contrast-to-noise ratio (CNR), spatial resolution, and HU accuracy.
Various strategies are available to measure each of the aforementioned parameters. The methods presented in [15] were used to assess the Argus PET/CT, as described later.
Noise in reconstructed images was evaluated on a homogeneous water phantom by measuring the standard deviation of the signal in HU as a function of radiated dose. The phantom was acquired six times at 25 kV and 0.6 μA at different doses (different number of averaged images for each angular position).
Measured noise level decreased proportionally to the square root of the dose, as expected, according to theoretical noise models for CT images [65]. A good soft tissue contrast is achieved for a noise level below 50 HU, which corresponded to a radiated dose of 75 mGy in our system. The curve of noise level as a function of dose can be found in Figure 5.12.
Image CNR was measured as a function of radiated dose using a contrast phantom consisting of a nylon cylinder (1.15 g/cm3) immersed in a water container. CNR is defined as
where μ and σ represent, respectively, the mean and standard deviation of the pixel values in the reconstructed images corresponding to water (μw, σw) and nylon (μn, σn), obtained from regions of interest created by gray-level thresholding.
Figure 5.12 shows a plot of the CNR versus the radiated dose. CNR increases almost proportionally to the square root of the dose. The CNR obtained for a dose of 75 mGy is 0.98.
The system resolution was measured following the standard test method E1695-95 [66], which is based on the examination of the CT image of a uniform disk of polycarbonate (1.18 g/cm3) (Figure 5.13). The resolution value is derived from an analysis of the edge of the disk; in other words, the ERF is obtained and the LSF and MTF are calculated. The cut-off point where the MTF decreases below 10% of its maximum value is given as the standard resolution measurement.

FIGURE 5.12
Noise level (standard deviation) in Hounsfield units measured and estimated using the Gaussian model and measured CNR as a function of radiated dose.
In the Argus PET/CT, the MTF at 10% was 11.3 cycles/mm, or 44 μm in the spatial domain (Figure 5.13). The difference between the actual resolution obtained from the reconstructed images and the resolution measured in projection data is due to the reconstruction process and to possible submil-limetric misalignments [51].
The accuracy of the HU values has been assessed with the calibration phantom previously described. The phantom was previously imaged using a properly calibrated clinical CT scanner (Toshiba Aquillion 16) for two x-ray peak energy settings. The values obtained for each of the materials on the phantom were averaged over the whole area covered by them.
The same values were obtained from a third acquisition of the phantom with the small-animal micro-CT system.
Finally, the values obtained by both scanners were compared, assuming those measured by the clinical system as the gold standard.
The results of the cross-validation of the HU conversion are shown in Table 5.3. The data obtained by the micro-CT agree to a large extent with those provided by the clinical scanner, thus proving the accuracy of the HU conversion. It can be noticed that there is a strong deviation for very dense materials such as metals, due to the low peak energy of the spectra generated by the microfocus x-ray source.

FIGURE 5.13
Modulation transfer function after tomographic reconstruction calculated using the standard protocol E1695-95. In the upper right corner of the plot, a transaxial image of the polycarbonate disk used is shown.
TABLE 5.3
Hounsfield Units Evaluation Results

5.5.3 Radiation Dose
Another important consideration in the design of in vivo micro-CT systems is the dose delivered to the animal. Therefore, it is necessary to provide software and hardware tools to allow the user to select the best settings for each application. Of particular importance is the resolution setting, because, if the image resolution is doubled for a given x-ray setting, voxel noise increases 4 times and the dose has to increase 16 times to maintain the same SNR [67]. For this reason, special care must be taken with x-ray settings for ultra-high-resolution protocols.
TABLE 5.4
X-Ray Settings and Radiation Dose for Acquisition Protocols
Voltage (kV) |
Current (μA) |
Time |
Resolution (μm) |
Radiation Dose (mGy) |
25 |
600 |
6′00″ |
200 |
33.73 |
40 |
750 |
6′30″ |
100 |
165.2 |
The measurement of absorbed dose may provide a more reliable assessment of in vivo biological effects than that offered by the incident radiation measurements. In the example system, thermo-luminescent dosimeters (STI, TLD-100) were introduced into representative organs in euthanized rats that had undergone standard acquisition protocols.
The dose values obtained show the potential damage to the animal for different acquisition settings.
Table 5.4 shows the results and acquisition settings for two standard protocols. The first, which is intended to provide anatomical information for PET-CT studies, does not provide high spatial resolution, as PET image resolution is usually worse than 1 mm. The second protocol represents a high-resolution setting for bone tissue, which needs higher voltage and current. The radiation doses obtained (Table 5.4) were, respectively, 0.5% and 2% of the LD50/30 (∼7.3 Gy) for small rodents [67,68]. Typical results reported in the literature of delivered dose to the animal in micro-CT scans are about 100–300 mGy [69,70]. A coronal image of a large mouse using the 40 kV x-ray scan is depicted in Figure 5.14, and a maximum intensity projection image of a rat is shown in Figure 5.15.

FIGURE 5.14
Coronal slice of a large mouse whole body study. The volume was acquired in two FOV positions with a 125-μm pixel size, 360 angular projections, 8 images averaged per projection, 40-kV peak x-ray beam energy, and a 200-μA x-ray source anode current.
FIGURE 5.15
Volume render of a rat study, 3 beds and pixel size of 0.125 mm. The acquisition parameters were 40 kV, 200 μA, 360 angular projections, 0.125 mm pixel size, and eight images averaged per projection.
5.6 Conclusions
The design of in vivo micro-CT scanners for small-animal imaging must address a number of requirements that differ widely from those of other applications, such as in vitro micro-CT scanners or regular clinical CT scanners. The impacts of the detector device on the quality of the final image and on the mechanical constraints of the system make it necessary to select the most appropriate detector from the different commercially available options.
The general overview presented in this chapter should prevent designers with the basic aspects of the development of in vivo micro-CT systems. The example used was the Argus PET/CT. A complete assessment of its performance was provided, with emphasis on the detector component.
The size of commercial CMOS flat-panel detectors makes them a suitable choice for small-animal imaging, since they are more compact than CCDs, the most widely used small-animal imaging system.
State-of-the-art CMOS flat-panel detectors offer good results in terms of noise, contrast, and resolution, thus making it possible to optimize image quality in terms of the dose radiated.
When using low-power x-ray sources, one way to improve the SNR and, therefore, contrast of images in soft tissue, is to optimize exposure time. In this context, optimization of the acquisition protocol allows the designer to better exploit the features of the detector, thus improving system performance with regard to per-animal screening time.
The resolution of the reconstructed data should be in the tens-of-micrometer range in most multimodality preclinical experiments. This high-resolution value is achieved, thanks to the magnification effect inherent to the cone-beam geometry and to the detector and x-ray tube features. High resolution in vivo imaging may show slight quality degradation due to movements such as breathing or heartbeat. Gating the projection acquisition or performing retrospective gating over multiple exposures per projection [71] can help to recover this resolution loss at the cost of increased radiation dose and acquisition time. In addition, high-resolution imaging requires precise characterization of the system alignment; mechanical mis-alignments that could not be corrected have to be taken into account during the image reconstruction process, and this may prevent the use of symmetries, thus increasing reconstruction time considerably.
Equations 3.5 through 3.7 describe how the detector and source components affect the final resolution and show that the limiting factor in regular in vivo micro-CT systems is the intrinsic resolution of the detector, since the size of the finite focal spot has a negligible impact due to the magnification factor used in systems based on microfocus x-ray tubes.
References
1. M. J. Paulus, S. S. Gleason, S. J. Kennel, P. R. Hunsicker, and D. K. Johnson, High resolution X-ray computed tomography: An emerging tool for small animal cancer research, Neoplasia, 2, 62–70, 2000.
2. H. Ebina, J. Hatakeyama, M. Onodera, T. Honma, S. Kamakura, H. Shimauchi, and Y. Sasano, Micro-CT analysis of alveolar bone healing using a rat experimental model of critical-size defects, Oral Diseases, 15, 273–280, 2009.
3. N. M. Harrison, P. F. McDonnell, D. C. O'Mahoney, O. D. Kennedy, F. J. O'Brien, and P. E. McHugh, Heterogeneous linear elastic trabecular bone modelling using micro-CT attenuation data and experimentally measured heterogeneous tissue properties, Journal of Biomechanics, 41, 2589–2596, 2008.
4. J. U. Umoh, A. V. Sampaio, I. Welch, V. Pitelka, H. A. Goldberg, T. M. Underhill, and D. W. Holdsworth, In vivo micro-CT analysis of bone remodeling in a rat calvarial defect model, Physics in Medicine and Biology, 54, 2147–2161, 2009.
5. T. Engelhorn, I. Y. Eyupoglu, M. A. Schwarz, M. Karolczak, H. Bruenner, T. Struffert, W. Kalender, and A. Doerfler, In vivo micro-CT imaging of rat brain glioma: A comparison with 3 T MRI and histology, Neuroscience Letters, 458, 28–31, 2009.
6. H. Parameswaran, E. Bartolak-Suki, H. Hamakawa, A. Majumdar, P. G. Allen, and B. Suki, Three-dimensional measurement of alveolar airspace volumes in normal and emphysematous lungs using micro-CT, Journal of Applied Physiology, 107, 583–592, 2009.
7. S. C. Thacker, V. V. Nagarkar, and H. J. Liang, Characterization of a novel microCT detector for small animal computed tomogaphy (CT), Medical Imaging 2007: Physics of Medical Imaging, Pts 1–3, 6510, U1511–U1522, 2007.
8. V. V. Nagarkar, S. V. Tipnis, I. Shestakova, V. Gaysinskiy, B. Singh, M. J. Paulus, and G. Entine, A high-speed functional MicroCT detector for small animal studies, IEEE Transactions on Nuclear Science, 53, 2500–2505, 2006.
9. C. T. Badea, M. Drangova, D. W. Holdsworth, and G. A. Johnson, In vivo small-animal imaging using micro-CT and digital subtraction angiography, Physics in Medicine and Biology, 53, R319–R350, 2008.
10. A. L. Goertzen, V. Nagarkar, R. A. Street, M. J. Paulus, J. M. Boone, and S. R. Cherry, A comparison of x-ray detectors for mouse CT imaging, Physics in Medicine and Biology, 49, 5251–5265, 2004.
11. D. A. Jaffray and J. H. Siewerdsen, Cone-beam computed tomography with a flat-panel imager: Initial performance characterization, Medical Physics, 27, 1311–1323, 2000.
12. H. K. Kim, S. C. Lee, M. H. Cho, S. Y. Lee, and G. Cho, Use of a flat-panel detector for microtomography: A feasibility study for small-animal imaging, IEEE Transactions on Nuclear Science, 52, 193–198, 2005.
13. I. Fujieda, G. Cho, J. Drewery, T. Gee, T. Jing, S. N. Kaplan, V. Perezmendez, D. Wildermuth, and R. A. Street, X-Ray and charged-particle detection with Csi(Tl) layer coupled to a-Si-H photodiode layers, IEEE Transactions on Nuclear Science, 38, 255–262, 1991.
14. E. Miyata, M. Miki, N. Tawa, D. Kamiyama, and K. Miyaguchi, Development of new X-ray imaging device sensitive to 0.1–100 keV, Nuclear Instruments & Methods in Physics Research Section A-Accelerators Spectrometers Detectors and Associated Equipment, 525, 122–125, 2004.
15. J. J. Vaquero, S. Redondo, E. Lage, M. Abella, A. Sisniega, G. Tapias, M. L. S. Montenegro, and M. Desco, Assessment of a new high-performance small-animal X-ray tomograph, IEEE Transactions on Nuclear Science, 55, 898–905, 2008.
16. J. J. Vaquero, E. Lage, L. Ricon, M. Abella, E. Vicente, and M. Desco, rPET detectors design and data processing, 2005 IEEE Nuclear Science Symposium Conference Record, 1–5, 2885–2889, 2005.
17. Y. C. Wang, J. Seidel, B. M. W. Tsui, J. J. Vaquero, and M. G. Pomper, Performance evaluation of the GE healthcare eXplore VISTA dual-ring small-animal PET scanner, Journal of Nuclear Medicine, 47, 1891–1900, 2006.
18. W. A. Kalender, Computed Tomography: Fundamentals, System Technology, Image Quality, Applications, 2nd edn., Publicis Corporate Publication, Erlangen, 2005.
19. D. Okkalides, Contrast reduction in digital images due to x-ray induced damage to a TV camera's CCD image receptor, Physics in Medicine and Biology, 44, N63–N68, 1999.
20. H. K. Kim, I. A. Cunningham, Z. Yin, and G. Cho, On the development of digital radiography detectors: A review, International Journal of Precision Engineering and Manufacturing, 9, 86–100, 2008.
21. C. Frojdh, H. Graafsma, H. E. Nilsson, and C. Ponchut, Characterization of a pixellated CdTe detector with single-photon processing readout, Nuclear Instruments & Methods in Physics Research Section A-Accelerators Spectrometers Detectors and Associated Equipment, 563, 128–132, 2006.
22. K. Kowase and K. Ogawa, Photon counting X-ray CT system with a semiconductor detector, IEEE Nuclear Science Symposium Conference Record, 5, 3119–3123, 2006.
23. Y. Onishi, T. Nakashima, A. Koike, H. Morii, Y. Neo, H. Mimura, and T. Aoki, Material discriminated X-ray CT by using conventional microfocus X-ray tube and CdTe imager, 2007 IEEE Nuclear Science Symposium Conference Record, 1–11, 1170–1174, 2007.
24. J. P. Schlomka, E. Roessl, R. Dorscheid, S. Dill, G. Martens, T. Istel, C. Baumer, C. Herrmann, R. Steadman, G. Zeitler, A. Livne, and R. Proksa, Experimental feasibility of multi-energy photon-counting K-edge imaging in pre-clinical computed tomography, Physics in Medicine and Biology, 53, 4031–4047, 2008.
25. W. A. Kalender and Y. Kyriakou, Flat-detector computed tomography (FD-CT), European Radiology, 17, 2767–2779, 2007.
26. S. O. Kasap, M. Z. Kabir, and J. A. Rowlands, Recent advances in X-ray photo-conductors for direct conversion X-ray image detectors, Current Applied Physics, 6, 288–292, 2006.
27. J. Yorkston, Recent developments in digital radiography detectors, Nuclear Instruments & Methods in Physics Research Section A-Accelerators Spectrometers Detectors and Associated Equipment, 580, 974–985, 2007.
28. T. Gomi, K. Koshida, T. Miyati, J. Miyagawa, and H. Hirano, An experimental comparison of flat-panel detector performance for direct and indirect systems (initial experiences and physical evaluation), Journal of Digital Imaging, 19, 362–370, 2006.
29. G. Hajdok, J. J. Battista, and I. A. Cunningham, Fundamental X-ray interaction limits in diagnostic imaging detectors: Spatial resolution, Medical Physics, 35, 3180–3193, 2008.
30. G. Hajdok, J. J. Battista, and I. A. Cunningham, Fundamental X-ray interaction limits in diagnostic imaging detectors: Frequency-dependent Swank noise, Medical Physics, 35, 3194–3204, 2008.
31. G. Hajdok, J. Yao, J. J. Battista, and I. A. Cunningham, Signal and noise transfer properties of photoelectric interactions in diagnostic X-ray imaging detectors, Medical Physics, 33, 3601–3620, 2006.
32. H. K. Kim, S. M. Yun, J. S. Ko, G. Cho, and T. Graeve, Cascade modeling of pixelated scintillator detectors for X-ray imaging, IEEE Transactions on Nuclear Science, 55, 1357–1366, 2008.
33. G. F. Knoll, Radiation Detection and Measurement John Wiley & Sons, New York, 2000.
34. M. Nikl, Scintillation detectors for X-rays, Measurement Science & Technology, 17, R37–R54, 2006.
35. B. K. Cha, J. H. Shin, J. H. Bae, C. H. Lee, S. H. Chang, H. K. Kim, C. K. Kim, and G. Cho, Scintillation characteristics and imaging performance of CsI:Tl thin films for X-ray imaging applications, Nuclear Instruments & Methods in Physics Research Section a-Accelerators Spectrometers Detectors and Associated Equipment, 604, 224–228, 2009.
36. H. Mori, R. Kyuushima, K. Fujita, and M. Honda, High resolution and high sensitivity CMOS PANEL SENSORS for X-ray, 2001 IEEE Nuclear Science Symposium, Conference Records, 1–4, 29–33, 2002.
37. A. Theuwissen, CMOS image sensors: State-of-the-art and future perspectives, ESSDERC 2007: Proceedings of the 37th European Solid-State Device Research Conference, 21–27, Munich, 2007.
38. J. A. Rowlands and J. Yorkston, Flat panel detectors for digital radiography, in Handbook of Medical Imaging. Vol. 1, J. Beutel (eds.), SPIE Press, Bellingham, WA, 2000, pp. 223–328.
39. Y. Izumi, O. Teranuma, T. Sato, K. Uehara, H. Okada, S. Tokuda, and T. Sato. (2001, 2009). Development of flat-panel X-ray image sensors. Sharp Technical Journal 3. Available: http://sharp-world.com/corporate/info/rd/tj3/3-6.html
40. S. Ricq, F. Glasser, and M. Garcin, Study of CdTe and CdZnTe detectors for X-ray computed tomography, in 11th International Workshop on Room-Temperature Semiconductor X- and Gamma-Ray Detectors and Associated Electronics, Vienna, Austria, 1999, pp. 534–543.
41. M. Funaki, Y. Ando, R. Jinnai, A. Tachibana, and R. Ohno. Development of CdTe detectors in Acrorad, International Workshop on Semiconductor PET, 2007. Available: http://www.acrorad.co.jp/_skin/pdf/Development_of_CdTe_detectors.pdf
42. M. Tamaki, Y. Mito, Y. Shuto, T. Kiyuna, M. Yamamoto, K. Sagae, T. Kina, T. Koizumi, and R. Ohno, Development of 4-Sides buttable CdTe-ASIC hybrid module for X-ray flat panel detector, IEEE Transactions on Nuclear Science, 56, 1791–1794, 2009.
43. K. Kim, S. Cho, J. Suh, J. Won, J. Hong, and S. Kim, Schottky-type polycrystalline CdZnTe X-ray detectors, Current Applied Physics, 9, 306–310, 2009.
44. H. B. Serreze, G. Entine, R. O. Bell, and F. V. Wald, Advances in CdTe gamma-ray detectors, IEEE Transactions on Nuclear Science, 21, 404–407, 1974.
45. A. Cola and I. Farella, The polarization mechanism in CdTe Schottky detectors, Applied Physics Letters, 94, 2009, 102113.
46. S. Redondo, J. J. Vaquero, E. Lage, M. Abella, G. Tapias, A. Udias, and M. Desco, Assessment of a new CT system for small animals, in IEEE Nuclear Science Symposiun and Medical Imaging Conference, San Diego, CA, 2006.
47. E. Van de Casteele, Model-based approach for beam hardening correction and resolution measurements in microtomography, Department Natuurkunde Antwerpen, University Antwerpen, Antwerpen, 2004.
48. I. Vidal-Migallón, M. Abella, A. Sisniega, J. J. Vaquero, and M. Desco, Simulation of mechanical misalignments in a cone-beam micro-CT system, in 2008 IEEE Nuclear Science Symposium and Medical Imaging Conference, Dresden, Alemania, 2008.
49. Y. Kyriakou, R. M. Lapp, L. Hillebrand, D. Ertel, and W. A. Kalender, Simultaneous misalignment correction for approximate circular cone-beam computed tomography, Physics in Medicine and Biology, 53, 6267–6289, 2008.
50. C. Mennessier, R. Clackdoyle, and F. Noo, Direct determination of geometric alignment parameters for cone-beam scanners, Physics in Medicine and Biology, 54, 1633–1660, 2009.
51. F. Noo, R. Clackdoyle, C. Mennessier, T. A. White, and T. J. Roney, Analytic method based on identification of ellipse parameters for scanner calibration in cone-beam tomography, Physics in Medicine and Biology, 45, 3489–3508, 2000.
52. K. Yang, A. L. C. Kwan, D. F. Miller, and J. M. Boone, A geometric calibration method for cone beam CT systems, Medical Physics, 33, 1695–1706, 2006.
53. G. T. Gullberg, B. M. W. Tsui, C. R. Crawford, J. G. Ballard, and J. T. Hagius, Estimation of geometrical parameters and collimator evaluation for cone beam tomography, Medical Physics, 17, 264–272, 1990.
54. J. Y. Li, R. J. Jaszczak, H. L. Wang, K. L. Greer, and R. E. Coleman, Determination of both mechanical and electronic shifts in cone-beam spect, Physics in Medicine and Biology, 38, 743–754, 1993.
55. Hamamatsu Photonics K. K., Hamamatsu Application Manual, X-ray flat panel sensor C7912 & C7942 & C7943, rev 2.10, kr1-i50006, 2003.
56. E. Lage, J. J. Vaquero, S. Redondo, M. Abella, G. Tapias, A. Udias, and M. Desco, Design and development of a high performance micro-CT system for small-animal imaging, in IEEE Nuclear Science Symposium and Medical Imaging Conference, San Diego, CA, 2006.
57. H. K. Tuy, An inversion-formula for cone-beam reconstruction, Siam Journal on Applied Mathematics, 43, 546–552, 1983.
58. L. A. Feldkamp, L. C. Davis, and J. W. Kress, Practical cone-beam algorithm, Journal of the Optical Society of America a-Optics Image Science and Vision, 1, 612–619, 1984.
59. R. Gordon, R. Bender, and G. T. Herman, Algebraic reconstruction techniques (Art) for 3-dimensional electron microscopy and X-ray photography, Journal of Theoretical Biology, 29, 471–481, 1970.
60. U. Ewert, U. Zscherpel, and K. Bavendiek. (2007, 2009). Replacement of film radiography by digital techniques and enhancement of image quality. Available: www.ndt.net/search/docs.php3?id=4516
61. J. Beutel, H. L. Kundel, and R. L. Van Metter, Handbook of Medical Imaging, Volume 1: SPIE Press, Bellingham, WA, 2000.
62. E. Buhr, S. Gunther-Kohfahl, and U. Neitzel, Simple method for modulation transfer function determination of digital imaging detectors from edge images, Medical Imaging 2003: Physics of Medical Imaging, Pts 1 and 2, 5030, 877–884, 2003.
63. E. Buhr, S. Gunther-Kohfahl, and U. Neitzel, Accuracy of a simple method for deriving the presampled modulation transfer function of a digital radiographic system from an edge image, Medical Physics, 30, 2323–2331, 2003.
64. E. Samei, E. Buhr, P. Granfors, D. Vandenbroucke, and X. H. Wang, Comparison of edge analysis techniques for the determination of the MTF of digital radio-graphic systems, Physics in Medicine and Biology, 50, 3613–3625, 2005.
65. H. H. Barrett, S. K. Gordon, and R. S. Hershel, Statistical limitations in transaxial tomography, Computers in Biology and Medicine, 6, 307–323, 1976.
66. ASTM Standard E1695, Standard Test Method for Measurement of Computed Tomography (CT) System Performance, ASTM International, West Conshohocken, PA, 2006, Doi: 10.1520/E1695-95R06E01, www.astm.org.
67. N. L. Ford, M. M. Thornton, and D. W. Holdsworth, Fundamental image quality limits for microcomputed tomography in small animals, Medical Physics, 30, 2869–2877, 2003.
68. A. Obenaus and A. Smith, Radiation dose in rodent tissues during micro-CT imaging, Journal of X-Ray Science and Technology, 12, 241–249, 2004.
69. J. M. Boone, O. Velazquez, and S. R. Cherry, Small-animal X-ray dose from micro-CT, Molecular Imaging, 3, 149–158, 2004.
70. M. J. Paulus, S. S. Gleason, M. E. Easterly, and C. J. Foltz, A review of high resolution X-ray computed tomography and other imaging modalities for small animal research, Laboratory Animal, 30, 36–45, 2001.
71. C. Chavarrias, J. J. Vaquero, A. Sisniega, A. Rodriguez-Ruano, M. L. Soto-Montenegro, P. Garcia-Barreno, and M. Desco, Extraction of the respiratory signal from small-animal CT projections for a retrospective gating method, Physics in Medicine and Biology, 53, 4683–4695, 2008.