C h a p t e r 1 3
Module 5—Tools to
Improve Creativity
Module 5 describes a number of tools that can help improve creativity.
Training Objectives
After completing this module, the participants should be able to
- describe and use at least five tools that may help improve creativity
- apply the appropriate tools to a variety of situations that require creativity.
Module 5 Time
- Approximately 2 hours
Note: This schedule includes time for a quick review at the start and a learning check at the end. It also includes a constant back and forth of presentations and exercises. As with all sessions of more than 90 minutes, a 10-minute break is included.
Materials
- Attendance list
- Pencils, pens, and paper for each participant
- Whiteboard or flipchart and markers
- Name tags or name tents for each participant
- Worksheet 13–1: Brainstorming Techniques
- Worksheet 13–2: Checklists and Catalogs
- Worksheet 13–3: Attribute Listing
- Worksheet 13–4: Cause-Effect Fishbone Diagrams
- Worksheet 13–5: Cause-Effect Matrix Diagrams
- Worksheet 13–6: Morphological Analysis
- Worksheet 13–7: Decision-Making Worksheet for Module 5
- Computer, screen, and projector for displaying PowerPoint slides; alternatively, overhead projector and overhead transparencies
- PowerPoint slide program (slides 13–1 through 13–24)
- This chapter for reference or detailed facilitator notes
- Optional: music, coffee or other refreshments.
Module Preparation
Arrive ahead of time to greet the participants and make sure materials are available and laid out for the way you want to run the class.
Sample Agenda
Note: Because of the nature of the material in this module, the sample agenda has much more detailed schedule suggestions. Unlike previous modules where the presentation is followed by an extended time for one worksheet exercise, we suggest here that the seven exercises be integrated into the presentation so they are completed immediately after the discussion of that particular process. A lot of material is included, so you will need to keep the participants on track fairly closely. All times are still just recommendations, and if you as the trainer believe that your participants are not able to assimilate this as scheduled, then either plan to extend the suggested two-hour timeframe or delete one or two of the creativity tools along with their associated exercises.
| 0:00 | Welcome class. |
| Have slide 13–1 on the screen as the participants arrive; go to slide 13–2 as you begin the session. | |
| Preview the agenda for this session (the objectives). | |
| Ask for questions or concerns. | |
| 0:05 | PPT presentation with exercises. |
| Begin with slide 13–3 and proceed through slide 13–9 with a combination of presentation followed by application exercises for the “creativity tools” being discussed. | |
| 0:20 | Worksheet 13–1. |
| Show slide 13–10; distribute Worksheet 13–1: Creativity Tools. | |
| Have class apply the presentation on brainstorming using worksheet. | |
| 0:30 | PPT presentation and Worksheet 13–2. |
| Show slide 13–11 and discuss; show slide 13–12. | |
| Distribute Worksheet 13–2: Checklists and Catalogs, and conduct exercise. | |
| 0:40 | PPT presentation and Worksheet 13–3. |
| Show slide 13–13 and discuss; show slide 13–14. | |
| Distribute Worksheet 13–3: Attribute Listing, and conduct exercise. | |
| 0:50 | Break. |
| Pause at a convenient stopping point for a 7- to 10-minute break. | |
| 1:00 | PPT presentation and Worksheet 13–4 |
| Show slides 13–15 and 13–16 and discuss; show slide 13–17. | |
| Distribute Worksheet 13–4: Cause-Effect Wishbone Diagrams, and conduct exercise. | |
| 1:15 | PPT presentation and Worksheet 13–5. |
| Show slide 13–18 and discuss; show slide 13–19. | |
| Distribute Worksheet 13–5: Cause-Effect Matrix Diagrams, and conduct exercise. | |
| 1:25 | PPT presentation and Worksheet 13–6. |
| Show slide 13–20 and discuss; show slide 13–21. | |
| Distribute Worksheet 13–6: Morphological Analysis, and conduct exercise. | |
| 1:40 | PPT presentation and worksheet. |
| Show slide 13–22: Application Exercise. Distribute Worksheet 13–7 and have participants work on exercise. | |
| 1:55 | Wrap-up. |
| Show slide 13–23. Review the objectives with participants. | |
| Ask for questions. | |
| Check for learning (questions can be in oral or printed form—see below). | |
| 2:00 | Show slide 13–24. Edit this slide to show appropriate information. Dismiss the class. |
Trainer’s Notes
8:00 a.m. Welcome (5 minutes).
Show slide 13–1.
Welcome participants and take care of housekeeping items.
Show slide 13–2, and preview the two module 5 objectives.
8:05 a.m. Creativity Tools (25 minutes).
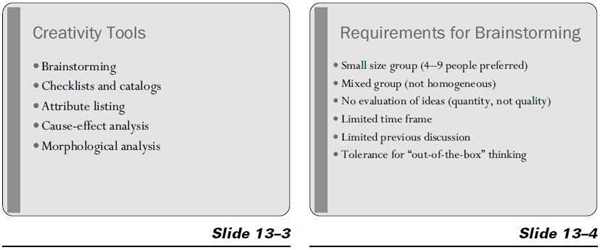
Show slide 13–3. State the following to the participants: This module will be a little different from the previous four, in that we’re going to talk about and then practice each of these creativity-enhancing tools one at a time. Probably many of you have been involved in brainstorming sessions, although they are often done in ways that don’t tap the full potential of this technique. We’ll talk about how to do it in the most effective way, then give you a brief chance to practice it. After that, we’ll spend a few minutes on how using catalogs and checklists can improve your creativity. Then we’ll introduce three techniques that many of you may find unfamiliar: (1) attribute listing, (2) cause-effect analysis (two types), and (3) morphological analysis. These are all creativity-enhancing techniques that can cause us to look at problems and decisions in a different way. First, let’s consider the process of brainstorming.
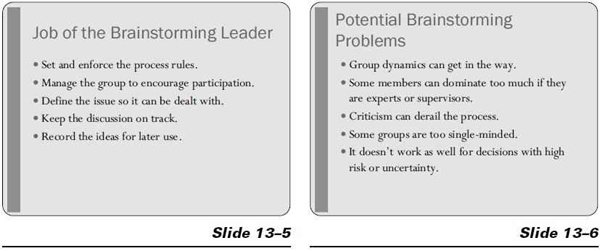
Show slide 13–4. Talk about the following requirements for successful brainstorming:
- Small-size group (four to nine people preferred). Groups smaller than four or larger than 10 people become awkward and less productive. Larger groups should be subdivided. Smaller groups might try some other techniques or temporarily add other people who might have some worthwhile perspective on the problem.
- Mixed group (not homogeneous). Homogeneous groups tend to produce fewer creative ideas. When possible, for brainstorming use a group that varies in background, gender, age, job category, and so forth. The diversity will usually enhance the creativity generated.
- No evaluation of ideas (at this point we want quantity, not quality). Quantity of ideas is the goal. This means that you go for volume, not quality of ideas. In going for quantity we may collect some good ideas that otherwise would be missed. We’ll judge the quality of the ideas as the next step in the decision-making process, not now. Evaluating the ideas at this point tends to inhibit people from being free-flowing with their suggestions.
- Limited time frame. A brainstorming session should last 15 minutes at least and 45 minutes at most.
- Don’t discuss the issue ahead of time. It may stifle new ideas during the brainstorming session.
- Tolerance for “out-of-the-box” thinking. Sometimes throwing out a few completely off-the-wall ideas will loosen up a group and encourage alternative viewpoints. Some leaders start with a “silliness” session to get the creativity juices flowing. (It doesn’t work for everyone, though.)
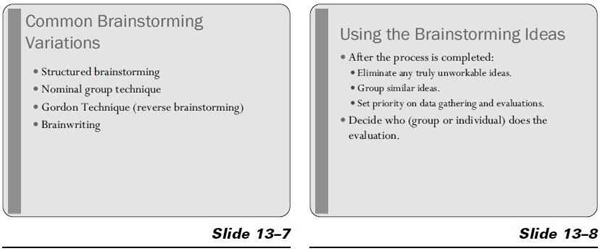
Show slide 13–5. Talk about the job of the brainstorming leader.
Tips for the brainstorming leader:
- Make sure all participants know and follow the ground rules.
- Use warm-up techniques to get the group participating. This just means getting the group to talk with each other, perhaps by doing a practice brainstorm on a really simple topic such as a gift for the boss or where to go on their next vacation.
- Define the problem and set the structure by which you’ll proceed. You’ll need to specifically state what problem the group is to work on, such as: “We’re looking for new ways to increase customer traffic in our Highland store.” Make sure everyone is focused on the correct issue before starting.
- Keep the discussion “on track.” If someone in the group begins to criticize another’s idea or goes off on a tangent that’s not related to the issue at hand, step in and restate the issue that’s being brainstormed. The analysis and fine-tuning come later, not during the initial session.
- Record ideas in a way they can be viewed by the group (flipchart, whiteboard, computer display).
- If you paraphrase as you write an idea, confirm with the person who offered the idea that you’ve captured the essence of what they intended.
- Participate yourself, add ideas of your own if desired, but don’t judge or edit the ideas offered by the class.
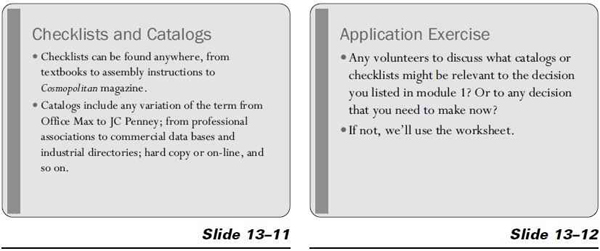
Show slide 13–6. Note that the dynamics of brainstorming sessions can inhibit some participants. Skillful leadership is needed to ensure that everyone contributes to creating an effective list of alternatives. Keep in mind the factors that can inhibit the effectiveness of group interactions:
- Presence of an expert or a high-level manager can discourage some people from voicing their ideas.
- Too much play or getting off track can discourage some participants.
- Criticism or negative thinking, even subtle, can ruin the effectiveness of the process.
- Homogeneity of the group, where all think alike or have worked together before, can inhibit creativity.
Effective leadership and skilled facilitation are essential. Note that brainstorming doesn’t work well for decisions with high risk or uncertainty.
Show slide 13–7. Discuss the following variations on traditional brainstorming:
Structured brainstorming. Once the problem has been described, each person is asked to contribute one idea at a time in turn. If participants don’t have an idea, they pass. This continues until everyone has passed in the same round.
Problems such as one person dominating the discussion and others not contributing can be addressed with structured brainstorming.
Nominal group technique. This technique can allow individual creativity to work before it becomes inhibited by the group. This process requires people to think silently, at first, writing down their ideas. They then contribute to the list in round-robin style. As ideas are voiced, anyone can question the contribution to clarify what is meant, but should not challenge or analyze it. The nominal group technique can end with a voting process, which asks people to choose their favorite ideas (one to five), thereby giving the group a sense of which ideas are popular. This voting narrows down the number of options to consider in the next decision-making step and actually begins the analysis phase.
Gordon Technique. When the subject or problem seems to have one or a few “obvious” solutions, the Gordon Technique can crack through the conventional thinking that is inhibiting creativity. For example, if we face a problem that’s always been dealt with in one way, it’s natural to block out other ways of handling it.
Using the Gordon Technique, the group is asked for ideas about a subject that is known in detail only to the leader. The leader begins with a very broad and abstract definition of the problem and starts to take ideas. Then, the leader narrows the statement through several stages, each time retaining previous suggestions, which still apply to the narrower statement.
Brainwriting. Each participant writes down his or her ideas about the problem under discussion. Participants then pass what they’ve written to someone else in the group. That person elaborates on what was written and adds any ideas of his or her own. Throughout brainwriting, participants are encouraged to combine ideas, improve on each others’ ideas, and hitchhike on things already suggested.
Repeat until everyone in the group has had a chance to contribute to everyone else’s original ideas.
Show slide 13–8. Now talk about how to use the ideas from the brainstorming session.
The purpose of brainstorming is to create an extensive list of ideas, and because evaluation during brainstorming is prohibited, the result is lots of ideas, including many that are impractical or impossible to use.
Eliminate truly unworkable ideas. To make the list of ideas usable, the ideas must be objectively evaluated. The first step in evaluation is to eliminate any truly unworkable ideas. A word of caution: Any person who makes the decision to eliminate an idea will approach it with his or her biases. With that in mind, it’s important to be sure an idea is actually unworkable before it’s eliminated. For example, just because some members of the group have never tweeted and are unfamiliar with Twitter, doesn’t mean using Twitter as a means to increase business should not be considered. Different generations have different needs and may not understand all the suggestions that come up. The same is true for people with other demographic diversity.
Group similar deas. The purpose of grouping is to determine what information needs to be collected to evaluate the ideas, and where the same information can be used on more than one evaluation.
Set priority for data-gathering and further evaluations. A priority should be established as to which ideas get evaluated first. The basis for the priority might be cost (which ideas are cheapest to implement), likelihood of success, or ease of evaluation, for example.
Key questions at this point: (1) What to do with the narrowed-down list of ideas? and (2) Who does the evaluation of those “finalist” ideas?
Group evaluation of the ideas—If the analysis needed to choose the best idea isn’t too complicated and the cost isn’t too high, it may be practical to extend the brainstorming to narrow down the options or even choose which idea to use. One way is just to take a vote of the brainstorming group.
Let’s say that 45 ideas were generated by brainstorming. The leader could ask everyone to choose the five ideas they think will work best. After everyone has had time to choose their five favorites, a vote is taken on each item with each person getting five votes. The result is a list of favorites, based on which ideas got the most votes.
Note: Voting on the ideas will work well only when the group has adequate information to make an evaluation. It is a popularity contest among the ideas, rather than a quantitative or objective evaluation. But if some of the most popular ideas will actually work to solve the problem, and the cost is not too high, then the most popular idea might be a reasonable choice.
Show slide 13–9. This slide is a “quickie.” It deserves only a brief comment, something like: “It’s good to keep in mind that at this point, before evaluation, that there may be more than one ‘right’ answer.”
 Show slide 13–10. Distribute Worksheet 13–1: Brainstorming Techniques.
Use Worksheet 13–1 or pick a volunteer to apply brainstorming to a decision he or she faces.
 The worksheet includes definitions of the four types of brainstorming only so the participants have this information in writing to take with them. The
simplest to use is structured brainstorming, and time is limited. You might want to act as leader, or choose one of the participants whom you believe can do a good job. Follow the directions you’ve just covered, such as group size (make two groups if you have too many in the class), and so forth. Do not go beyond just demonstrating how many ideas can be generated; that is, don’t try to narrow the list down to the best final decision. Move on to the next topic by 30 minutes into the training session.
8:30 a.m. Checklists and Catalogs (10 minutes).
Show slide 13–11.
Overview—checklists. First, we want to talk about the types of checklists that are useful in decision making.
Typical checklists might deal with: items you’ll need for vacation; how to set up your computer; what automobile maintenance services are needed at 36,000 miles; what groceries you might need for the week; and so forth.
Checklists can be inductive or deductive; that is, they can help you either create options or evaluate them, depending on the nature of the checklist.
Inductive checklists require a step-by-step approach (such as putting together the swing set you bought your child), whereas deductive checklists serve as preconstructed brainstorming lists with the items listed in no specific sequence.
For decision making, any preconstructed list of points to consider is a checklist. A list of points to consider is valuable in two ways: (1) if you made the list, you can return to it make sure you don’t skip points that need attention, and (2) if someone else made the checklist, you can take advantage their ideas on the subject,
Where do you find effective checklists for the subject you’re interested in? Common sources include textbooks on the subject, published articles on the subject, advertisements about a product or service, owner’s or instruction manuals, and so forth.
How do checklists help in decision making? Using checklists helps the decision maker add structure to both the creative or analytical processes. Checklists provide a means to use others’ thinking to help the process along. Checklists also provide additional suggestions for consideration in specific applications.
Overview—catalogs. Using catalogs is another way to come up with additional options and alternatives to any decision-making or problem-solving issue. It allows the decision maker to tap into already created lists, some of which will probably expand in unexpected ways.
A “catalog” may come in a variety of forms: directories, the classified section of a magazine or newspaper, databases, and many others. If your problem or decision is of major importance, it will be worth your time to visit a library or contact an individual or organization that specializes in relevant research. But you might first consider sources such as these:
Professional or industry associations in the area you’re researching. For example, if you need materials about training skills, contact organizations such as The American Society for Training & Development, National Education Association, and so on. Your library probably has a directory of associations, which can give you some leads.
Commercial research databases can provide names of companies and agencies that help with your decision. You can find them by searching on keywords.
Industrial directories include Moody’s or Dun and Bradstreet, along with many others that a librarian can help you find. They contain lists of companies you can contact for product or service details that may help with your decision.
The most obvious sources for most people these days are Google, Yahoo!, Ask.com, and the myriad other search engines available online.
Show slide 13–12. Distribute copies of Worksheet 13–2: Checklists and Catalogs.
This worksheet includes definitions only so that the participants will have them available when they leave the session. The important part for this exercise is to have each participant or each group answer the question at the bottom: “For the decision you’re working on, where might you find useful checklists or catalogs?” This question can probably be answered in less than two minutes. Then move quickly on to the next topic.
8:40 a.m. Attribute Listing (10 minutes).
Show slide 13–13. If you follow the script below, you’ll need a ballpoint pen. You’ll also need to practice disassembling it before the class, so the demonstration goes well. But you don’t have to use a ballpoint pen. You can substitute some other object you can disassemble to make the same points.
Overview—attribute listing. Attribute listing is a means to evaluate and improve physical items. Although it can also be used with abstract concepts, it’s more difficult. Attribute listing is based on the premise that we think about parts differently than we think about wholes. This tool can be used by either an individual or a group. If done by a group, it can be used in combination with brainstorming concepts.
The phrase, “You can’t see the forest for the trees,” fits here. This technique is designed to force you to look at both the trees and the forest. It can help you overcome perception problems, which block creativity.
The “divide-to-conquer” process has its roots in Frederick Taylor’s application of the scientific method to the study of production. Taylor didn’t try to improve the process of coal shoveling—he improved several of its individual components; and, as a result of his improvements, the whole process was improved.
For attribute listing, it always helps to have the physical item available for reference.
Choose an object that you can easily disassemble. A click-top ballpoint pen works well. Take it apart into its pieces and ask what you can do with each component. The barrel could be used as a straw or a small blowgun or a whistle (when you blow across it like a bottle top). The ink chamber can be used with the barrel and internal spring to be a small “rocket launcher.” The clip can be used as a tie clip, or noisemaker when you push the button up and down. What other ideas can the participants come up with?
Show slide 13–14, and distribute Worksheet 13–3: Attribute Listing.
This worksheet has the definition of attribute listing so that the participants will have it available when they leave the session. It will be simpler to use a physical object of some sort to do this exercise. If you have an advanced group of participants, you might choose the second option on the sheet of trying to break apart a decision.
8:50 a.m. Break (10 minutes).
Encourage them to return promptly, because there are still four more brief exercises to complete in this module.
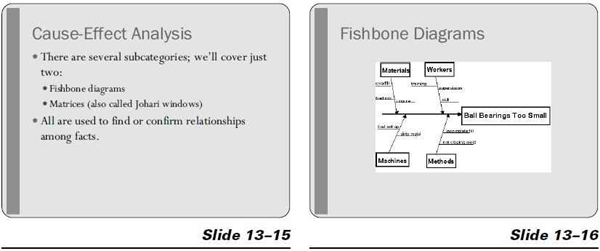
9:00 a.m. Cause-Effect Analysis (25 minutes).
Show slide 13–15.
Overview—cause-effect analysis. We use cause-effect analysis to find and confirm relationships between facts. The “cause” part can be used to help search for causes of problems (variances from standard results). The “effect” part can be used to help project what might happen as a result of implementing a particular plan. These diagrams can also be used to help organize brainstorming as it is being done.
Cause-effect analyses can be done in a variety of ways. Some of the techniques result in a cause-effect diagram that can be used to help organize brainstorming as it is being done, but much of the value of cause-effect analysis to get down on paper the “facts” and to show among them relationships as we believe them to exist. Having the facts related visually as causes and effects helps us follow the logic and test relationships for reasonableness.
Cause-effect diagrams use a graphical format of lines and tables that represent a relationship between an effect and its causes or a cause and its resulting effects. They can be used to: (1) recognize important causes, (2) understand all effects and causes, (3) compare operational procedures, (4) improve processes, and (5) determine options or possible solutions.
These tools are frequently taught as part of a total quality management programs. We will cover two types of cause-effect analysis: fishbone diagrams and matrices (also called Johari windows).
Show slide 13–16.
Fishbone Diagrams: One of the most common formats for cause-effect analyses looks something like a fish skeleton, hence the name “fishbone.”
Explain that the fishbone diagram on slide 13–16 is of a production problem: The ball bearings being produced are too small.
The major possible causes (material, the method being used, the workers, and the machinery) are listed in boxes placed parallel to and some distance from the main arrow. Arrows slanting toward the main arrow or production line connect the boxes.
The minor possible causes are connected to the major causes on lines or arrows pointing into the major causes.
Show slide 13–17. Distribute Worksheet 13–4: Cause-Effect Fishbone Diagrams.
Direct participants to use the worksheet to analyze a decision that they or a colleague is working on.
After allowing participants time to fill in the worksheet, review the results and ask for their thoughts about using a fishbone diagram to help solve a problem or make a decision.
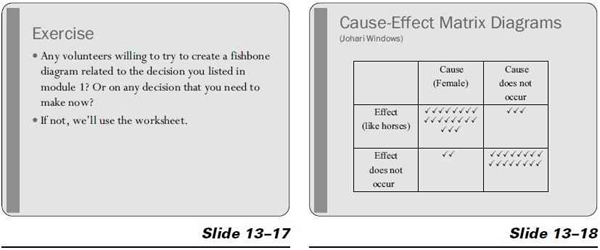
Show slide 13–18.
Cause-effect matrix. This is typically a two-by-two grid that shows relationships between items.
Use the following example: We are investigating whether there is a cause-effect relationship between being female and liking horses. We define “being female” as the possible cause, and “liking horses” as the effect. Then we talk with 40 people and ask if they’re female (be prepared for nasty comments if you have to ask), and if they like horses. We then tally the results in each box according to the answers. If we have taken an honest sample, we can imply a rather strong cause-effect relationship from this data.
Show slide 13–19. Distribute copies of Worksheet 13–5: Cause-Effect Matrix Diagrams.
If the participants can come up with a suitable topic for this analysis, it’s best to do it on a flipchart or whiteboard (rather than on the worksheet). You could ask the participants, for example, if they use Twitter or text on their cell phones and divide them into under- and over-30 years of age. See if being under 30 has a cause-effect relationship to the use of Twitter. Use your imagination to come up with examples that will work with this creativity tool for your particular group of participants.
9:25 a.m. Morphological Analysis (15 minutes).
Show slide 13–20. Another useful decision-making tool is morphological analysis.
Literally, the name means “analysis of structure.” This tool gives you a process to analyze the structure of a decision. You break the decision into its major component parts. Once the structure is analyzed, forced-relationship techniques are used in order to produce extensive combinations of ideas. It forces you to put things together in ways you might never have considered without using this process.
How many parts should the problem be divided into? A table of four variables with ten choices each would result in 10,000 combinations. It quickly becomes apparent why limiting the choices and variables is necessary, because you must decide on the merits of each combination individually. Think, for example, of a computer program designed to come up with passwords. If you have 26 letters and 10 digits (ignoring symbols for the moment), a six-character password with options from “AAAAAA” to “000000” would have 1,947,792 possible combinations. We will discuss how to calculate this in module 7.
You must know the component parts of a decision to be made or problem to be solved. You might use attribute listing or cause-effect analysis to determine components, although they may be somewhat obvious.
Show slide 13–21. Distribute copies of Worksheet 13–6: Morphological Analysis.
After allowing participants time to answer the questions on the worksheet, review the results and ask for their thoughts about using morphological analysis to help them make a decision.
9:40 a.m. Creativity Tools (15 minutes).
Show slide 13–22. Distribute Worksheet 13–7: Decision-Making Worksheet for Module 5.
Have the participants complete the worksheet individually or in groups. Move among them to keep them on task.
9:55 Module 5 Summary (5 minutes).
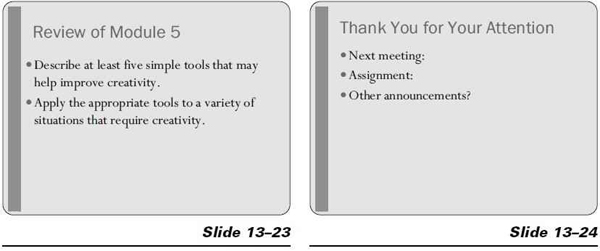
Show slide 13–23. Review the objectives covered in this module.
 LEARNING CHECK QUESTIONS
You can use the learning check questions and answers in oral or printed form.
Discussion Questions
- Describe advantages and disadvantages of traditional brainstorming.
Answer: Advantages: It’s easy to do, it’s creative, and ideas build off one another. Members feel involved, it encourages participant commitment to chiose, and so on. Disadvances: See slide 13–6. - Name two different approaches to cause-effect analysis.
Answer: fishbone diagrams and cause-effect matrix (or Johari windows diagram). - What are potential problems with both the checklist and catalog techniques?
Answers: (1) Difficulty in finding useful checklists and catalogs. (2) Collecting too much information. - Between attribute listing and morphological analysis, which one forces combinations and which one forces separations?
Answer: Morphological analysis forces combinations, even though it requires breaking things apart first. Attribute listing requires you to break things apart. - In the movie (or book) Apollo 13, the crew in space needed to create air filters to fit one unit, using materials from another and from things they had in the space capsule. On the ground, a group of engineers was brought into a room and told, “We have to make one of these (the functioning air filter) using only these materials (a stack of everything which was in the capsule that was expendable).” Would attribute listing or morphological analysis be best for this?
Answer: Both would be useful. Certain things could be broken apart so that only part of them would be used, but it’s also necessary to put things together in new and different ways.
Multiple Choice Questions
- “Fishbone diagrams” are one of several categories of
a. Brainstorming
b. Morphological analysis
c. Cause-effect analysis (answer)
d. Culinary techniques - A typical “Chinese menu,” which requires choosing one item from column A and one item from column B, and so forth, is the basic idea behind which of the creativity tools?
a. Cause-effect analysis
b. Catalog technique
c. Morphological analysis (answer)
d. Brainstorming
10:00 a.m. Thank You for Your Attention.
Show slide 13–24. Edit the slide to include information relevant to your class. Dismiss the class.
Worksheet 13–1
Four brainstorming techniques are discussed in the training:
Structured Brainstorming: Once the issue has been described, each person is asked to contribute one idea at a time in turn. If someone doesn’t have an idea, he or she passes. Continue until everyone has had a turn in the same round.
Nominal Group Technique: The group is instructed to think silently, first writing down ideas. Participants then contribute to the list in round-robin style. Each person can question the contribution to clarify what is meant, but should not challenge or analyze it. The nominal group technique also ends with a voting process, which asks people to choose their favorite one to five ideas.
Gordon Technique (reverse brainstorming): The group is called together to come up with ideas about a subject known only to the leader. The leader starts with a very broad and abstract definition of the problem, and then narrows the statement through several stages, each time retaining previous suggestions that still apply.
Brainwriting is a variation in which each person gets a sheet of paper and anonymously writes his or her ideas on the question under discussion, then passes the sheet on to the next person, who elaborates and adds any more of his or her own ideas, suggested by what is already listed. The sheet continues around until all people have contributed to each original list.
Follow the guidelines discussed in class, and brainstorm about what to get your spouse or best friend for his or her birthday or another idea suggested by you or one of the other participants. Use the space below for notes.
© 2010 Decision-Making Training, American Society for Training & Development
Worksheet 13–2
Checklists
Like several of the other tools in this unit, checklists can be either inductive or deductive. They can therefore be used either to create options or to evaluate them, depending on the nature of the checklist. Some checklists require a step-by-step approach, whereas others essentially serve as preconstructed brainstorming lists and require no specific sequence. Both types can be useful.
Typical checklists might deal with items you’ll need for vacation; how to set up your computer; what automobile maintenance is needed at 36,000 miles; or what groceries you might need for the week. Essentially, any preconstructed list of points to consider is a checklist. They can be beneficial because they are reusable and allow you to take advantage of other people’s ideas on the subject (or your own previous ideas).
Catalogs
The catalog technique helps a person come up with additional options and alternatives to almost any decision-making issue. It allows the decision maker to tap into already created lists, some of which will probably expand in unexpected ways.
Note that what is being called a “catalog” may come in a variety of guises: directories, the classified section of a magazine or newspaper, databases, and so forth, as well as the more traditional meaning of the word. The most obvious sources for most people these days would be to use the web search engines, such as Google, Yahoo!, Ask.com, and so forth.
For the decision you’re working on, where might you find useful checklists or catalogs?
© 2010 Decision-Making Training, American Society for Training & Development
Worksheet 13–3
Attribute listing is a means to evaluate and improve physical items. Although this technique can be used with abstract concepts, it’s more difficult. Attribute listing is based on the premise that we think about parts differently than we think about wholes. This tool can be used by either an individual or a group. If done by a group, it can be used in combination with brainstorming concepts.
The phrase, “You can’t see the forest for the trees,” fits here. This technique is designed to force you to look at both the trees and the forest. It can help you overcome perception problems that block creativity.
Try out the technique by taking a simple object such as a ball point pen or a wallet. If the decision you are trying to make has multiple parts to it, try breaking it into its components and then deal with each part separately. Option: Use a decision that one of your colleagues is working with and help him or her break it into pieces.
© 2010 Decision-Making Training, American Society for Training & Development
Worksheet 13–4
Cause-effect analyses can be done in a variety of ways. Their purpose is to find and confirm relationships between facts. The “cause” part can be used to help search for causes of problems (variances from standard) in control. The “effect” part can be used to help project what might happen as a result of implementing decisions. These diagrams can be used to help organize brainstorming as it is being done. Further, much of the value of these tools is to get down on paper the “facts” and relationships as we believe them to exist. The visual diagram helps to follow the logic and test it for reasonableness.
Use the “effect” fishbone diagram below to analyze the possible effects of the decision you have been working on (or some other decision suggested by your trainer or a colleague). The major branches are often designated as “people,” “equipment,” and so forth. Make up your own classifications to fit the issue at hand.

© 2010 Decision-Making Training, American Society for Training & Development
Worksheet 13–5
Cause-effect analyses can be done in a variety of ways. Their purpose is to find and confirm relationships between facts. The “cause” part can be used to help search for causes of problems (variances from standard) in control. The “effect” part can be used to help project what might happen as a result of implementing decisions. These diagrams can be used to help organize brainstorming as it is being done. Further, much of the value of these tools is to get down on paper the “facts” and relationships as we believe them to exist. Having a visual diagram helps to follow the logic and test it for reasonableness.
Matrix (Johari window) Cause-effect matrices give a quick visual summary of the results of data analyses, and can suggest relationships, or lack thereof, between potential cause and effect.
Use the matrix diagram below to analyze the relationship between cause and effect. You’ll have to collect data from the group or use your memory. For example: 1. Cause—Being rich; Effect—Being arrogant. List ten relatives or acquaintances you know and think of each one at a time. If they’re both rich and arrogant, mark them in the cause occurs/effect occurs boxes. And so on.

© 2010 Decision-Making Training, American Society for Training & Development
Worksheet 13–6
Literally, the name means “analysis of structure.” This tool gives you a process to analyze the structure of possible options for a decision. This means you break the decision into its major component parts. Once the structure is analyzed, forced relationship techniques are used to produce extensive combinations of ideas.
The example below offers options that could be considered for advertising special occasion meals a restaurant might make available. Which of the options make sense? You need to match each occasion with each possible combination of prospect and advertising medium. Some will make sense, but many won’t. It simply forces you to think of combinations you might not have considered before. How many options are created by this technique? (Hint: Multiply the number of options in each column times each other, or O’s times P’s times AM’s.)
| Occasion | Prospect | Ad Medium |
| Mother’s Day | Children | Radio advertisement |
| Valentine’s Day | Lovers | Parking lot flyers |
| Birthday | Parents | Newspaper ad |
| Anniversary | Teachers | Airport display |
| Executives | Cable TV spot | |
| Senior citizens |
How many options can be created from the table above? __________
How many options would be possible if there were 10 choices in each column? __________
Which of the above seems to make the most sense? __________
© 2010 Decision-Making Training, American Society for Training & Development
Worksheet 13–7
Creativity Tools
Restate the decision(s) you have been working on during the training:
Pick any two of the creativity tools discussed that would help to develop options for your decision:
- Brainstorming
- Catalogs and checklists
- Attribute listing
- Cause-effect analysis
- Morphological analysis
Then use the tools to come up with some possible options for yourself, and write them in the space below.
© 2010 Decision-Making Training, American Society for Training & Development