
Chapter 2. Issues and coding standards
- Looking at your issues
- What issues mean
- Where issues come from
If you’re only using your users’ bug reports to measure the bugginess of your code, then you’re only seeing a tiny sliver of the picture—because users can only report what they can perceive. Any user will recognize a program crash, but what about gradual performance degradation caused by unclosed database connections?
The report that comes back from the users typically sounds like “sometimes it gets slow and we have to restart.” Which could, of course, mean anything.
In this chapter, we’ll look at issues: programming errors that users aren’t necessarily noticing...yet. Pay attention to coding rule issues, and you can head that bug report and many others off at the pass by preventing problem code from ever reaching the user.
The term issues covers two of SonarQube’s Seven Axes of Quality: potential bugs, and coding standards. We’ll start with what SonarQube tells you about issues on the dashboard and in the issues drilldown. Then we’ll look at why each issue is a potential problem, even the ones you might be tempted to shrug off.
Next we’ll take a brief look at rule profiles—the sets of rules against which your code is measured in an analysis—and how to change the defaults. We’ll round out the chapter with a summary of issues-related plugins that might be of interest.
2.1. Looking at your issues
Bob is one of your best customers, and he says the app is crashing when he opens the Edit window. But only sometimes. Your testers can’t reproduce the crash, but you have to believe Bob because he sent you screenshots.
The best suggestions at this point are a line-by-line audit of the code, which could take weeks and still not produce anything, or flying someone out to watch over Bob’s shoulder as he works.
Neither idea is popular with upper management. Now what?
Now it’s time to let computers do what they do best: automate intricate, detailed, and mindlessly tedious tasks. It’s time to turn to SonarQube for a look at your issues.
After your first analysis, you’ll likely see hundreds of issues on your SonarQube dashboard. Each one represents some anti-pattern in your source or compiled byte code. Not every issue is a bug, but it’s something that needs further attention. Also, addressing issues is the quickest road to higher-quality software.
Let’s start from the dashboard, where you see something that looks like figure 2.1. This is the issues widget, which reports on your project’s adherence to a rule profile. At upper left is the raw count of issues. To the right is the issue breakdown by severity. At lower left in the widget is the project’s Rules Compliance Index, a calculation based on the number and severity of issues versus the number of lines of code in the project. It’s calculated with the formula shown in figure 2.2.
Figure 2.1. The issues widget gives the total number of issues, the breakdown of that count by level of severity, and the Rules Compliance Index.
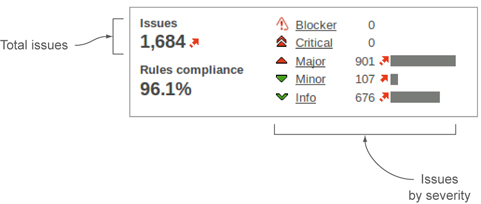
Figure 2.2. The Rules Compliance Index is the Weighted Issues score (your counts of issues multiplied by severity factors), divided by the number of lines of code in the project, turned into a percentage, and subtracted from 100.
![]()
The Rules Compliance Index is a gut-check type of metric that gives perspective. After all, 465 issues in a project with 10,000 lines of code is entirely different from the same issue count in a 500-line project. The problem with Rules Compliance is that it can fluctuate without the number of issues ever changing. For instance, if you add lines of issue-free code, your index goes up. At a glance, you might think you’ve improved the code base, when all you’ve really done is dilute the problem. For that reason, we won’t spend more time on the Rules Compliance Index.
Instead, we’ll focus on the issues themselves. To see what the issues in your project are, you can either choose Issues Drilldown in the left menu or click-through in the issues widget on the Issues total at upper left or on one of the individual issue severities. Figure 2.3 shows you the issues drilldown with the Major severity highlighted. In chapter 1, we showed you a metric drilldown for complexity that looked a lot like the bottom half of figure 2.3. That’s because the package and file/class hierarchy are standard interface features you’ll see repeated from drilldown to drilldown.
Figure 2.3. The four widgets you first see in the issues drilldown represent a hierarchy: severity, rules, packages, and classes/files. Each widget after Severity is sorted by the number of hits against the items listed. Click at any level to filter the widgets lower in the hierarchy. Click a file or class name to begin seeing issues in that file at any time.
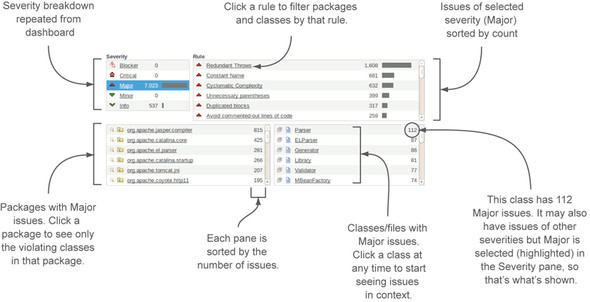
What’s specific to the issues drilldown is the severity and rule hierarchy across the top. If you got here by clicking Issues Drilldown in the left menu, then none of the severities are highlighted, and you’re seeing all issues in the Rule box at upper right, grouped by severity (worst first) and sorted by count.
To narrow the list of rules, click a severity. It will not only filter the rules at upper right, but also limit the package list to only packages with issues of the selected severity, and similarly limit the class list to only classes with issues of the chosen severity.
It works the same way with the rules. Click a rule to filter the packages and classes to show only ones with issues of that rule. And of course, clicking a package filters the class list by that package. If you find that you’ve filtered too much, you can re-click your choice at any level to remove that filter and the ones below it in the hierarchy.
At any point, whether you’ve filtered the list or not, you can click a filename to begin seeing the issues in the file detail view, which is added to the bottom of the screen when you click a filename. If you did click a rule first, you’re only shown issues of that particular rule in the file you’ve chosen. Other issues may exist, but they’re filtered out initially. To see them, the easiest thing to do is consult the All Issues drop-down at upper right of the file detail view, shown in figure 2.4. You can use it to show all the issues in the file, or all the issues of a particular severity or of a particular rule.
Figure 2.4. Once you click a file, you’re shown the issues in that file with a few lines of context on each side. If you have the SCM Activity plugin in place, you see not only the problem code and its line number, but also who checked it in and when.

For each issue, SonarQube not only shows what the problem is and where to find it, but also gives a few lines of context around each issue. If the context shown by default around the issue isn’t enough for you to understand the problem, you can use the Full Source check box at upper left in figure 2.4 to show the issues in the context of the whole file.
By default, SonarQube shows you the “what” and the “where” of a issue. If you’re using the SCM Activity plugin, it can also show you “who,” as shown in the left column in figure 2.4.
SCM stands for Source Control Management, and the plugin integrates with many of the popular source control repositories, such as Git, Subversion, and CVS. It doesn’t come bundled with SonarQube, but it’s maintained by the authors of SonarQube, and it’s a free download.
Now that you know how to find your issues, let’s dig in to what they are.
2.2. What issues mean, and why they’re potential problems
The issues shown earlier were recorded during a SonarQube analysis. As one part of the analysis, SonarQube compares your code to a set of rules. When a rule is broken, an issue is marked against the line where it occurred. Issues are reported at one of five severities: Blocker, Critical, Major, Minor, and Info, and the severities generally mean what you’d think they would.
Severities are attached to the rules being checked, not to the issues themselves. So you won’t see SonarQube report one issue of rule A as a Blocker and another issue of rule A as a Minor.
Note
There are exceptions. Two rule profiles might include the same rule at different severities, and it’s possible to change the severity of an individual issue. See chapters 10 and 13 for details.
For the sake of discussion, it’s useful to break the issues SonarQube reports into six general categories. They’re listed here in approximate order of importance:
- Bugs
- Potential bugs
- Indications of (potential) programmer error
- Things that may lead to future programmer error
- Inefficiencies
- Style inconsistencies (future productivity obstacles)
Very often, issues that represent bugs and potential bugs show up in SonarQube as Blocker or Critical issues. After that, you can’t necessarily match up the severity of an issue to the categories we’ve outlined here. That’s particularly true because the severity of an issue is editable (we’ll show you how in chapter 13), and the importance (severity) that one person or team places on a rule may differ from another’s. To make this clearer, figure 2.5 gives a general overview of severities versus categories.
Figure 2.5. SonarQube’s issue severities match up only loosely with the categories we’ll use in this chapter to discuss the kinds of issues that are flagged.
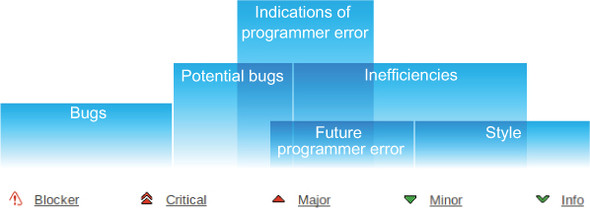
For instance, some things that would fall under “inefficiencies” or “future programmer error” are flagged by SonarQube as Major issues, and others show up as Minor. So although the severities are important, we’re going to set them aside for the purpose of this discussion.
Next we’ll look at each category and tell you why it’s important. We’ll also give you a few examples of issues in the category, but don’t think that these lists are exhaustive. Unfortunately, the lists of things you can get wrong are far longer than we have space for.
2.2.1. Bugs
The first (and worst) category is bugs. Issues in the bugs category are guaranteed to be problems. Your users might not be complaining about them, but if so, that’s because they just haven’t noticed them yet.
Things in the bugs category include the following:
- Logic errors that would lead to null pointer exceptions
- Failures to close file handles or database connections
- Bad behavior in a multithreaded environment
- Methods designed to check equality that always return false (or true)
- Impossible class casts
Figure 2.6 shows one such issue flagged in SonarQube.
Figure 2.6. Null pointer dereferences fall into the bugs category.

Any piece of code flagged with the issue shown in figure 2.6, “Correctness–Null pointer dereference,” is guaranteed to be a problem. Full stop. No horsing around.
Sure, the particular example of reversed logic shown in figure 2.6 is trivial enough to verge on silly, but it’s the kind of thing that’s easy to do when your mind is elsewhere. And trivial or not, this example represents a very serious category of issue, because these bugs are always guaranteed to have unpleasant results for the user.
At best, issues in the bugs category result in performance degradation that eventually requires a restart, and Murphy’s Law dictates that it will come at an inconvenient time. At worst, your users are probably dealing with weird program behavior and error messages, or outright program crashes.
2.2.2. Potential bugs
As with bugs, potential bugs represent actual problems in the code. Often, though, they’re conditional problems, ones that will only happen some of the time—which is probably how they get past the programmers’ own testing.
You’re even less likely to get coherent bug reports from the users about these problems, but they’re problems nonetheless. Figure 2.7 shows one such issue.
Figure 2.7. If everything works well, on line 1096 this method will close the FileOutputStream that was created on line 1084. But if an exception is encountered in the middle, that resource leaks instead. If this happens once or twice, you may never notice. Let it go on long enough, though, and you’ll bring your application to its knees.

We had to use the Full Source check box we mentioned earlier to see enough of the code to understand the problem shown in figure 2.7. Once we did, we saw that the code will work fine some of the time, when everything works as it should and no exceptions are thrown. But when an exception is thrown, this code starts leaking resources like a sieve, because the method re-throws all its exceptions without pausing to clean up after itself first. This is the sort of thing that may happen only 1% of the time—a corner case—but once it’s pointed out, it’s easy enough to fix, and there’s really no reason not to.
In addition to potential resource leaks, the potential bugs category includes things like these:
- Potential null pointer exceptions, which happen only under certain conditions
- Null checks that dereference the items they’re checking
- Math operations that use the wrong precision or lose precision
Now that we’ve covered the two issues categories for things that are flat-out wrong, what’s left are the categories with problems that typically are just as serious but that may not be quite as urgent.
2.2.3. Indications of (potential) programmer error
Unlike the issues in the first two categories, the ones in the indications of programmer error category aren’t guaranteed to cause problems. And at first blush, they may tempt you (or developers you work with) to dismiss the entire enterprise as trivial, because they flag code where there’s nothing technically wrong. Figure 2.8 shows an example.
Figure 2.8. An empty conditional may mean the coder forgot to do something.

If you skimmed past it, take a minute to actually read the code in figure 2.8. On line 22, a conditional checks whether the day in question is Tuesday. Then, on line 24, the conditional block is closed. There’s nothing in between the open curly brace and the close curly—except the issue block that SonarQube overlays into the code.
The code shown in figure 2.8 will run just fine. But ... don’t you have the sense that something is missing? At the very least, you’re probably wondering what the programmer meant to do on Tuesdays.
That’s why this gets flagged by SonarQube. Not because there’s anything demonstrably wrong, but because there’s an indication that the developer might have made a mistake.
For instance, what if it should have looked like this?
public void complexMethod(RequestObject request) {

  String day = request.getWeekday();

  if (day.equals("Tuesday") {

    processPayroll();

  }

}
Clearly, forgetting to process payroll is a serious omission.
A small subset of issues in the indications of error category has to do with null checks: null-checking a variable that has already been dereferenced, re-null-checking something you already know is null, and re-null-checking something you already know isn’t null. Coders who cut their teeth on C may bridle at these, because they’ve long lived by the motto “Null-check early; null-check often.” The reason SonarQube flags these null-check instances, and the reason they’re included in this category, is that they look like evidence of rearranging the code without really reading it.
Other issues in this category include
- Comparing objects with == or != rather than the .equals() method
- Conditionals that assign rather than compare, such as if(count=1), which always returns true, versus if(count==1), which is truly a conditional
- Unused members or methods
- Catch blocks that swallow exceptions rather than logging or passing them on
Next we’ll move from the issues that tell you a coder may have tripped up to the ones that mark the bumps in the road ahead—where coders may trip in the future.
2.2.4. Things that may lead to future programmer error
Issues in the future programmer error category strike some as purely questions of style. Others will recognize them for the traps that they are. Figure 2.9 gives an excellent example.
Figure 2.9. Conditionals without curly braces could lead to future programmer error.
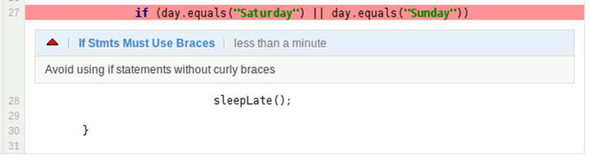
Figure 2.9 shows a conditional without curly braces. Like some of the previous examples, figure 2.9’s brace-less conditional will run just fine. And many coders prefer not to use curly braces around one-line if statements (and else statements, and wheres, and so on). They argue that it makes for cleaner-looking code. Certainly for the alert and focused programmer, the code shown in figure 2.9 is clear, concise, and readable.
The problem is that not every programmer is alert and focused. The next guy who comes along may be more used to one of the languages where the indents count and not the curly braces, or he may be focused more on what’s for lunch than the trivial change he needs to make, and he may do something like this:
if (day.equals("Saturday") || day.equals("Sunday")
     playLotto();
     sleepLate();
If you’re paying attention only to the indention, like our hungry coder, you may think this program now has you sleeping late and playing the lottery only on weekends.
In fact, because only the first command after a brace-less if statement is conditionally executed, what it actually does is have you play lotto on the weekends and sleep late every day of the week. Now you’ve not only squandered all your money on lottery tickets, you’ve also started missing work.
Then there are the rules that check naming conventions. They make sure your class names start with capital letters and your method names don’t. They look for constant variables that are named in all caps and make sure your non-constant variables aren’t.
These may seem like questions of style, which are covered shortly, but they’re included here because straying from these industry-standard conventions will lead experienced programmers to make false assumptions about code they’re not familiar with—assumptions that at best will waste their time and at worst will lead to the kind of subtle bug that can be very difficult to track down.
Also in the future programmer error category are the things that will make the next person’s job harder to do when she gets assigned to maintenance on your project:
- Classes that try to do too much and need to be chopped up
- Methods that are too long and complex
- Conditionals with too many clauses
Future programmer error issues can make it difficult to maintain existing code correctly and efficiently. The issues in the next category can make it difficult for your program to run efficiently.
2.2.5. Inefficiencies
No issues in the inefficiencies category will keep your program from performing correctly. Nor will they lead to future problems. What they will do is keep your program from performing at peak efficiency. And although that may not be a concern today, it could become important as your program’s user base grows or its share of the CPU shrinks.
A set of issues in this category that deserves special mention, at least in Java, is the inefficient use of strings. Using strings poorly is sadly easy to do in Java and particularly likely for coders who come to Java from other languages. For instance, concatenating strings in a loop is standard operating procedure in some languages. But it’s such a bad idea performance-wise in Java that a special rule checks for it. Figure 2.10 shows another rule in the strings group.
Figure 2.10. Strings are easy to abuse in Java, and SonarQube offers several rules to ensure that you’re using them efficiently.

Also in this category are
- Unneeded import declarations
- Suboptimal use of the special Java math objects like BigDecimal
- Unused members and methods
If you’re alert, you noticed that “unused methods” is listed in the indications of (potential) programmer error category as well. There are many issues that could span multiple categories, and this is one of them. In fact, many people would lump everything in the next category, style inconsistencies, into the future programmer error category.
2.2.6. Style inconsistencies (future productivity obstacles)
The issues in this category are the stuff of which holy wars are made. For instance, which line does the left curly brace go on? This one?
if (day.equals("Monday")) {
Or this one?
if (day.equals("Monday")) {
To add spaces?
if ( day.equals( "Monday" ) )
Or not?
if(day.equals("Monday"))
The idea behind these style rules is the same one behind consistent placement and presentation of traffic signals; once you learn the system, your eye zooms past the presentation (“There’s a sign up ahead”) and straight to the critical data being presented (“It’s red; I should stop!”).
Start changing sign shapes or colors, and it takes longer to get to the meat of the matter. Similarly, developers spend most of their day reading code. The extra time required to take in code that’s not formatted in the style the team agreed to, multiplied by the number of files they read and the number of developers in an organization, could work out to a lot of lost productivity.
We’ve listed the bug categories here in order of the quickest bang for the buck, which is also (in some minds) their order of importance. But others would argue that the categories we put at the end of this list are just as important—even more so in the long term—as the ones at the start, because they relate to the maintainability of the code. Left unfixed, these issues could make your code difficult to maintain, favor the introduction of bugs (because of low readability and high complexity), and, little by little, make the business reticent to make changes because they’re costly and usually end up breaking something.
Now that you’ve got a feel for the kinds of rules SonarQube gives you, we’ll look at where they come from and how SonarQube organizes them.
2.3. Where do issues come from?
You may be aware that very good open source tools are available to analyze code and find anti-patterns. You may have even used them in the past. But when’s the last time you remembered to do it? Even if you’re analyzing regularly on your own, what about your teammates? Are you all using the same tools? With the same options? Chances are, the answer is no.
Standardizing the answers to those questions is one of the great benefits SonarQube offers. In Java and C#, it provides a few rules of its own, but the majority of the rules SonarQube uses come from the major rules engines: FindBugs, PMD, and Checkstyle for Java; FxCop, Gallio, Gendarme, NDeps, and StyleCop for C#. For most other languages, the rules come directly from within the plugin.
2.3.1. Picking a rule profile
Even though SonarQube uses multiple external rules engines for Java and C#, it doesn’t turn on all three tools full-bore. Instead, it packages selected rules from each tool into what it calls profiles. Multiple profiles can exist per language, and one profile is always set as a default for that language. The default for a language almost never includes every single rule that’s available for the language. New projects and projects that haven’t been specifically pinned to a rule profile (unassigned projects) are measured against their language’s default.
For Java, SonarQube provides three profiles: Sonar way, Sonar way with FindBugs, and Sun checks. It sets Sonar way as the default.
The Sun checks rule set is a small one, weighing in at only 58 rules. All it does is check source code against the Sun Java coding style conventions. For example, it checks member- and class-name capitalization, curly brace position, and the use of spaces.
The difference between the other two (the two versions of Sonar way) is the inclusion or exclusion of FindBugs rules. It’s a big difference. Checkstyle and PMD scan your uncompiled .java files. By contrast, FindBugs (and some of the SonarQube-native rules as well) runs against your compiled byte code, the .class files. During a SonarQube analysis, if FindBugs is invoked (if any of its rules are included in the profile), it performs a static analysis of every possible path through the program: no stone unturned, and no execution necessary. Similarly, the C# suite also includes static analysis of compiled code.
The bugs from static analysis tools like FindBugs are the “best” ones, the ones you really want to catch, because those tools find the problems that are the most likely to lead directly to bad program behavior. For instance, the Java issue “Correctness - Null value is guaranteed to be dereferenced” comes out of FindBugs, and without FindBugs in your profile, you’ll have a much harder time finding and fixing these rotten apples.
Clearly, you want to use the FindBugs rules if you have access to the .class files during analysis. Unfortunately, because that access can’t be assumed, SonarQube’s out-ofthe-box default is the less demanding Sonar way profile.
Assuming you have the .class files handy, you should use the Sonar way with Find-Bugs profile instead of the out-of-the-box default. The most expedient way to do that is to change SonarQube’s default Java profile.
FindBugs analyzes your compiled byte code, not the Java source. This means you need to be aware of two things.
First, the issues it finds may sometimes be shown in SonarQube attached to the wrong line of code. When that’s the case, look one or two lines above and below the line SonarQube flags, and you’ll find the real source of the problem (as shown in the following figure).

Sometime FindBugs flags the wrong line with the issue. It makes that occasional mistake because it’s working from the compiled byte code, not the .java files. When this happens, look a line or two above and below to find the real problem.
Second, for FindBugs and SonarQube to be able to make any kind of connection at all between a issue and a line of source code, you need to have debug turned on when you execute your javac command. (It’s off by default if you’re using Ant.) This has the effect of embedding line-number information in your byte code. FindBugs can then use this information when recording the issues it finds. (Of course, this implies that it’s not FindBugs that occasionally gets line numbers wrong, as we said earlier, but javac.)
Be aware that turning on debug in your compile will have the added effect (typically considered a benefit!) of adding line numbers to any stack traces, thus making it easier to track down and fix your exceptions in production.
2.3.2. Viewing profiles and changing the default
Changing a language’s default profile is as easy as the click of a button for a logged-in administrator. The Configuration link at upper right on the screen takes any user to the list of profiles, as shown in figure 2.11.
Figure 2.11. Any user can see the rule profiles by using the Configuration link at upper right of the screen.
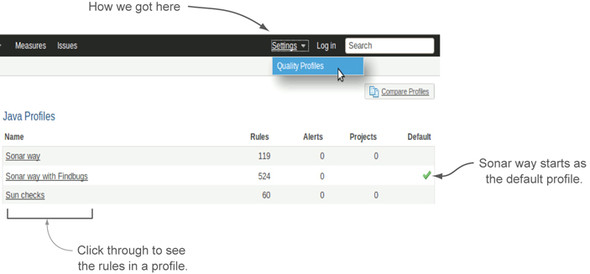
This means any user can see what the default profile is for a language (the one with the green check mark) or peruse the profile a project is being measured against (it’s listed in the Description widget on the dashboard). But only administrators see the columns of controls shown on the right in figure 2.12.
Figure 2.12. Administrators have the ability to create and edit rule profiles and change which profile is the language’s default.

Your first analysis of a project will run against its language’s default profile, which we hope you’ve just changed. Once it’s established in SonarQube, an administrator can easily assign a project to a different profile, and all subsequent analyses will run against it even if it’s not the default.
Even if your project’s preferred profile is currently set as the default, it’s not a bad idea to also explicitly assign the project to that profile. To do that, start by clicking-through on the profile name and then choosing the Projects tab, as shown in figure 2.13. Once your project is assigned to the proper profile, you’ll still get the analysis you expect, even if the default changes.
Figure 2.13. Projects can be assigned to a non-default profile for analysis.

When you begin analyzing your projects against a rule profile, you may find there are rules in the profile or rule-severity assignments you don’t agree with. One option is to switch to another profile, but a better option is customizing your rules. For details, see chapter 13.
2.4. Related plugins
A number of plugins are available that add rules, but we’re going to focus here on something different: the SCM Activity plugin, which enhances the presentation of your issues. Here’s a brief rundown.
2.4.1. SCM Activity
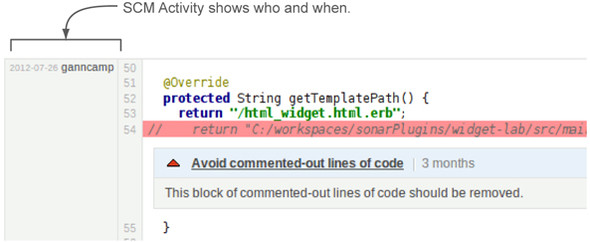
The SCM (Source Control Management) Activity plugin integrates with your source control repository to attach committer information to each line of code, as shown in figure 2.14. This free plugin works with a number of mainstream SCM tools, such as CVS, SVN, and Git, to show you not only who last checked in changes to a given line of code (not necessarily the person who added an issue), but also how old that change is.
Figure 2.14. The SCM Activity plugin adds committer and commit-date information to the file detail view. This screenshot shows a section of code, starting at line 54 of the file, that was checked in on 7/26/2012.
Once you install the SCM Activity plugin and restart SonarQube, you’ll need to make configuration changes on a project-by-project basis to begin seeing commit data. The configuration page for the plugin does a good job of walking you through what to configure and how to do so.
There are just a few things to keep in mind. First, after installation, this plugin is on by default. If you’re in a Maven shop, with your SCM server info embedded in your pom.xml, then this is peachy. For everyone else, this can be a pain, because if the plugin is enabled for your project (the default) but your SCM server info isn’t available (also the default), your analysis will fail. You’ll either want to switch the global configuration for this to be off by default, or be aware that your analyses will fail until you either toggle this off at the project level or tell SonarQube where to find its source control server.
Second, there are plugin configuration inputs for the login and password to connect to your SCM. You can leave these blank if your SCM URL encapsulates those credentials, as it does in a typical CVS URL, for example.
Once you’ve finished application configuration and saved your changes, kick off another analysis. This first one with the SCM Activity plugin on board can take significantly longer than you’re used to. Essentially, the plugin is reading in the entire history of your project. Each analysis after the first one will take longer than analyses did before you added SCM Activity, but not nearly as long as this setup analysis.
2.5. Summary
SonarQube scans your program code for anti-patterns and reports each instance as an issue. Not all issues are bugs, but every issue needs further attention.
Rules come from existing tools like FindBugs, PMD, and Checkstyle, as well as from SonarQube itself. Rules are packaged into profiles, and for each language SonarQube can analyze, there will be at least one profile. Among the profiles for a language, one will always be marked as the default. An administrator can easily change which is the default profile. If the default profile isn’t appropriate for your project, an administrator can easily assign the project to a different one.
We’ve focused on issues and coding standards in this chapter, but SonarQube also offers rules that check (and flag) problems with complexity, duplications, documentation, and unit testing—in other words, other Axes of Quality. As we cover those topics in the next few chapters, starting with testing in chapter 3, keep in mind that you also have the option to raise issues when the code isn’t meeting your standards for those axes.