
Chapter 7. Improving your application design
- Layering your code
- Discovering dependencies and eliminating cycles
- Library management for Mavenites
- Defining your architectural rule set
The size of an active project increases commit by commit, day by day, week by week. As your software grows, it gets more complex. New classes are added, methods are improved, and new libraries are created. Gradually, the structure that was clearly delineated and pristinely designed at the start turns into a morass. The first sign of trouble you usually notice is the mess of external libraries needed in order to compile and run an application in a production-like environment, but that’s just the tip of the iceberg.
In chapter 6, we looked at complexity at a file level. In this chapter, we’ll zoom out to look at complexity at the package, module, and application levels, and discuss how to use SonarQube to keep your architecture in good modular shape. We’ll look at package and module-level dependencies and show you how to read the Dependency Structure Matrix (DSM) to find suspicious dependencies and suspicious cycles among software components. We’ll talk about why they’re bad and how you can remove them.
You want to keep your design clean and your system maintainable and extensible. SonarQube provides an extremely useful and powerful mechanism called the Dependency Structure Matrix. With the DSM, you can visualize the dependencies between software components (libraries, packages, or even source code files) and then find those cycles that make your system’s design too complicated.
This chapter will also show you how painless SonarQube makes it to examine a Maven-centric project’s external library dependencies, their versions, and whether there are conflicts that need your attention.
Finally, we’ll show you how to create architectural rules to monitor access between certain files or packages. You won’t be able to keep developers from accessing files or packages in ways that run counter to your overall design; but you can have SonarQube tell on them by creating issues based on the rules you define, allowing you to catch problems and correct them early.
Before we move on, we’d like to explain something important: the analysis done by SonarQube, although powerful, is performed without understanding what packages do. SonarQube computes the minimum number of links to break to remove the cycles, but this is a theoretical approach. What you need to do might be completely different.
7.1. Layering your code
Sam, after surviving a couple of rough assignments, now has a new challenge. It’s time to improve an existing feature. She needs to implement recurring credit card billing for a new Coin of the Month subscription that the coin store plans to add. Basic credit card processing is already in place, but the current checkout process only supports one-time payment.
She gets to work, but after a couple of days Sam sees that it’s harder than she realized, because the code that handles payment processing is too complicated. Several classes participate to complete the checkout, and there is no orchestration class—a class that coordinates other classes to perform a single task. Each class has several dependencies (which could be potentially reduced), and changing a single method affects many components. She worries that every little change could break the whole system.
Sam’s having a difficult time, and it’s made worse by the fact that navigating to several source code files just to see how the system works is time-consuming and potentially error-prone. A modular system with concrete responsibilities among packages would be less painful to understand and maintain.
7.1.1. Looking at dashboard widgets
The first step in improving the design of your application is to find (and fix) dependency cycles between your components. But first, why are cycles bad? To get a feel for the effect of cycles, imagine a small application that’s split into three libraries. Over the course of time, each library has evolved to depend on the other two (thus creating cycles!), until finally you’re at the point that you can’t upgrade one without also touching the others. Because of dependency cycles, simple changes that should be easy take three times as long (at least) to complete.
Detecting this sort of unhealthy circular dependency at the package level is the focus of the package design widget, shown in figure 7.1. The widget is split into two parts. On the left side you see a metric named Package Tangle Index and the number of package cycles detected during analysis.
Figure 7.1. SonarQube dashboard widget pertaining to cycles and dependencies
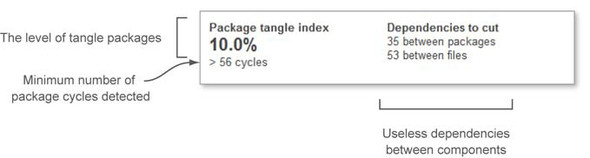
On the right, the widget reports on unwanted dependencies between packages and files. These are the dependencies you should try to cut in order to remove package cycles. For the project shown in figure 7.1, you would need to fix 35 package dependencies involving 53 files to clean up your package dependency cycles.
All the numbers in this widget are golf-style metrics, and 0 is always your target score. Before you start clicking widget numbers (yes, there is a drilldown view, although it’s different from what you’ve seen before), let’s clarify how SonarQube computes these metrics.
7.1.2. Understanding cycles and unwanted dependencies
In chapter 6, you saw that SonarQube inventories each file’s afferent and efferent couplings (incoming references from and outgoing references to other files). At the end of an analysis, it has a full list of everything a given resource (file or package) uses and everything that uses it. Each time a file or package is on both sides of that list, it’s considered a cycle, and the usage on one side of that list will be shown as a dependency to cut. Figure 7.2 illustrates a set of package dependencies.
Figure 7.2. Package-dependency graph, demonstrating a package cycle
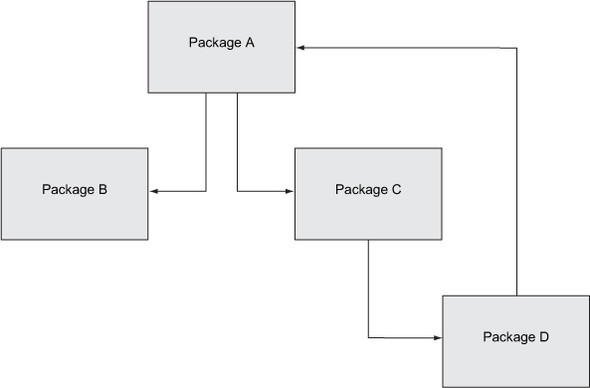
Package A depends on package B and package C. Package C depends only on package D. So far, so good. It’s a common dependency graph. But add in the fact that package D depends on package A, and you’ve got a dependency cycle: A > C > D > A.
Now imagine that packages A, C, and D (the ones in the cycle) contain only one class each, like the simple classes in listings 7.1, 7.2, and 7.3.
Listing 7.1. Simple ClassA of package A, referencing ClassC of package C

Listing 7.2 shows the simple class ClassC that references ClassD.
Listing 7.2. Simple ClassC of package C, referencing ClassD of package D

Listing 7.3 shows the class ClassD that references ClassA and produces the cycle.
Listing 7.3. Simple ClassD of package D, referencing ClassA of package A

After running a SonarQube analysis on these three classes, you would get a Package Tangle Index value of 66.67%. The other three metrics in the widget would each be 1, meaning that
- Two out of three packages (66.67%) participate in dependency cycles.
- At least one file cycle is detected inside a package.
- One dependency needs to be cut on a file level.
- One dependency needs to be cut on a package level.
You’ve probably already figured out that ClassD’s dependency on ClassA is the one that closed the loop to create a package cycle (A > C > D > A), and that’s the dependency we’d target to cut the cycle. Many times, the cycles you see will be directly reciprocal: that is, package A including package B and vice versa. We intentionally structured this example to involve three packages, to make the point that cycles aren’t found only between pairs of packages, but can involve several packages at once.
Now that you know a little more about dependency cycles, let’s move on to SonarQube’s drilldown. As you’ll see, it’s different from the drilldowns you’re used to.
7.1.3. Moving from project to package level
To access SonarQube’s drilldown, click-through on any number in the package design widget. Figure 7.3 shows the result of clicking Package Tangle Index.
Figure 7.3. Drilldown view for design metrics
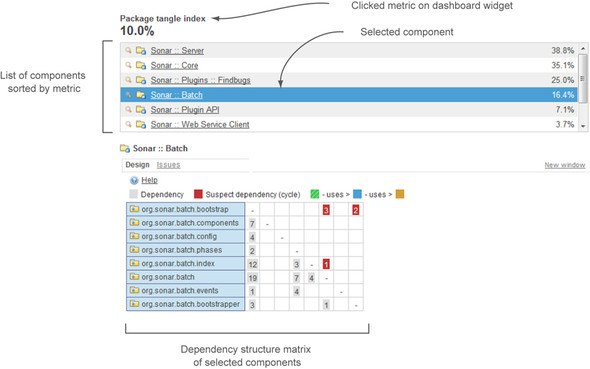
The top half of this drilldown is somewhat familiar. The metric you click is at upper left, followed by a list of modules sorted worst first—although that appear only if you’re in a multimodule project. If you’re in a single-module project, the list is eliminated and you only see the table shown at the bottom of figure 7.3. This presentation is like the others you’ve seen in that components with no design issues are omitted from the list.
Just below the library list in figure 7.3 is the Design tab with the DSM. The DSM is a powerful tool for exploring your project’s package interactions. Regardless of which metric you click in the dashboard to get to the drilldown, the numbers in this matrix are always package dependency counts.
The first time you access this drilldown from the dashboard widget, the DSM displays all the packages in the project (see figure 7.4). Click any row in the module list at the top of the page, and the matrix is filtered to display only the packages in the selected module. You can even deselect a library by re-clicking its row to have the DSM return to showing all the packages in the project.
Figure 7.4. DSM view for library and package dependencies

An alternate way to navigate to the DSM is to click the Design link on the menu at left at the project level. Regardless of whether you’re in a multimodule project, you don’t see the upper panel if you go this route (as illustrated in figure 7.4 with the XStream project’s modules, and packages from one of those modules).
Now that you’re thoroughly versed in how to get to the DSM, let’s take a deeper look at what it shows.
7.2. Discovering dependencies and eliminating cycles
As we’ve said, the DSM is a flexible, colorful, and easy-to-use tool for browsing dependencies at every level of your projects. Although it’s powerful, using it requires some knowledge; so next we’ll look at how to decode what it’s telling you. You’ll see how to read the DSM to spot dependencies between components. But be aware that the DSM relies heavily on colors to convey its content. We’ll do our best to point out where data is being washed out of our black-and-white screenshots, but your best bet is to follow along in your own SonarQube instance as we walk you through it.
Note
Before we move on, we’d like to remind you that it’s not always possible to fix cycles. For example, when the cycles involve an API, fixing them is likely to involve a retro-compatibility issue.
7.2.1. Navigating the Dependency Structure Matrix
When you look at the DSM for the first time, it’s normal to find it difficult to read. Fortunately, it’s one of those things that most people get used to pretty quickly. You’ve seen a couple of screenshots of the DSM, and you know it’s considered a matrix.
You may be wondering why only one axis has labels. The column labels are omitted to save space and to simplify the interface, because they would be the same as the row labels: the same text in the same order, as shown in figure 7.5.
Figure 7.5. Column headers would make the DSM look busy.

We’ve manually added the column headers in figure 7.5 to help you better visualize the information in the graph. Unfortunately, unless you turn your head to the side, it’s hard to read the headers in the figure. Now imagine how much more difficult it would be in a very large program. We’ve seen DSMs that scrolled down multiple pages (and, because the DSM is always square, they scrolled sideways just as far). Imagine how much noise duplicate header labels would create.
Before we get into the DSM’s functionality, we’ll explain what its colors tell you. We’ll start with the colored cells that contain numbers, as shown in figure 7.6.
Figure 7.6. Colored cells in the DSM report on dependencies and cycles between components.

Some of the color cues that apply to the rest of the SonarQube interface work here as well: red is bad, and gray is neutral. A black number in a gray cell is the count of references between two components. White numbers on a red background alert you to a dependency cycle that could (should?) be removed. Unfortunately, because this book is printed in black and white, you’re seeing all the cells as gray. The good news is that the colors of the numbers themselves will help you differentiate: the numbers in cells that report on the dependencies between the components are written in black for innocuous dependencies or white for cycle dependencies.
The numbers represent dependencies. When the DSM lists modules in the left row header, the numbers show package dependencies. When the left row header shows packages, the DSM numbers show file dependencies.
Most of the figures and examples that you’ll see in the next few pages focus on package dependencies. Based on our experience, these dependencies are the most important when we talk about software design; potential package cycles should be carefully examined and removed.
Next we’ll look at how to read the DSM and how to use it to identify cycles that may need to be removed to keep your application’s modularity and maintainability in good shape.
7.2.2. How the DSM works
To examine a package’s dependencies, click the package in the left column. The package’s row and its corresponding column are highlighted in pale blue. The numbers in the package row are the package’s afferent, or incoming, dependencies—the other packages that this one includes. Conversely, the numbers in the highlighted column are the package’s efferent, or outgoing, dependencies—the packages that this one is included by. Figure 7.7 shows this in action; it’s a screenshot of the DSM for the Server module from SonarQube.
Figure 7.7. Viewing dependencies of selected component in the DSM

As you see, the package org.sonar.server.charts was clicked, and its description is highlighted in blue. All cells for its corresponding row and column are also highlighted light blue.
Tip
Remember RICO to know what the rows and columns in the DSM are telling you: Row-Incoming, Column-Outgoing.
Let’s do some simple math with the DSM. Assume that you need to find the total incoming and outgoing dependencies of the selected package. All you have to do is sum up the numbers shown in the highlighted row and column, and you’re done. For the record, org.sonar.server.charts has only one incoming file dependency (the sum of the numbers shown in the highlighted row) and a total of six outgoing file dependencies (the sum of the numbers shown in the highlighted column).
You may have noticed that some rows (other than the selected one) have a colored marker (green or gold) at the end of the package description. These colors are your guide to finding out which package is dependent on which other one. They let you read the dependencies as a sentence. The legend at the top of the DSM explains the meaning of each color. Green uses (depends on) blue, and blue depends on gold.
You can read the dependencies of the highlighted package in figure 7.7 just as you’re reading this book. The org.sonar.server.platform package (green marker) has one file dependency on org.sonar.server.charts (blue highlighted package), which has five file dependencies on the org.sonar.server.charts.deprecated package (gold marker).
As we mentioned, each number represents the total file dependencies (incoming or outgoing) from one package to another. The fact that there are no column headers in the DSM might make you think, especially if you’re a SonarQube starter, that it’ll be hard to find the dependencies between two specific components. That’s where the beauty of the DSM comes in.
So far, you’ve seen that you can click any row label in the DSM. Now it’s time to try clicking a cell. When you do, you’ll notice a couple of changes in the DSM. Figure 7.8 shows the DSM after we clicked the fourth cell in the last row: the one containing 5. First, notice that more rows and columns are highlighted than before: two package names are highlighted in blue instead of just one.
Figure 7.8. Clicking a DSM cell. Dependencies between selected components are highlighted and differently colored in both directions. The clicked cell also turns purple.

That’s because when you click any single cell in the DSM, you’re picking half of an interaction: where package A meets package B in the grid. To show the full relationship, SonarQube lights up the entire rectangle for you, also showing where package B meets package A.
In addition to highlighting the row you clicked, the DSM also highlights the package that belongs to the clicked column. For instance, in figure 7.8, we clicked the fourth cell (column) in the row, so the corresponding package (the fourth row) is also highlighted.
If you’re following along on a live instance of SonarQube, you’ve also noticed that the highlight colors have changed. Cells in the grid aren’t light blue anymore: they’re either green or gold. The new colors indicate the direction of the dependency, similar to the package name markers we showed you in the previous figure. And the same rules apply: green depends on blue, and blue depends on gold.
You’ll also have noticed (if you’re following along in a browser) that the two corner cells where green and gold meet (lower-left and upper-right) are colored purple. The numbers in each corner reflect the dependencies in one direction of the relationship. In figure 7.8, the empty purple square at upper right is where org.sonar.server.charts is included by org.sonar.server.charts.deprecated. That square is empty, so you know there are zero dependencies. The corresponding purple square with a 5 at lower left shows the other half of that relationship, where org.sonar.server.charts.deprecated is included by org.sonar.server.charts five times.
The last thing to talk about before we move on to hunting package cycles is how the DSM sorts packages. High-level components are listed at the top of the DSM, and low-level components are listed at the bottom. To better understand what makes a package high-level or low-level, look at figure 7.9.
Figure 7.9. DSM sorting. High-level components appear at the top of the list.

The concurrent and event packages are considered high-level packages because they have no incoming dependencies. Thus they appear at the top of the list, subsorted alphabetically. On the other hand, several packages depend on the lang3 package, so it’s listed near the bottom—but it’s not last. Why? The lang3 package has outgoing dependencies on the mutable and text.translate packages, so those two packages are even lower-level and are listed after lang3.
Now that you’ve got a handle on the DSM’s basic navigation, let’s move on to hunting down package cycles to improve the design of your application.
7.2.3. Identifying cycles
You may already be suspicious about the design of the project we’ve been showing you because there are packages that depend on packages that depend in turn on the first packages. (Dizzy yet?) You’re right to be suspicious. These are what we call undesired dependencies. You’ve already seen that some cells in the DSM are red: you can get a quick take on how bad your design is with a glance at the number of red cells, and an even better understanding by looking at the size of the numbers in them. Yes, big is bad in this case. In this section, we’ll dive in to what the DSM has to tell you about these cycles.
First, remember that even though the column headers aren’t shown in the DSM, you know what they are—they’re the same as the row headers. If the first column in figure 7.10 were labeled, it would say org.sonar.server.ui to match the first row. The second column would say org.sonar.server.platform to match the second row, and so on.
Figure 7.10. Unwanted cycles are displayed in the upper-right triangle.
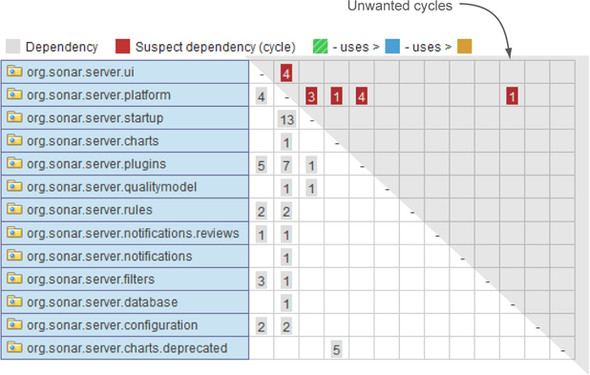
The diagonal line across the grid shows where each package matches up horizontally and vertically. These cells never contain a number because SonarQube doesn’t report a package’s dependencies on itself at this level.
If you visually split the DSM into two triangles by drawing a line across all the dashes, as we’ve done in figure 7.10, then all dependencies that circle back to form cycles are shown in the upper-right triangle.
But why do the numbers showing unwanted dependencies all end up in the upper-right triangle? Is it this way all the time? Well, yes. This is the norm because SonarQube lists software components so dependencies to cut are always shown in the upper-right triangle. You’ve seen that SonarQube sorts higher-level packages to the top of the DSM. In general, you’ll see that SonarQube marks a higher-level package’s incoming dependencies as the ones to be cut.
We’ve told you that the numbers on red backgrounds in that upper-right triangle in the DSM represent dependencies to cut in order to remove cycles. But knowing that you have a total of N cycles in your project or module is completely useless, because a single bad dependency can generate a lot of different cycles. The most important thing is to quickly know which dependencies you need to cut in order to fully remove unwanted cycles.
Fortunately, when you’re looking at a package-level DSM, double-clicking a cell gives you a list of file dependencies. When you click a red cell, the list represents the file dependencies that should be removed to eliminate a package cycle, as shown in figure 7.11.
Figure 7.11. Double-click a numbered cell, and you see a list of outgoing file dependencies between the selected packages. Clicking a file name pops up a window with the file detail view you’ve seen before.

Before we move away from the DSM, there is one last thing to mention. You’ve seen that double-clicking a cell drills down to display a list of individual couplings. You can also double-click any row label to drill down within that package. Figure 7.12 shows the result of that kind of drilldown: the file dependencies of a specific file.
Figure 7.12. Double-clicking a row drills down the DSM to the next navigation level.
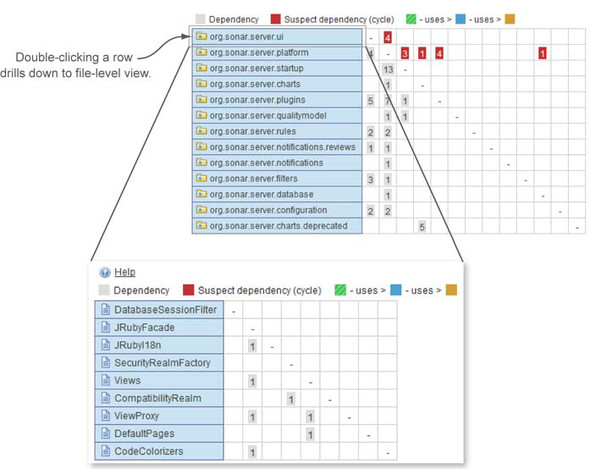
Figure 7.12 doesn’t show any file-level dependency cycles, but they’re possible, and they would appear here in a case where two files directly depended on each other. Most of the DSM behaviors we’ve discussed apply here as well, except for a slight difference in double-click behavior. Double-clicking a row pops up a new window showing the source code viewer instead of drilling down (because there’s no down left to drill in to), and double-clicking a numbered cell shows the names of the connected files instead of showing a list of associated files.
Now that you’ve identified all these cycles between packages and/or files, you may be wondering how to get rid of them. The answer depends on the design of your system, but there is a general starting place. Most cycles appear because the packages or classes involved don’t have clear and concrete responsibilities. This could be a matter of original design, of gradual design distortion, or lack of communication within the team. Whatever the cause, to resolve the issue, you need to find those mixed responsibilities and clean them up by doing one of the following:
- Moving responsibilities into higher-level classes
- Creating new classes
- Merging classes
- Reorganizing your packages
You’ve seen what SonarQube has to tell you about design and complexity among the packages and modules in your application. Next we’re going to move back a step to look at the complexity of an application’s external dependencies: its libraries.
7.2.4. Library management for Mavenites
The time when software systems were built from just a few source code files has long since passed. Today, applications make extended use of common libraries to avoid reinventing the wheel, improve productivity, and increase modularity and maintainability. Theoretically, whenever a new library version is available, the old one is replaced, and the system takes advantage of new features and resolved issues.
This section discusses features that are available only for Java projects built with Maven. We assume a familiarity with basic Maven concepts. (Sorry, non-Java and non-Maven folks!)
In general, Maven has dramatically decreased the time developers spend on library management. It lets you define which libraries your source code depends on, and it takes care of downloading those libraries and their dependencies from third-party repositories. The idea is that Maven takes care of the tedious stuff, and your life as a programmer gets a lot easier; and that’s almost true.
When it works, it works beautifully. But sometimes your library dependencies have second levels that conflict with each other. We’ve seen several problems caused by jars that were silently downloaded by Maven and that were incompatible with other libraries in the dependency tree.
If you’ve ever been in the position of untangling one of these knots, you know it’s a painful task. But the next time you find yourself in this situation, SonarQube can make your life easier. It lets you browse library dependencies at the project or module level and offers a dynamic search to spot libraries of interest. It also gives you a separate search function to find which libraries depend in turn on a specific library.
7.2.5. Browsing the library-dependency tree
To start browsing your library dependencies, click the Libraries link on the left menu at the project level. The link appears even if you’re watching a non-Maven project, but clicking it won’t display any results. As figure 7.13 shows, you’ll get a library-dependency tree including both direct and indirect dependencies. This is the result of running the command mvn dependency:tree.
Figure 7.13. Library-dependency tree for Java Maven projects
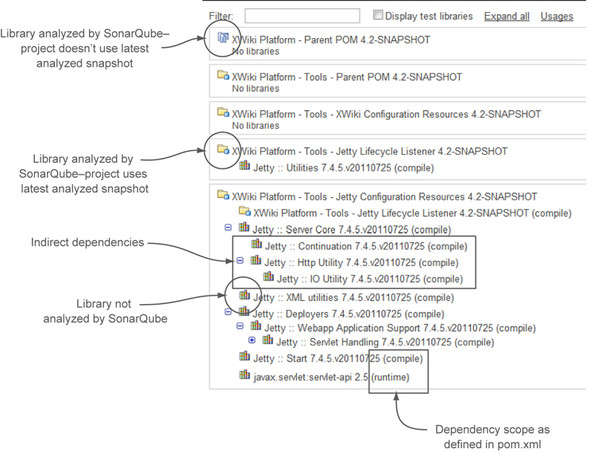
Each top-level tree node represents an outgoing, first-level dependency—the one that was explicitly stated in your pom.xml file. To the left of each library’s name is an icon representing the status of the library in the current SonarQube installation. Table 7.1 lists the possible icons and their meanings.
Table 7.1. Library statuses
|
Explanation |
|
|---|---|
| The library has been analyzed by the current SonarQube installation, and the project/library uses the latest analyzed snapshot. | |
| The library has been analyzed by the current SonarQube installation, but the project/library uses an older analyzed snapshot. | |
| The library hasn’t been analyzed by the current SonarQube installation. |
To the right of each library name is its dependency scope as defined in pom.xml (compile, provided, runtime, or test). By default, only development libraries are shown in the tree; but if you select the Display Test Libraries check box, the tree is re-rendered to include libraries used for testing.
Second-level tree nodes represent indirect dependencies. Those are libraries used by your project’s first-level dependencies, the ones specified in the pom.xml files. Including these second- and third-level (and so on) dependencies can sometimes result in a huge dependency tree. But huge or not, if everything works well, you probably don’t care. Unfortunately, that’s not always the case. Sometimes you end up with branches of your tree that conflict with each other, such as one branch that specifies version 1 of a library and another that wants version 2. This sad state is known as Maven dependency hell, and as we’ve mentioned it can cause problems (what else would you expect from Hell?). But unlike Dante’s Hell, there is no “Abandon hope, all ye who enter here” sign. There is a way out, and SonarQube is your GPS.
To start, imagine that you want to find all project dependencies (direct or indirect) on Apache’s commons-lang library. You can use the dynamic filter at the top of the dependency tree. Just type the name of the library you want to check, and the list is automatically filtered accordingly. An example is shown in figure 7.14.
Figure 7.14. Dynamic library filtering
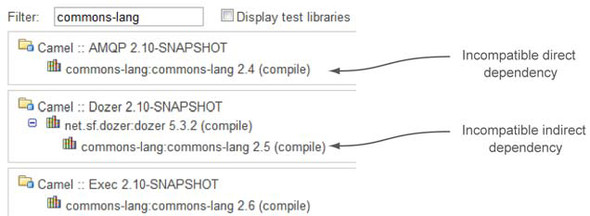
With a few clicks, we found that three modules in the same project depend directly or indirectly on commons-lang. Unfortunately, they all depend on different versions, which could (and probably will!) cause stability and compatibility issues at runtime, because they’ll load three different (most likely incompatible) versions of the same library into their shared JVM. Which one will be used by your libraries? How can you be sure your system won’t use an older library version than the one it needs (the one that has the new API you call from your code)? Basically, you can’t know. And you can’t do much at runtime to control which version is used. You need to deal with the issue earlier in the development lifecycle.
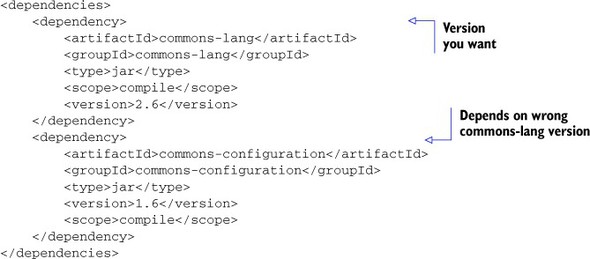
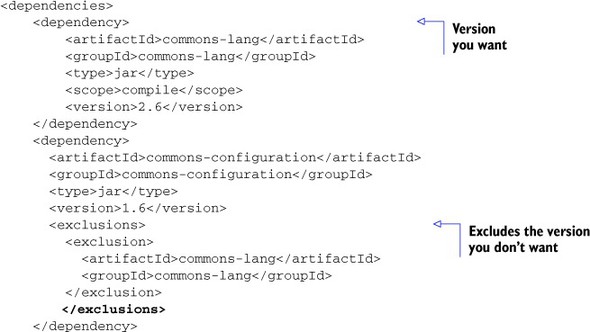
Your goal is to use only the latest stable release of commons-lang—version 2.6. To get rid of the other versions, you need to make some pom.xml changes. First, change all direct dependencies to the desired versions by setting the right attribute in pom.xml (if you haven’t already). If your target library isn’t already a direct dependency, then make it one, being sure to specify the correct version. Then, exclude the indirect dependencies to avoid future references to the unwanted versions. That’s it. The project now uses a single, correct version of the library.
Listing 7.4 shows the starting point. You include version 2.6 of commons-lang explicitly, along with version 1.6 of commons-configuration. Unfortunately, commons-configuration depends in turn on an older version of commons-lang. Because both dependencies have a compile scope, both versions of the commons-lang library will end up in the final WAR, which could cause problems at runtime, as mentioned earlier.
Listing 7.4. Sample dependencies section of a pom.xml file (commons-lang)
To overcome the issue, you need to add an exclusion to the commons-configuration dependency to tell Maven to leave out the extra copy of commons-lang. The next listing shows the changed pom.xml snippet.
Listing 7.5. Revised dependencies section of a pom.xml file
Now that you know how to navigate out of dependency hell, we’ll move on to SonarQube’s library-search function.
7.2.6. Who uses this library
Libraries have been a boon to software development, but that doesn’t mean they’re trouble-free. Unfortunately, many things can go wrong. Consider the following example. Tom works for a Java software company. Most of the applications developed in the company use the Apache commons-io library for file handling. Once in a while, each project team checks for a new version of the library. They review the release notes and then decide whether to upgrade their project to the newest version.
Suppose that six months after the latest release of commons-io, a security issue is discovered. Because there’s no standard process for library upgrades—when and if libraries are upgraded is up to each team—nobody has a global view of which projects and which libraries currently use the problem version.
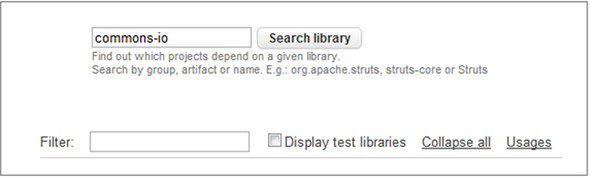
A manual search would be tedious, time-consuming, and error-prone. Fortunately, SonarQube makes it easy with not one but two ways to search for library dependencies. It’s worth mentioning that this functionality is unique: you can’t find anything similar in other software quality tools. From the home page, you can click the Dependencies link in the left rail and then enter the name of the library in the text box. Or, from the project Libraries page, you can click the Usages link. Both entry points are shown in figure 7.15.
Figure 7.15. You can reach the dependencies view via two entry points in SonarQube.
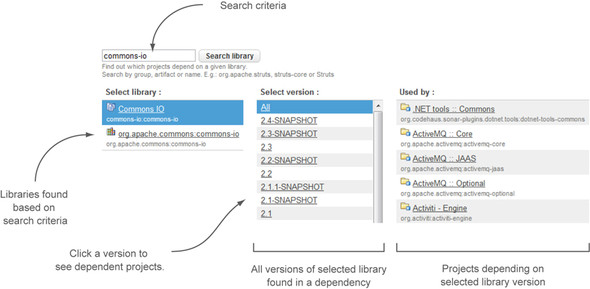
As figure 7.16 shows, the dependencies view is a comprehensive screen divided into three panels. First is a list of all libraries matching the search criteria. Click a row here, and the middle panel lists all the versions found as dependencies in SonarQube. Click a version, and the last panel is filtered to show the projects/modules that use the selected version. You’re done. With a search and three clicks, you can find all the uses of a specific library version.
Figure 7.16. Finding library dependencies
Next, we’ll move away from library dependencies but stick to the package interactions theme by discussing the ability SonarQube gives you to add governance around the interactions within a system.
7.3. Defining your architectural rule set
The majority of modern enterprise systems are based on n-tiered architectures. This allows developers to build software in logical layers. Each layer should only interact with the next lower layer via a predefined interface. Internal properties should also be hidden from other layers. These architectures borrow basic principles and ideas from the Open Systems Interconnection (OSI) model (http://en.wikipedia.org/wiki/OSI_model), which targets communication systems.
You Java folks who wrote code in Java EE, Spring, or Struts a decade ago are probably familiar with the similar Model-View-Controller (MVC) design pattern for building an application in distinct tiers.
Model-View-Controller (MVC) is a software design pattern that lets you separate the user interface from the representation of data. The model consists of application data and business rules. The controller is the go-between: it’s the part responsible for translating data and commands between the model and the view. The view shows (in various ways) the data the model knows.
Assume that an accident happened in your area. The model in this case is the data: where exactly it happened, how many cars were involved, any injuries, and so on. A local TV channel, the controller, covered the event, and a short segment will be shown on the evening news. Your TV is the view, and you click your remote control to pick your favorite channel.
What’s the story with SonarQube and all this architectural layers stuff? As with every design pattern, MVC is a design principle. It gives you guidelines about structuring your applications, but it doesn’t obligate you to follow any rules. Fortunately, SonarQube allows you to define architectural rules to police access among layers.
Before we explain how, figure 7.17 shows the layers in an MVC-structured application. Similar layers and technologies apply to .NET and other languages. It’s a common practice to name all packages in each layer with a prefix to suggest their location in the MVC structure. For example, packages in the presentation layer are often named com.mycompany.ui.* for user interface, or com.mycompany.web.. In the business logic layer, it would be something like com.mycompany.ejb.*; and in the persistence layer, com.mycompany.model.* or even com.mycompany.hibernate.*.
Figure 7.17. Typical layered architecture of a Java EE application

According to the MVC pattern, there should be no access from the data layer (com.mycompany.model.*) directly to the view layer (com.mycompany.ui.*). Although it would be great to prevent such access, you can’t. But you’re not entirely powerless. You can’t remove the possibility of creating those interactions, but you can catch them and correct them quickly with SonarQube’s architectural rules. This feature is only available for Java projects with activated byte-code analysis (which is on by default in SonarQube), so be aware that if you enable the sonar.skipDesign property, you won’t be able to use it (see appendix B for more details).
Chapter 2 discussed issues and where they come from, and chapter 13 will give you full details on administering rule sets. Here we’ll just provide a few guidelines on how to activate and customize SonarQube’s architectural rules.
First, there’s only one rule you care about at this point: it’s named architectural constraint, and it’s deactivated. This is the rule you’ll use to set up your constraints. SonarQube offers a few rules that act as templates, and the architectural constraint rule is one of them. That means you can modify it directly to impose a single architectural constraint, or you can make multiple copies of it and set up as many constraints as you’d like. Clearly, the second route is best.
You’ll have the opportunity to name your copies. It’s a good practice to give each one a name that reminds you of its purpose; and although the name doesn’t need to be unique, it’s a good idea.
You also need to supply fromClasses and toClasses properties, and this is where the rubber meets the road. Once enabled, your new rule will flag as an issue every instance of something in the fromClasses category accessing something in toClasses. Both inputs accept class names or packages names, and using wildcards to broaden a rule’s scope means you don’t have to maintain a lot of granular rules.
Defining an architectural rule set especially for large-scale layered systems is a powerful feature of SonarQube. But after a while you may find yourself writing overlapping rules or rules that seem to be hierarchically connected to each other. How does SonarQube deal with those rules? Well, each rule is handled in isolation; so if two or more rules check overlapping constraints, you’ll get one issue for each rule.
Once you’re done creating rules, be sure to run a new analysis to check your work. In fact, because no syntax checker is built in to rule administration, it may be useful to start with a test rule you know will be broken so you can verify your methodology. It will be easy enough to get rid of it if you don’t need it.
7.4. Summary
Measuring design and architecture quality can be difficult to get your head around. Fortunately, SonarQube generates metrics for these facets of program quality and presents them in ways that are easy to understand. All you have to do is to look over metrics and take action, if needed.
We hope you’ve learned the following by reading this chapter:
- Dependency cycles can decrease the productivity, maintainability, and compatibility of your project.
- The Dependency Structure Matrix (DSM) is a valuable tool to recognize cycles in your projects and dependencies between software components.
- If you’re in a Maven-oriented software house, SonarQube makes finding dependencies in your projects quick and easy.
- SonarQube lets you set custom architectural rules to monitor access between specific packages and help you maintain the cleanliness of your application layers.
At this point, we’ve covered all seven of SonarQube’s Axes of Quality, and you have a thorough grounding in what SonarQube has to tell you. Unless you’re on a brand new, greenfields project, you’re likely feeling a little overwhelmed by what you’ve learned and the magnitude of the technical debt SonarQube has revealed. In the next few chapters, we’ll look at how to deal with that technical debt—from high-level strategies to day-to-day operational tactics.
Unless you’re very lucky, you’ve used SonarQube to kick over a rock. Now we’ll show you how to deal with what’s underneath.