
Replaying production data as fast as possible (instead of in real time) can give you insight into where your bottlenecks are.
- Make sure the MySQL production database server is up and running.
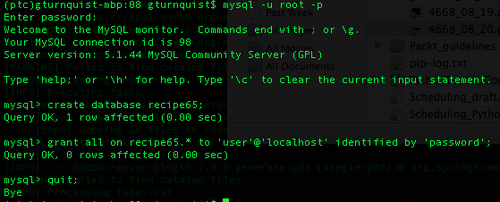
- Open a command-line MySQL client shell as the root user.
- Create a database for this recipe called
recipe65as well as a user with permission to access it. - Exit the shell.
In these steps, we will write some code that lets us put a big load on our system.
- Write a script called
recipe65_livedata.pythat simulates live data being sent every one to ten seconds.import random import sys import time from network import * from springpython.remoting.pyro import * print "Sending events to live network app. Ctrl+C to exit..." proxy = PyroProxyFactory() proxy.service_url = "PYROLOC://127.0.0.1:7766/network_advised" while True: hostname = random.choice(["pyhost1","pyhost2","pyhost3"]) condition = random.choice(["serverRestart", "lineStatus"]) severity = random.choice([1,5]) evt = Event(hostname, condition, severity) stored_event, is_active, updated_services, updated_equipment = proxy.process(evt) print "Stored event: %s" % stored_event print "Active? %s" % is_active print "Services updated: %s" % updated_services print "Equipment updated; %s" % updated_equipment print "================" time.sleep(random.choice(range(1,10))) - Write a server script called
recipe65_server.pythat initializes the database using the SQL scriptrecipe62_network.mysqlfrom Targeting the test server.from springpython.database.factory import * from springpython.database.core import * from springpython.remoting.pyro import * from springpython.aop import * from network import * from datetime import datetime import os import os.path import pickle import logging logger = logging.getLogger("springpython.remoting") loggingLevel = logging.DEBUG logger.setLevel(loggingLevel) ch = logging.StreamHandler() ch.setLevel(loggingLevel) formatter = logging.Formatter("%(asctime)s - %(name)s - %(levelname)s - %(message)s") ch.setFormatter(formatter) logger.addHandler(ch) # Initialize the database factory = MySQLConnectionFactory("user", "password", "localhost", "recipe65") dt = DatabaseTemplate(factory) sql = open("recipe62_network.mysql").read().split(";") for statement in sql: dt.execute(statement + ";") - Add some code that creates an instance of the network management application and advertises it using Pyro and Spring Python.
# Create an instance of the network management app
target_service = EventCorrelator(factory)

# Expose the original network app as a Pyro service
unadvised_service = PyroServiceExporter()
unadvised_service.service_name = "network"
unadvised_service.service = target_service
unadvised_service.after_properties_set()
- Add some more code that defines an interceptor that captures incoming event data along with a time stamp to disk.
class Recorder(MethodInterceptor): """ An interceptor that catches each event, write it to disk, then proceeds to the network management app. """ def __init__(self): self.filename = "recipe65_data.txt" self.special_char = "&&&" if os.path.exists(self.filename): os.remove(self.filename) def invoke(self, invocation): # Write data to disk with open(self.filename, "a") as f: evt = invocation.args[0] now = datetime.now() output = (evt, now) print "Recording %s" % evt f.write(pickle.dumps(output).replace( " ", "&&&") + " ") # Now call the advised service return invocation.proceed() - Add some code that wraps the network management application with the interceptor and advertises it using Pyro.
# Wrap the network app with an interceptor
advisor = ProxyFactoryObject()
advisor.target = target_service
advisor.interceptors = [Recorder()]

# Expose the advised network app as a Pyro service
advised_service = PyroServiceExporter()
advised_service.service_name = "network_advised"
advised_service.service = advisor
advised_service.after_properties_set()
- Start up the server app by typing
python recipe65_server.py. In the following screenshot, notice that there is both anetworkservice and anetwork_advisedservice registered with Pyro:
- Run the live data simulator by typing
python recipe65_livedata.pyand watch it run until it generates a few events, and then hit Ctrl+C to break out of it.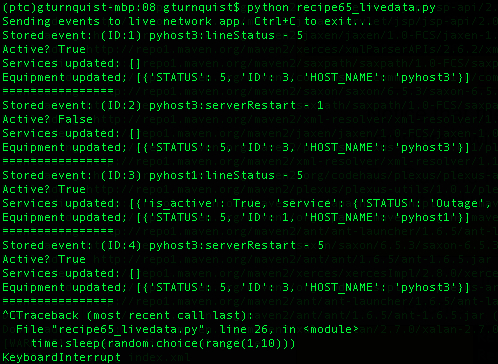
- Look at the server side of things, and notice how it recorded several events.
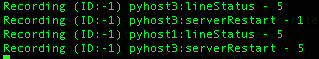
- Inspect the
recipe65_data.txtdata file, noting how each line represents a separate event and time stamp. While it's hard to decipher the data stored in a pickled format, it's possible to spot bits and pieces. - Create a playback script called
recipe65_playback.pythat de-pickles each line of the data file.from springpython.remoting.pyro import * from datetime import datetime import pickle import time with open("recipe65_data.txt") as f: lines = f.readlines() events = [pickle.loads(line.replace("&&&", " ")) for line in lines] - Define a client proxy to connect to the unadvised interface of our network management application.
print "Sending events to live network app. Ctrl+C to exit..."
proxy = PyroProxyFactory()
proxy.service_url = "PYROLOC://127.0.0.1:7766/network"
- Add code that iterates over each event, playing back the events as fast as possible.
for (e, time_it_happened) in events: stored_event, is_active, updated_services, updated_equipment = proxy.process(e)) print "Stored event: %s" % stored_event print "Active? %s" % is_active print "Services updated: %s" % updated_services print "Equipment updated; %s" % updated_equipment print "================" - Run the playback script by typing
python recipe65_playback.py, observing how it doesn't delay events but instead plays them back as fast as possible.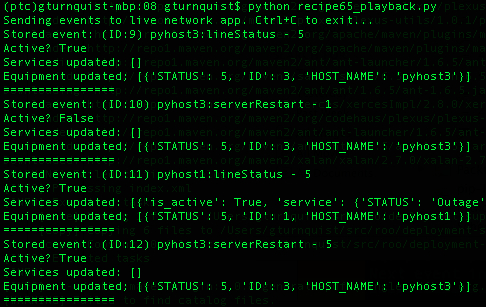
Normally, we would be recording data coming in from the live network. In this situation, we need a simulator that generates random data. The simulator we coded in this recipe is very similar to the one shown in the Coding a data simulator recipe.
To capture the data, we coded an interceptor that is embedded between Pyro and the network management application. Every event published to the network_advised Pyro service name seamlessly passes through this interceptor:
- Each event that comes in is appended to the data file that was initialized when the interceptor was first created
- The event is also stored with a copy of
datetime.now()in order to capture a time stamp - The event and time stamp are combined into a tuple, and pickled, making it easy to write and later read back from disk
- The data is pickled to make it easy to transfer to and from disk
- After writing it to disk, the interceptor calls the target service and passes the results back to the original caller
Finally, we have a playback script that reads in the data file, one event per line. It de-pickles each line into the tuple format it was originally stored in, and builds a list of events.
The list of events is then scanned, one at a time. Instead of evaluating the time stamps to figure out how long to delay playing back the events, they are injected immediately into the network management application.
The playback script uses Pyro to send the events in to the network management application, but it talks to a different exposure point. This is to avoid re-recording the same event.
The code in this recipe uses Pyro as the mechanism connecting clients and servers and communicates in a publish/subscribe paradigm. This isn't the only way to build such a service. Python has XML-RPC built in as well. It just isn't as flexible as Pyro. A more thorough analysis of real traffic is needed to determine if this interface is good enough. Alternatives include pushing events through a database EVENT table, where the client inserts rows, and the server polls the table for new rows, and then removes them as they are consumed.
This recipe also makes heavy use of Spring Python for its Aspect Oriented Programming features to insert the data recording code (http://static.springsource.org/spring-python/1.1.x/reference/html/aop.html). This provides a clean way to add the extra layer of functionality we need to sniff and record network traffic without having to touch the already built network management code.
Real time playback is useful to see how the system handles production load. But this doesn't answer the question of where the system is expected to break. Traffic flow is never steady. Instead, it often has bursts that are not expected. That is when playing back live data at an accelerated rate will help expose the system's next break points.
Preemptively addressing some of these concerns will make our system more resilient.
Admittedly, this recipe didn't break when we played back four events as fast as possible. Would this be the same result in production? Things break in different ways. We may not get a real exception or error message, but instead discover that certain parts of the system become backlogged.
That is where this recipe reaches its limit. While we have demonstrated how to overload the system with a large volume of traffic, we are NOT showing how to monitor where the bottlenecks are.
If the application under load uses database tables to queue up work, then we would need to write the code that monitors them all and report back which one is:
- the longest
- getting longer and showing no sign of catching up
- earliest in the pipeline of activity
In systems with stages of processing, there is often one bottleneck that makes itself known. When that bottleneck is fixed, it is rarely the only bottleneck. It was simply either the most critical one or the first one in a chain.
Also, this recipe cannot solve your bottleneck. The purpose of this recipe is to find it.
Tip
I once built a network load tester very much like this one. The code could handle processing lots of traffic in parallel, but events from the same device had to be processed in order. Replaying a day's worth of events all at once exposed the fact that too many events from the same device caused the entire queue system to become overloaded and starve out handling other devices. After improving the service update algorithm, we were able to replay the same load test and verify it could keep up. This helped avoid non-reproducible outages that happened after hours or on weekends.
It is useful to capture things like a 24-hour block of traffic to allow playing back an entire day of events. Another possibility is an entire week. Live systems may be apt to have different loads on weekends rather than weekdays and a week of data will allow better investigation.
The problem with this much data is that it is hard to pick out a window to investigate. This is why 24 hours of data from the weekend and 24 hours of data during the week may be more practical.
If there is some sort of network instability where huge outages are occurring and causing a huge flow of traffic, it may be useful to turn on the collector and wait for another similar outage to occur. After such an outage occurs, it may be useful to shift through the data file and trim it down to where the uptick in traffic occurred.
These types of captured scenarios are invaluable in load testing new releases, because it confirms that new patches either improve performance as expected, or at least don't reduce performance when fixing non-performance issues.
- Writing a data simulator
- Chapter 7, Building a network management application
- Recording and playing back live data in real time