- Python Testing Cookbook
- Table of Contents
- Python Testing Cookbook
- Credits
- About the Author
- About the Reviewers
- www.PacktPub.com
- Preface
- 1. Using Unittest To Develop Basic Tests
- Introduction
- Asserting the basics
- Setting up and tearing down a test harness
- Running test cases from the command line with increased verbosity
- Running a subset of test case methods
- Chaining together a suite of tests
- Defining test suites inside the test module
- Retooling old test code to run inside unittest
- Breaking down obscure tests into simple ones
- Testing the edges
- Testing corner cases by iteration
- 2. Running Automated Test Suites with Nose
- 3. Creating Testable Documentation with doctest
- Introduction
- Documenting the basics
- Catching stack traces
- Running doctests from the command line
- Coding a test harness for doctest
- Filtering out test noise
- Printing out all your documentation including a status report
- Testing the edges
- Testing corner cases by iteration
- Getting nosy with doctest
- Updating the project-level script to run this chapter's doctests
- 4. Testing Customer Stories with Behavior Driven Development
- Introduction
- Naming tests that sound like sentences and stories
- Testing separate doctest documents
- Writing a testable story with doctest
- Writing a testable novel with doctest
- Writing a testable story with Voidspace Mock and nose
- Writing a testable story with mockito and nose
- Writing a testable story with Lettuce
- Using Should DSL to write succinct assertions with Lettuce
- Updating the project-level script to run this chapter's BDD tests
- 5. High Level Customer Scenarios with Acceptance Testing
- Introduction
- Installing Pyccuracy
- Testing the basics with Pyccuracy
- Using Pyccuracy to verify web app security
- Installing the Robot Framework
- Creating a data-driven test suite with Robot
- Writing a testable story with Robot
- Tagging Robot tests and running a subset
- Testing web basics with Robot
- Using Robot to verify web app security
- Creating a project-level script to verify this chapter's acceptance tests
- 6. Integrating Automated Tests with Continuous Integration
- Introduction
- Generating a continuous integration report for Jenkins using NoseXUnit
- Configuring Jenkins to run Python tests upon commit
- Configuring Jenkins to run Python tests when scheduled
- Generating a CI report for TeamCity using teamcity-nose
- Configuring TeamCity to run Python tests upon commit
- Configuring TeamCity to run Python tests when scheduled
- 7. Measuring your Success with Test Coverage
- Introduction
- Building a network management application
- Installing and running coverage on your test suite
- Generating an HTML report using coverage
- Generating an XML report using coverage
- Getting nosy with coverage
- Filtering out test noise from coverage
- Letting Jenkins get nosy with coverage
- Updating the project-level script to provide coverage reports
- 8. Smoke/Load Testing—Testing Major Parts
- Introduction
- Defining a subset of test cases using import statements
- Leaving out integration tests
- Targeting end-to-end scenarios
- Targeting the test server
- Coding a data simulator
- Recording and playing back live data in real time
- Recording and playing back live data as fast as possible
- Automating your management demo
- 9. Good Test Habits for New and Legacy Systems
- Introduction
- Something is better than nothing
- Coverage isn't everything
- Be willing to invest in test fixtures
- If you aren't convinced on the value of testing, your team won't be either
- Harvesting metrics
- Capturing a bug in an automated test
- Separating algorithms from concurrency
- Pause to refactor when test suite takes too long to run
- Cash in on your confidence
- Be willing to throw away an entire day of changes
- Instead of shooting for 100 percent coverage, try to have a steady growth
- Randomly breaking your app can lead to better code
- Index
Using the coverage tool, generate an HTML visual coverage report. This is useful because we can drill into the source code and see what lines were not exercised in the test procedures.
Reading a coverage report without reading the source code is not very useful. It may be tempting to compare two different projects based on the coverage percentages. But unless the actual code is analyzed, this type of comparison can lead to faulty conclusions about the quality of software.
With these steps, we will explore creating a nicely viewable HTML coverage report.
- Generate coverage metrics by following the steps in Installing and running coverage on your test suite recipe and only running the first test suite (which has resulted in less than 100 percent coverage).
- Generate an HTML report by typing:
coverage.html. - Open
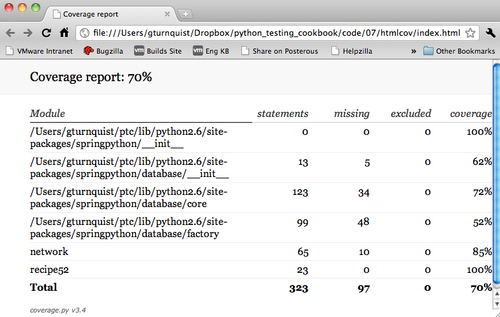
htmlcov/index.htmlusing your favorite browser and inspect the overall report.
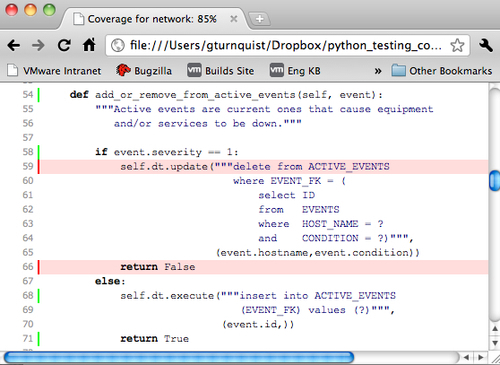
- Click on network, and scroll down to see where the event clearing logic wasn't exercised due to no clearing events being processed.

The coverage tool has a built-in feature to generate an HTML report. This provides a powerful way to visually inspect the source code and see what lines were not executed.
By looking at this report, we can clearly see that the lines not executed involve the lack of clearing network events that are being processed. This can tip us off about another test case which involves clearing events that need to be drafted.
-
No Comment
