In this recipe, we are going to create an interactive report and show you how to use it. An interactive report is a special kind of report, which offers a lot of options to the user for filtering, sorting, publishing, and much more.
It's always a good idea to start by creating a view that already selects all columns you want to show in your report. This simplifies the query required for your report region and separates the logic from presentation in your application architecture.
In this recipe, we are going to base the interactive report on the APP_VW_CONTACTS view that joins the tables for contacts, addresses, and communications. The query for this view is:
select ctt.firstname , ctt.lastname , ctt.contact_type , ads.address_type , ads.address_line1 , ads.address_line2 , ads.postcode , ads.city , ads.state , ads.country , aac.default_yn , ctt.id , ads.id from app_contacts ctt , app_addresses ads , app_ads_ctt aac where aac.ctt_id = ctt.id and aac.ads_id = ads.id
[1346_01_01.txt]
We will also need a named LOV later on in the recipe. To create it, follow the next steps:
- Go to Shared Components and then to Lists of Values.
- Click Create to make a new
LOV. - Create it from scratch and call it
ADDRESS_TYPE, it should be a dynamicLOV. - The query that it's based on is:
select rv_meaning display_value
, rv_low_value return_value
from app_ref_codes
where rv_domain = 'ADDRESSES'
[1346_01_02.txt]
The starting point for this recipe is an empty page, so the first thing that we're going to do is create a new region to contain the interactive report.
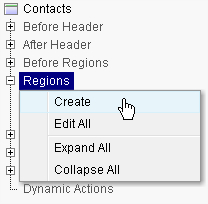
- Create a new region by right-clicking on the Regions label and select Create.
- Select Report as the type of region.
- Then select Interactive Report as the Report Implementation.
- Give the Region a title "Contacts".
- Select Region Template APEX 4.0 Reports Region. Keep the other fields on the default.
- As the source for the Region, enter the SQL Query:
SELECT *
FROM app_vw_contacts
[1346_01_03.txt]
- Leave the other options on default.
- Click Create Region to finish this part of the recipe.
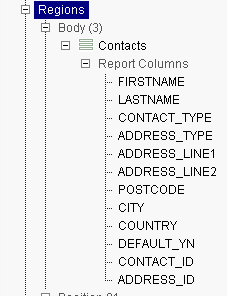
As you can see in the tree view, we now have a new Region with all columns from the view.
- When we run the page now, we can already see some data. APEX also generated a toolbar above the report that we can use to filter data or change the way it is presented.
- In the Page Definition's tree view, right-click on the Contacts Region and select Report Attributes from the pull-down menu.
- Change the heading for some of the columns:
- Firstname -> First Name
- Lastname -> Last Name
- Default Yn -> Default Address?
- Click Apply Changes to confirm the changes.
This changes the labels for some of the columns in the report. Next, we will change the presentation of the data inside one of the columns.
- Expand the tree view to show the contents of Report Columns of the Contacts Region.
- Right-click on
ADDRESS_TYPEand click Edit. - Change the item Display Text As to Display as Text (Based on LOV, escape special characters).
- Under List of Values, select Use Named List of Values to Filter Exact Match from the pull-down Column Filter List of Values.
- Select
ADDRESS_TYPEas the Named List of Values. - Click Apply Changes.
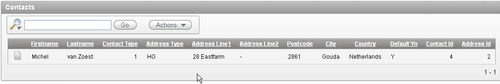
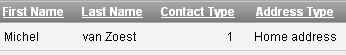
When we take a look at the page by clicking Run we can see the changes to the column names and the Address Type no longer shows the abbreviation, but the full text.
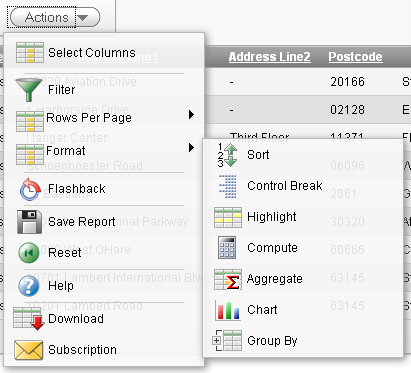
After the developer is done with creating an interactive report, the user will have a host of possibilities in the action menu to change the way the information is presented and filtered. These possibilities can be granted or revoked by the developer to an extent.
To see these options, right-click on the region and click the option named Edit region attributes. When scrolling down this screen, there are two sections for Search Bar and Download.
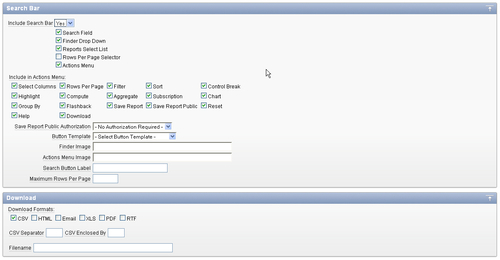
The first section holds the options that can be used in the Search Bar. When a user clicks the Action button in the Search Bar, a menu will unfold revealing all the possible options. Data can be filtered, sorted, highlighted, and aggregated for instance. It's also possible for the user to generate a chart.
When a user wants to save the changes he made to the report, this is also possible. He can save it for personal or public use, so other users can benefit as well.
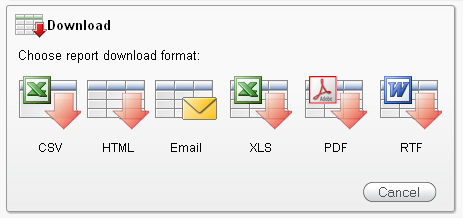
The second section holds the file types that can be used to download the information in the interactive report. These include well-known formats such as CSV, PDF, and XLS.