
In one of the previous recipes we created a datagrid, by defining all columns by hand. In that recipe we called datagrids a 'weapon' for the 'Excel-killer', as websheets are called.
Well if normal datagrids are weapons, then this recipe will show you a thermo-nuclear device.
We will create another datagrid, but this time we will base it on an existing Excel sheet and therefore adding many more possibilities.
The company that we used as an example in the datagrid recipe has decided to add two new products to their portfolio. This means that they have to do a bit more administration. Salespeople will be able to sell more types of products and this has to be recorded. Also the company wants to base the bonuses for the salespeople on the profit they make and not just on the amount of sales. In short: selling a more expensive product means a higher bonus.
To start with this administration, the company has created an Excel sheet. In this sheet each employee has a row with his or her sales per product and the bonus that is generated by those sales. Product 1 gives a bonus of 10, product 2 a bonus of 20 and product 3 a bonus of 25.
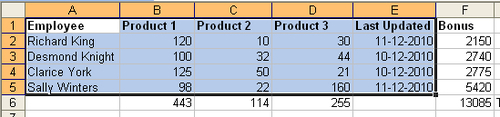
On the bottom is a row with totals for each column.
To allow employees of the administration department to see and adjust these figures from a web environment, it is decided to put this sheet into a websheet.
- Click the New Datagrid button on the right menu.
- Select Copy and Paste in the wizard and click Next.
- Name it Extended Sales Overview and paste the spreadsheet data directly into the available field. Be sure to only select the five data columns from the Excel sheet and not the computed columns and fields as shown in the screenshot. Keep the checkbox checked.
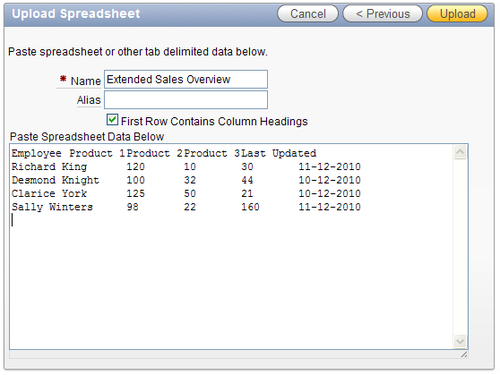
- Now click Upload and the datagrid is created.
To put this new datagrid into the existing Sales Overview page, perform the following steps:
To add the Bonus column and Total fields to the datagrid, there is still some work to do.
- Click the Edit link on the Extended Sales Overview section.
- Click on the Data Grid Name.
Now we are back at the Interactive Report for the datagrid. First, we are adding the Total fields under each of the product columns.
- Select the Action button, then Format, and then Aggregate.
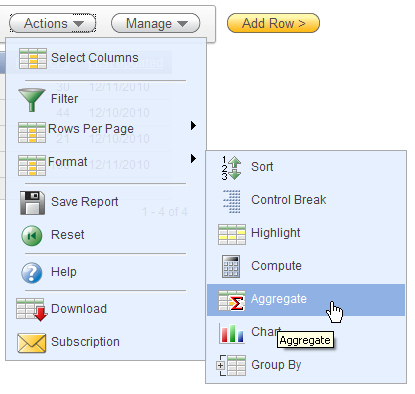
- Under Aggregation, leave the default New Aggregation.
- In Function, select Sum.
- In Column, select Product 1 and click on Apply.
- Repeat these steps for Product 2 and Product 3.
- When all three columns are done, select Actions | Save Report.
- Choose As Default Report Settings in the Save field.
- Select Primary and click Apply.
The settings are now set for all users that can view this datagrid.